Research Article: 2022 Vol: 21 Issue: 2S
Factors Affecting the Malaysian Natural Rubber Production and Consumption
Yasir Mubarak Bashier, Multimedia University
Elsadig Musa Ahmed, Multimedia University
Khalid Eltayeb Elfaki, University of Gezira
Seetahaletechmy Thambah, Cyberjaya
Aye Aye Khin, Universiti Tunku Abdul Rahman
Keywords
Natural rubber, Production, Consumption, Price, ARDL model, Malaysia.
Citation Information
Bashier, Y.M., Ahmed, E.M., Elfaki, K.E., Thambah, S., & Khin, A.A. (2022). Factors Affecting the Malaysian< Natural Rubber Production and Consumption. Academy of Strategic Management Journal, 21(S2), 1-12.
Abstract
This study examined the supply and demand of natural rubber in Malaysia, intending to identify the factors that shaped the Malaysian rubber industry production and consumption. Two models were estimated the supply and demand of natural rubber, mainly using the autoregressive distributed lag (ARDL) model cointegration approach over the period 1980-2019. The cointegration results confirmed the existence of the long run cointegration relationship in both supply and demand model. In the long run, the empirical results indicate a negative relationship between natural rubber prices (SMR20), exchange rate, and total natural rubber supply (TPNR), while the crude oil price influenced natural rubber supply positively. On the other side, the relationship between natural rubber prices (SMR20), the total stock of natural rubber in the world, and natural rubber demand (TCNR) found to be positive. The crude oil price found to have an insignificant relationship with natural rubber consumption in the long run. The models provide a valuable framework for analysing the effect of changes in major variables such as price, the total stock of natural rubber, exchange rate, and crude oil price on the supply and demand of natural rubber.
Introduction
Natural rubber is a critical and strategic industrial raw material and will remain so in the foreseeable future and is grown primarily in landholdings that small farmers own. The natural rubber industry is vulnerable to price fluctuations from world economic forces' changes like fundamental factors of production and consumption. There are many challenges from internal and external factors that impact comparative and competitive advantage in rubber scrap production in Malaysia (MRB, 2011). Therefore, according to the Economic History of Malaya (EHM) website, natural rubber was a critical pillar of Malaysia's export-oriented economy throughout much of the 20th century. Natural rubber is one of the essential raw materials in most industries in the world. In recent years, the global economy has gradually improved, and the demand for natural rubber is increasing, and so is the price of natural rubber. According to Shigematsu, et al., (2011), more than 80% of total rubber plantation areas in the world are in Asia, with Malaysia, Indonesia, and Thailand covering almost 70% of the total rubber cultivation. The Malaysian rubber industry has successfully established itself as the third-biggest producer of natural rubber (NR) in the world and produces a broad range of products from natural rubber and rubberwood products. Superior quality widely used as a benchmark in the international market. Natural rubber production in Malaysia is declining in recent years. October 2020, the production of natural rubber increased by 5.4 percent month-on-month to 48,663 tonnes (September 2020: 46,187 tonnes). Similarly, the production recorded an increase of 0.3 percent on a year-on-year basis compared to 48,528 tonnes in October 2019 (DOSM, 2020).
According to the MRB, rubber production in Malaysia is set to double by 2020, provided the government’s ambitious development plan for the industry come to fruition. The statistics from the MRB shown that, in 2013 Malaysia produced 826.421 tonnes of NR. This is a slight dropped on both 996.210 tonnes in 2011and 992.798 tonnes in 2012. In addition, Malaysia consumed around 434.192 tonnes of NR in 2013 compared with the consumption 853.446 tonnes in 2009. Figure (1) shown the Malaysian natural rubber scenario during the year 2009-2019.

Figure 1: Natural Rubber Production & Consumption In Malaysia (Tonnes)
Literature Review
Many factors are involved in both the consumption and production side to influence an economy's export performance. Several economists have emphasised the demand-side model's estimation as they have assumed the supply function is infinitely elastic. On the other hand, the supply inelasticity hypothesis's advocates ascertained that slower growth of exports of less developed countries (LDC) is mainly due to constraints on the exports' supply side. The significant constraints on the supply side are those operating in production capacity, relative profit-ability, and the factors affecting production costs. Khin et al. (2012) used crude oil price as one of the factor and the result is significant. Therefore, crude oil price is important to be added in the world natural rubber price equation. Wong (2013) attempted to find the association between exchange rate and economic growth in Malaysia, by using time series data from 1971 to 2008. ARDL model is used to investigate the short run and the long run relation between variables of the study. The Results of ARDL approach show that the decrease in the value of exchange rate helps in the growth of the Malaysian economy. Gubler & Hertweck, (2013) stated that price shocks of commodities are fundamental determinants of macroeconomics fluctuation, second only to investment-specific technology shocks for the United States of America. The researchers used quarterly data from 1955 to 2007. The method used in the research is the Structured Vector Auto-regressive model (SVAR). Shahbaz et al. (2013) found that energy consumption to impact growth in china positively used data from 1971-2011.
Faycal & Ali (2016) analysed the impact of agricultural production on Algeria's economic growth using the Autoregressive Distributed Lag (ARDL) model. This study revealed that the impact of agriculture on economic growth was negative in the long-run when governmental support was focused only on the agricultural sector's production side. Otherwise, when the support is for the agricultural sector as a whole, the impact becomes positive. Mdludin et al (2016) conducted an econometric investigation of the Malaysia natural rubber market to explore the factors behind the natural rubber industries. The results indicated that government expenditure, time trend, hectare natural rubber as well as price of palm oil affected natural rubber production in the Malaysia market. Moreover, it is also found out that the domestic natural rubber price was influenced by the world natural rubber price and the domestic inventory. Murshidi & Aralas (2017) revealed the existence of a short and long-run relationship of price shocks on crude oil, crude palm oil and rubber towards the economic growth of Malaysia using autoregressive distributed Lag (ARDL) bounds test and error correction model (ECM). The result shows that a statistically significant relationship between rubber price shocks and growth of GDP does not exist. Appiah (2018) employed an ARDL approach and used data from 1960-2015 that reported unidirectional causality from energy and growth in Ghana. Furthermore, Elfaki et al. (2018) revealed the ARDL procedure and found unidirectional causality in Sudan's energy growth.
Methodology and Estimation Procedures
The study used annual data covering the period 1980-2019 to estimate factors affecting the supply and demand of Malaysian natural rubber (NR). The data collected from various national and foreign bodies, including the Malaysian Rubber Board (MRB), Malaysia's Central Bank (Bank Negara), Malaysia (International Rubber Study Group) (IRSG), Malaysia Department for Statistics (DOSM), Association of Natural Rubber Producing Countries (ANRPC), and the Organization of the Petroleum Exporting Countries (OPEC). as shows in Table 1.
| Table 1 Definition of Variables and Source |
||
|---|---|---|
| Variables | Definition | Source |
| PSMR20 TNPR |
Average FOB yearly price of SMR20 (US$ /ton) Total production of natural rubber (000 tons) |
DOSM MRB |
| TCNR | Total consumption of natural rubber (000 tons) | MRB |
| STONR TPA |
World total stock of natural rubber (000 tons) Total Planted Area in Malaysia ( 000 Hectares) |
IRSG MRB |
| COP | Crude oil yearly price (US$/barrel) | OPEC |
| RSS1 | Average FOB yearly price of RSS1 (US$ /ton) | DOSM |
| EXM | Exchange rate for Malaysia RM to USD | BNM |
Supply side
It is important to differentiate between short and long term to estimate the NR availability. In the short term, the contributions of one or more efficient variables in a given business are calculated over time. The performance adjustments will be rendered by adjusting the control element's number of inputs (De Serpa, 1988). Based on similar factors, the equation of Malaysian natural rubber supply given as follow:
Demand side
Rubber consumption (both NR and SR) has risen significantly recently, particularly in emerging economies such as China and India, because of the fast global economic development. Global demand is forecast to hit 22.2 million tons by 2015 and 31.5 million tons by 2020 (IRGS, 2007). Nevertheless, innovations in the tire sectors are the most significant determinants of rubber production. Given the decline in rubber used as the total rubber component market has grown exponentially, rips still makeup around 50% of all today's global elastomers (natural and synthetic rubber) (Barlow et al., 1994). Based on the analysis consideration, the Malaysian natural rubber demand formulated in the following equation:

Where: µt is the error term; ß0 is the intercept; ß1, ß2, ß3, ß4, and ß5 represent the coefficients of the explanatory variables in both supply and demand equations.
Methodology
To estimate factors shaping the supply and demand of Malaysian natural rubber in the long run and short run, the study followed many steps: First, the unit root tests of Phillips-Perron (PP) (1988) and Augmented Dicky-Fuller (ADF) (1981) were used to determine whether the underlying variables are stationary or not. Second, the autoregressive distributed lag (ARDL) bounds testing approach to cointegration developed by Pesaran, Shin and Smith (2001) has been applied to test the existence of long-run cointegration relationships among the variables in supply and demand of Malaysian natural rubber equations. Third; following the previous step, the autoregressive distributed lag (ARDL) model employed to examine the long-run relationship yearly cost of average FOB of SMR20, crude oil yearly price, the exchange rate for Malaysia RM / USD, total plantation area, and total production of natural rubber in one side, and the long-run relationship between total production of natural rubber, the yearly cost of average FOB of SMR20, the total stock of natural rubber in the world, crude oil yearly price, the yearly cost of average FOB of RSS, and total consumption of natural rubber in the other side. Also, the short-run relationships for supply and demand estimated under the error correction model. Last, the diagnostic tests and residual stability were applied to ensure the fitted model's goodness and stability. Diagnostic tests are serial correlation, normality, heteroscedasticity, and Ramsey test. The study employed the cumulative sum of recursive residuals (CUSUM) and cumulative sum squared of recursive residuals (CUSUMSQ) for the stability tests.
ARDL Model Framework
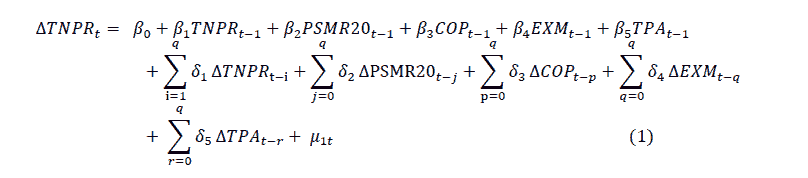
To test the existence of long-run cointegration relationships among the variables and estimate the long run and short-run relationship in Natural Rubber Supply and Natural Rubber Demand models, the autoregressive distributed lag (ARDL) bounds testing approach to cointegration developed by Pesaran, Shin and Smith (2001) has been employed. Therefore, equations (1) and (2) can be transformed into the autoregressive distributed lag (ARDL) model framework as follows respectively:
Natural Rubber Supply Model
Natural Ruber Demand Model
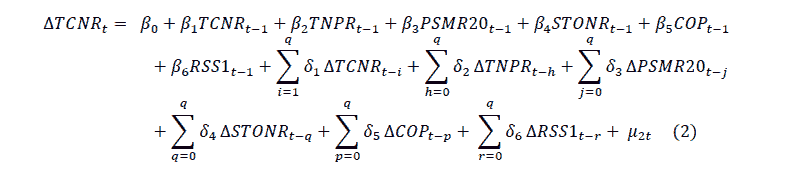
Where ? is the first difference operator, ß0 is constant; q is the optimal lag length selected based on Akaike Information Criterion (AIC). ß1, ß2, ß3, ß4, ß5, and ß6 are the long-run coefficients, d1, d2, d3, d4, d5, and d6 are the short-run coefficients, and µt is the error term.
The procedure for testing the presence of long-run cointegration relationships among the variables is using F-statistic of Wald test based on the specified null hypothesis H0: β1= β2=β3=β4=β5= β6=0 which indicate there is no long-run cointegration relationship and alternative H1: β1≠ β2≠β3 ≠β4≠β5≠ β6≠0 which ensure the existence of the long-run cointegration relationships among the variables. The calculated F-statistic will compare with the lower critical value I (0) and upper critical value I (I) of bounds test at 1%, 5%, and 10% significant level as proposed by Pesaran, Shin, and Smith (2001) to determine the conclusion regarding the existence of cointegration. Once the cointegration relationships among the variables have been established the next step is to estimate the long run and short-run relationships in Natural Rubber Supply and Natural Rubber Demand models.
Empirical Results
Table 2 summaries the descriptive analysis of all variables included in the models. The variables are NR price (PSMR20), NR production (TPNR), NR consumption (TCNR), NR stock (STONR), total planted area of NR (TPA), Ribbed Smoked Sheets Grade1 (RSS1), crude oil price (COP) and real exchange rate (EXM). The annual data from 1980-2019 has been collected for all variables. The results reveal that the minimum value of NR production (TPNR), NR consumption (TCNR), NR price (PSMR20), NR stock (STONR), total planted area of NR (TPA), Ribbed Smoked Sheets Grade1 (RSS1), Crude oil price (COP) and Real exchange rate (EXM) are accounted for 300.2740, 45.55000, 173.5400, 1001.667, 957.1000, 957.1000, 12.28000 and 2.176900 respectively. On the other hand, the maximum value of production (TPNR), NR consumption (TCNR), NR price (PSMR20), NR stock (STONR), total planted area of NR (TPA), Ribbed Smoked Sheets Grade1 (RSS1), crude oil price (COP) and real exchange rate (EXM) are accounted for 1661.600, 642.9160, 4495.417, 3092.299, 2000.000, 5168.308, 109.4500 and 4.300400 respectively.
| Table 2 Descriptive Statistics |
||||||||
|---|---|---|---|---|---|---|---|---|
| TPNR | TCNR | PSMR20 | STONR | TPA | RSS1 | COP | EXM | |
| Mean | 1094.296 | 344.2795 | 1252.247 | 1793.094 | 1442.378 | 1584.250 | 41.84000 | 3.155443 |
| Median | 1078.350 | 408.2480 | 1112.435 | 1689.792 | 1447.750 | 1185.154 | 28.62000 | 3.119850 |
| Maximum | 1661.600 | 642.9160 | 4495.417 | 3120.258 | 2000.000 | 5168.308 | 109.4500 | 4.300400 |
| Minimum | 300.2740 | 45.55000 | 173.5400 | 1001.667 | 957.1000 | 670.7218 | 12.28000 | 2.176900 |
| Std. Dev. | 321.5772 | 186.9693 | 990.9295 | 615.8098 | 402.8164 | 1013.821 | 29.26872 | 0.646474 |
| Skewness | -0.064359 | -0.380744 | 1.216614 | 0.948736 | 0.090758 | 1.697194 | 1.063468 | 0.145476 |
| Kurtosis | 2.436129 | 1.766560 | 4.477306 | 2.917228 | 1.286082 | 5.713549 | 2.929708 | 1.553720 |
| Jarqu-Bera | 0.557530 | 3.502065 | 13.50506 | 6.012085 | 4.950770 | 31.47537 | 7.547990 | 3.627296 |
| Probability | 0.756718 | 0.173595 | 0.001168 | 0.049487 | 0.084131 | 0.000000 | 0.022960 | 0.163058 |
Correlation Coefficients Analysis
The correlation coefficient analysis used to measure the strength between variables. The relationship range indicators as follows; (0.0-0.3) has little (positive/negative) correlation; (0.3-0.5) is a low (positive/negative) correlation; (0.5-0.7) is a moderate (positive/negative) correlation; (0.7-0.9) is a high (positive/negative) correlation; and (0.9-1) is a very high (positive/negative) correlation. Thus, TPNR has a high correlation with TCNR, TPA and EXM, has a moderate correlation with STONR, and has a low correlation with PSMR20, RSS1 and COP. TCNR has a very high correlation with TPA and high with EXM, moderate correlation with PSMR20, RSS1, COP, and low correlation with STONR. In the meantime, PSMR20 has a low negative correlation with TPNR and a moderate positive correlation with TCNR. Finally, PSMR20 has a positive correlation with COL and EXM. as shows in Table 3.
| Table 3 The Correlation Coefficients |
||||||||
|---|---|---|---|---|---|---|---|---|
| Variable | TPNR | TCNR | PSMR20 | STONR | TPA | RSS1 | COP | EXM |
| TPNR | 1 | |||||||
| TCNR | -0.80128 | 1 | ||||||
| PSMR20 | -0.46877 | 0.692224 | 1 | |||||
| STONR | -0.57734 | 0.485549 | 0.201145 | 1 | ||||
| TPA | 0.719962 | -0.93126 | -0.73660 | -0.62107 | 1 | |||
| RSS1 | -0.34724 | 0.552329 | 0.964315 | 0.22775 | -0.65275 | 1 | ||
| COP | -0.42525 | 0.547748 | 0.820645 | 0.497493 | -0.69417 | 0.866711 | 1 | |
| EXM | -0.77924 | 0.805417 | 0.324962 | 0.667401 | -0.81607 | 0.219566 | 0.305483 | 1 |
Unit Root Tests
Table 4 shows that the unit root test employed to investigate the data's stochastic properties, which are evaluated based on each variable's series via Augmented Dickey-Fuller (ADF) and Phillips-Perron (PP) tests. Both tests without deterministic trend proved that all variables, except crude oil, are non-stationary or integrated of order I i.e., I(1). However, under a trended test, the crude oil is found to be stationary by the PP test.
| Table 4 The Unit Root Tests |
||||||||
|---|---|---|---|---|---|---|---|---|
| Variable | Unit root PP | Unit root ADF | ||||||
| At Level | At First Difference | At Level | At First Difference | |||||
| Constant | Constant & Trend | Constant | Constant & Trend | Constant | Constant & Trend | Constant | Constant & Trend | |
| t-Statistic | t-Statistic | t-Statistic | t-Statistic | t-Statistic | t-Statistic | t-Statistic | t-Statistic | |
| TPNR | 0.0737 | -1.8346 | -4.7592*** | -4.7924*** | 0.0071 | -1.6107 | -4.9117*** | -4.9337*** |
| TCNR | -1.2422 | -1.6841 | -7.2492*** | -7.2498*** | -1.2694 | -1.7145 | -7.2492*** | -7.2531*** |
| PSMR20 | -1.7321 | -2.2119 | -5.6198*** | -5.5808*** | -1.7321 | -2.0371 | -5.6427*** | -5.6033*** |
| STONR | -0.174 | -1.8887 | -5.3647*** | -5.6709*** | -0.174 | -1.9489 | -5.3254*** | -5.6874*** |
| TPA | -1.0720 | -1.0731 | -4.6719*** | -4.7369*** | -1.0960 | -0.4133 | -4.5797*** | --4.6666*** |
| RSS1 | -1.7403 | -1.9529 | -5.5003*** | -5.4392*** | -1.7403 | -1.9529 | -5.534*** | -5.4804*** |
| COP | -1.3944 | -2.1816 | -5.4801*** | -5.4046*** | -3.825*** | -3.4338* | -2.6725* | -2.3162 |
| EXM | -1.1733 | -2.0164 | -5.0976 | -5.0198*** | -1.1733 | -2.4699 | -5.1476*** | -5.0752*** |
Bounds test cointegration result
Table 5 presents the cointegration results of natural rubber supply and natural rubber demand models. The calculated F-statistic for both exceeded the upper critical value of bounds at 1 percent. These results emphasised the presence of a long-run cointegration relationship in both natural rubber supply and natural rubber demand models at a 1% level. The variables' cointegration relationships provide evidence to estimate the long run and short-run coefficients of natural rubber supply and natural rubber demand models.
| Table 5 Cointegration Results |
||||
|---|---|---|---|---|
| Model | F-statistic | Signif. | I(0) | I(1) |
| Supply model FTNPR(TNPR/PSMR20, COP, EXM,TPA) |
7.679061 | 10% | 2.2 | 3.09 |
| 5% | 2.56 | 3.49 | ||
| 1% | 3.29 | 4.37 | ||
| Demand model FTCPR(TCPR/ TNPR,PSMR20, STONR COP, RSS1) |
||||
| 4.482093 | 10% | 2.08 | 3 | |
| 5% | 2.39 | 3.38 | ||
| 1% | 3.06 | 4.15 | ||
The Long Run Relationships
The supply model in Table 6 indicates that in the long run, the Average FOB yearly price, the exchange rate for Malaysia RM to USD, and total planted area have a significant negative relationship with the production of natural rubber 1% significant level. In comparison, Crude oil yearly price affected the production of natural rubber positively 1% significant level. These results explain a 1 percentage increase in Average FOB yearly price, the exchange rate for Malaysia RM to USD, and the total planted area will decrease natural rubber production by 0.95%, 2761.68% 4.46%, respectively. On the other hand, a one percent increase in Crude oil yearly price will reflect an increase in the production of natural rubber by 8.66%. Likewise, the demand model results presented in Table 6 point out that in the long run, the yearly cost of average FOB of SMR20 and the total stock of natural rubber in the world has a significant positive relationship with the consumption of natural rubber at 1%. In contrast, the yearly cost of an average FOB of RSS1 affected natural rubber consumption negatively at 5%. The total production of natural rubber and Crude oil yearly price was found to have an insignificant relationship with natural rubber consumption in the long run. These results explain that a one percent increase in the yearly cost of the average FOB of SMR20 and the total stock of natural rubber in the world will increase natural rubber consumption by 0.48% and 0.33%, respectively. On the other hand, a one percent increase in the yearly cost of the average FOB of RSS1 will decrease natural rubber consumption by -0.33%. After estimating the long-run relationships, the next step is to estimate the short-run relationships in both the natural rubber supply and natural rubber demand model. The results presented in Table 7.
| Table 6 The Long Run Result |
||
|---|---|---|
| Variable | Supply model | Demand model |
| Coefficient | Coefficient | |
| PSMR20 | -0.956785*** | 0.488230*** |
| COP | 8.669820*** | -5.566408 |
| EXM | -2761.682*** | |
| TPA | -4.467682*** | |
| TNPR | 0.114867 | |
| STONR | 0.335466*** | |
| RSS1 | -0.333123** | |
| C | 16613.23*** | -202.6035 |
From the results of the supply model in Table 7, it clears that the Average FOB yearly price at first lag, second lag, and third lag show a positive correlation with the total production of natural rubber in the short run. This result is in contradiction with the result in the long run. Similarly, crude oil yearly price shows an insignificant negative relationship with the total production of natural rubber. The exchange rate for Malaysia RM to USD demonstrates varied results, at the level shows a negative relationship with the total production of natural rubber at a 1 % significant level. While at the first, second, and third lag was found to have a positive relationship with the total production of natural rubber at a 1 % significant level. This result is in contradiction with the result in the long run as well. The error correction term (ECM) is statistically significant with the predicted sign (negative). The ECM reflects the speed of adjustment for the model in the long run when there is a shock in the short run. The result of the ECM revealed that this model will correct the variation from the equilibrium in the long run by 0.41% yearly if there is a shock in the short run. R2 indicates that 0.76 % of the variation in natural rubber's total production explained by the Average FOB yearly price of SMR20, crude oil yearly price, and the exchange rate for Malaysia RM to USD. Durbin-Watson statistic confirms that the model of the total production of natural rubber is free from the serial correlation problem.
Along the same line, the demand model results in Table 7 reveal that the yearly cost of average FOB of SMR20 and total production of natural rubber at the first connected negatively with the current total consumption of natural rubber at 1 % and 5%, respectively in the short run. On the other hand, the total stock of natural rubber in the world at the first lag has a positive association with natural rubber's total consumption at 5% level. The crude oil yearly price at the second lag and yearly cost of average FOB of RSS1 at the first influenced total consumption of natural rubber positively at 1% and 5% significant level respectively. This result is in contradiction with the result in the long run.
The error correction term (ECM) is statistically significant with the expected sign (negative). The ECM result revealed that variation in the equilibrium model in the long run due to the shock in the short run would be adjusted by 0.36 % per annual. R2 indicates that a 0.73 % of the variation in the total consumption of natural rubber explained by the total production of natural rubber, the yearly cost of average FOB of SMR20, the total stock of natural rubber in the world crude oil yearly price, the yearly cost of average FOB of RSS1. The statistic of Durbin-Watson confirms that the model of the total consumption of natural rubber has no serial correlation problem.
| Table 7 The Short Run Results |
||
|---|---|---|
| Variable | Supply model | Demand model |
| Coefficient | Coefficient | |
| D(PSMR20) | 0.106263*** | -0.045864 |
| D(PSMR20(-1)) | 0.299113*** | -0.133629** |
| D(PSMR20(-2)) | 0.270343*** | |
| D(PSMR20(-3)) | 0.107131*** | |
| D(COP) | -1.800002 | |
| D(COP(-1)) | -0.475349 | |
| D(COP(-2)) | 2.685643*** | |
| D(EXM) | -165.4536** | |
| D(EXM(-1)) | 768.8582*** | |
| D(EXM(-2)) | 802.2487*** | |
| D(EXM(-3)) | 600.0050*** | |
| D(TNPR) | -0.048578 | |
| D(TNPR(-1)) | -0.177662*** | |
| D(STONR) | 0.066211** | |
| D(RSS1) | 0.037493 | |
| D(RSS1(-1)) | 0.142789** | |
| ECM(-1) | -0.419692*** | -0.363600*** |
| R-squared | 0.767844 | 0.731403 |
| Durbin-Watson stat | 1.864448 | 1.960222 |
The Diagnostic and Stability Tests
To ensure the goodness of the model, the diagnostic and stability tests were applied. The diagnostic used to measure heteroscedasticity, serial correlation, normality, and functional form in the model. While the cumulative sum of recursive residuals (CUSUM) and the cumulative sum of squares of recursive residuals (CUSUMSQ) utilised to check the stability of estimated coefficients. The results of diagnostic tests presented in Table 8:
| Table 8 The Diagnostic Tests |
||
|---|---|---|
| Test | Supply model | Demand model |
| F-statistic | F-statistic | |
| Heteroscedasticity (BPG) | 0.698372(0.7524) | 1.207992(0.3403) |
| Serial Correlation LM | 0.640177(0.5382) | 0.143628(0.8672) |
| Normality | 0.77026(0.6803) | 1.1913(0.5511) |
| Ramsey RESET | 0.334992(0.5692) | 0.093814(0.7627) |
The results in Table 8 illustrates that the two models successfully passed the white heteroscedasticity serial correlation problem. The normality test approves that the error terms distributed normally. Moreover, the correct specification of the model confirmed by Ramsey RESET. Consequently, the estimated coefficients' stability in the long run and short run is approved by (CUSUM) and (CUSUMSQ) as presented in Figures 2 and 3 for the supply model and Figures 4 and 5 supply model.The straight lines are the critical bounds at a 5% significance level.

Figure 2: The Plot Of The Cumulative Sum (Cusum) Of Recursive Residuals

Figure 3: Plot Of Cumulative Sum Of Squares (Cusumsq) Of Recursive Residuals

Figure 4: Plot Of The Cumulative Sum (Cusum) Of Recursive Residuals

Figure 5: Plot Of Cumulative Sum Of Squares (Cusumsq) Of Recursive Residuals
Conclusion
This study attempts to estimate a model for the natural rubber in Malaysia, intending to identify the main factors that shaped the Malaysian rubber industry by covering the period from 1980 to 2019. To achieve the study's objective, the autoregressive distributed lag (ARDL) model (bound testing approach) employed. The empirical results based on the bound testing approach showed The empirical results based on bound testing approach showed a negative relationship between natural rubber prices (SMR20), exchange rate, and total natural rubber supply (TPNR). In contrast, the crude oil price influenced the natural rubber supply positively. However, the relationship between natural rubber prices (SMR20), the total stock of natural rubber in the world, and natural rubber demand (TCNR) found to be positive. The crude oil price found to have an insignificant relationship with natural rubber consumption in the long run. In the outlook of the natural rubber uncertainties market, policy measures including price stability should be revised and strengthened to save the rubber industry from the impact of price fluctuation.Also policy instruments are needed to improve Malaysia natural rubber competitiveness.
References
ANRPC (2016). Natural rubber trends and statistic.
Appiah, M.O. (2018). Investigating the multivariate Granger causality between energy consumption, economic growth, and CO2emissions in Ghana. Energy Policy, 112, 198-208.
Crossref, GoogleScholar, Indexed At,
Barlow, C.S., & Jayasuriya, C.S. (1994). The world rubber industry: London, Rout ledge.
Crossref, GoogleScholar, Indexed At
BNM (1997). Bank Negara Malaysia annual report 1997. Retrieved from. Department of Statistics Malaysia (2020). Balance of Payment Statistics Q1 2020.
De Serpa, A. (1988). Microeconomics theory: Issues and Applications, 2nd ed. USA.
DOSM (2018). Department of Statistics, Malaysia: Malaysia economic performance third quarter 2018.
Elfaki, K.E., Poernomo, A., Anwar, N., & Ahmad, A.A. (2018). Energy consumption and economic growth : empirical evidence for Sudan. International Journal of Energy Economics and Policy, 8(5), 35-41.
Faycal, M., & Ali, H.M. (2016). Economic growth and government subventions for agriculture sector in Algeria: an ARDL model. Arab Economic and Business Journal, 11(2), 105-114.
Crossref, GoogleScholar, Indexed At
Gubler, M., & Hertweck, M.S. (2013). Commodity price shocks and the business cycle: Structural evidence for the U.S. Journal Of International Money And Finance, 37(118306), 324-352.
Crossref, GoogleScholar, Indexed At
IRSG (2007). International rubber study group. Rubber Statistical Bulletin. Wembley: IRSG, 61.
IRSG (2018). International Rubber Study Group.
Khin, A.A., Zainalabidin, M., & Amna, A.A.H. (2012). The impact of the changes of the world crude oil prices on the natural rubber industry in Malaysia. World Applied Sciences Journal 20(5), 730-737.
Malaysian Rubber Board (2011). Annual Report-Malaysian Rubber Board 2011.
Murshidi, M., & Aralas, S. (2017). The impact of price shocks of crude oil, palm oil, and rubber towards Gross Domestic Product growth of Malaysia. Proceedings of International Conference on Economics 2017 (ICE 2017), 421-437.
MRB (2011). Natural rubber statistics. Malaysia: Malaysian Rubber Board; 2011.
Pesaran, M.H., Shin, Y., & Smith, R.J. (1999). Bounds testing approaches to the analysis of long run relationships.
Dickey, D.A., & Fuller, W.A. (1981). Likelihood ration statistics for autoregressive time series with a unit root. Econometrica, 49, 1057-1072.
Crossref, GoogleScholar, Indexed At
Philips, P.C.B., & Perron, P. (1988). Testing for unit root in time series regression. Biometrika, 75, 335-346.
Crossref, GoogleScholar, Indexed At
OPEC (2018). Organization of the petroleum exporting countries: Monthly oil market reports.
Shahbaz, M., Hye, Q.M.A., Tiwari, A.K., & Leitão, N.C. (2013). Economic growth, energy consumption, financial development, international trade and CO2emissions in Indonesia. Renewable and Sustainable Energy Reviews, 25, 109-121.
Crossref, GoogleScholar, Indexed At
Shigematsu, A., Mizoue, N., Kajisa, T., & Yoshida, S. (2011). Importance of rubber wood in wood export of Malaysia and Thailand. New Forests, 41(2), 179-189.
Crossref, GoogleScholar, Indexed At
Wong, H.T. (2013). Real exchange rate misalignment and economic growth in Malaysia. Journal of Economic Studies, 40(3), 298-313.
Crossref, GoogleScholar, Indexed At
Received: 23-Nov-2021, Manuscript No. asmj-21-9225; Editor assigned: 25-Nov-2021, PreQC No. asmj-21-925 (PQ); Reviewed: 04-Dec-2021, QC No. asmj-21-9225; Revised: 15-Dec-2021, Manuscript No. asmj-21-9225 (R); Published: 07-Jan-2022