Research Article: 2021 Vol: 24 Issue: 6S
Financial Leverage and Market Response at Industrial Level; Evidence from Emerging Stock Market of Pakistan
Shehla Akhtar, National University of Modern Languages
Sadia Saeed, National University of Modern Languages
Shazia Hassan, National Defence University
Syed Muhammad Aamir Shah, Allama Iqbal Open University
Abstract
The study empirically analyzes the influence of financial leverage on the stock market response in the non-financial sector of Pakistan. The financial leverage has been studied at a market and a firm level but the control effect of industry has not been discussed before. Apart from earlier studies, the paper brings in to focus the dimensions of stock market response including stock market reaction and the stock market returns (Cready & Gurun, 2010). Multiple financial ratios including debt to equity and debt to total capitalization are used for quantifying the financial leverage. Similarly, market to book ratio and earning yield ratios are selected for computing the stock market reaction and stock market returns. The panel regression with fixed/random effect is applied to the data comprised of 13 years from 2007 to 2019. The findings of the study support that companies should consider the contribution of financial leverage on stock market response while estimating stock valuation. Moreover, shareholders should consider the levered stocks for investment to get abnormal returns in different industries. The study provides empirical evidence for the implementation of market timing and trade-off theory in Pakistan.
Keywords
Financial Leverage, Stock Market Reaction, Stock Market Returns, Industry, Stock Market Response
Introduction
Asymmetric information prevails in financial markets so; forward-looking view is required for proper functioning of stock markets. Market players constantly monitor different factors including capital structure, monetary policy and macroeconomic factors for the futuristic observations. Any deviation from the expected capital structure of firms or industry is reacted as fluctuation in stock prices in capital markets (Pal et al., 2019). Bonaventure, et al., (2019) comment on the capital structure as a financing mix, the combination of equity and debt of any organization. Nenu, et al., (2018) view capital structure as raising funds using internal and external modes of financing. Therefore, capital structure of the company is comprised of the equity financing contributed by the shareholders known as real owners of the company and the debt or hybrid financing funded by the external financers. Mohamed (2016) refers the financial leverage as a percentage of debt to the equity in the capital structure of the firm.
Capital structure theories provide that leverage finances the investments of a firm. The trade-off theory supports that the optimal level of debt financing in the firms can be attained by creating a balance among the benefits of borrowing and its costs (Nyamita, 2014). When a firm offers the debt, it gives the signal for positive cash flows expects in the future that influence stock returns (Gill & Mathur, 2011).
The main benefit for a company to use leverage is that the interest payments are non-taxable and may influence the value of the firm positively (Evgeny, 2015). Abubakar (2015) argues that the debt financing at higher levels expose the firm to the default risk in an adverse trading period. Consequently, the leveraged stocks experience an increased risk. Likewise, investors while articulating their portfolios should inculcate the risk of both firm and the industry. The investment in the highly levered companies may create adverse returns for the investors. The high-debt companies with small potential of growth, less cash flows and subsequent earnings may prove highly susceptible for investment and the same circumstances may prevail in the case of highly levered industries.
Cready & Gurun (2010) refer that a market response is associated with positive or negative shocks to required equity returns. Therefore, the market response can be split into market reaction and market return. Scordis, et al., (2008) discuss the market reaction in the context of leverage as the market reacts to the leverage increasing events as good news and leverage decreasing events as bad news. The events that increase leverage are valued positively in stocks. Such events sign as good news in the market. Market signals leverage decreasing events are usually associated with the decline in share price. Choi (2013) argues that a positive return premium in the financial market is associated with financial leverage in two ways. Financial leverage on one side reduces the residual claim of equity on firms earning but at the same time increases the corporate earning risk due to the default option. Both of these increase the growth in future corporate earnings. Value reducing effect of financial leverage is being made better by increasing the corporate earnings to equity holders that lead to increase the earning yield or return of shareholders.
Mustafa, et al., (2017); Bahreini (2019); Hassan & Gupta (2013); Shamaileh & Khanfar (2014); Ramadan (2015) conducted studies on financial leverage in the context of stock market return, profitability, operational performance and value of the firm. The current study aims to examine the financial leverage and stock market response across industries that have not been empirically evidenced before. The study has a great contribution to local and potential investors for investment decisions in non-financial industrial sector of Pakistan. It will enable the companies for accessing the worth of stocks while examining the influence of leverage on the stock market response. Moreover, the study is also valuable to shareholders to know the response of the market to the levered stocks.
Review of Literature
Financial leverage is stated as the level of a firm reliance on debt (Hillier et al., 2010). The contrasting views exist regarding financial leverage in the literature. Modigliani & Miller (1958) argue that the worth of levered and unlevered firm having similar investment prospects becomes equal with zero taxes in perfect markets. Practically, the market is not perfect and the issue of debt signals increases the value of the firm informing the market that the company is intended to make a cash payment to their creditors through investing in profitable projects (Ross, 1977). That’s how leverage serves as an incentive and commitment tool. Thus, the firm’s value rises in the market by the debt issuance rather than equity and hence, lowers the agency costs.
It’s difficult to establish an optimal capital structure but the available ranges aggravate an efficient utilization of debt and hence raises the market value (De Wet, 2006). Such range may vary across the industries. Nevertheless, Awan, Rashid & Rehman (2011) discovered the existence of a definite and unique feature for capital structure determination in every industry, different from others. Therefore, the combined sector results cannot be inferred as that of the specific industry. The authors considered 33 industries of Pakistan and found that profitability has a significant impact on the leverage in the sugar industry. In addition, Javid & Imad (2012) explored the different factors to determine long-term and short-term debts in the non-financial listed firms in Pakistan and set up lethargy and industry-specific effect. Likewise, industry nature has a pivotal role in determining the relationship of leverage with other variables.
Moreover, Florou & Chalevas (2010) observe a relationship between debt and stock market returns. Pachori & Totala (2012) found that financial leverage has a non-substantial effect on shareholder’s returns and market capitalization. In contrast, Hasan & Gupta (2013) found that financial leverage and stock holder’s returns are correlated to each other in a dataset of 28 companies of Bangladesh. The relationship between debt and stock returns are mixed in empirical finance. Acheampong, et al., (2014) found that there exists negative correlation between these two variables. Contrastingly, Matemilola, Bany-Ariffin & Azman-Saini (2013) evidenced positive relationship between leverage and stock returns. Mustafa et al., (2017) investigated that influence of financial leverage on stock returns of the non-financial sector does not exist in Pakistan. In contrast, Nenu, et al., (2018) provide empirical evidence for a positive relationship between financial leverage and stock price volatility in the Bucharest stock exchange. Do, et al., (2020) argue that one of the styles for investment could be financial leverage. Some investors select levered stocks while others prefer all equity stocks. This leverage clientele generates co-movement between levered and unlevered equities. Kalantonis, et al., (2021) demonstrates that packing order theory implement in 154 listed firms of Athens stock exchange. The findings of the study support the internal financing over external financing. The current study is the extension of the above studies and focuses on the impact of financial leverage on the stock market response with the industry control effect.
Research Questions
• Do traditional capital structure theories support leverage and stock market response in the context of investment decisions?
• Does the stock market respond to capital structure with the controlled effect of industries?
Theoretical Framework
The theories about leverage and stock market response are mixed in nature. The default premium theory demonstrates that change in financial leverage affect the price of equities negatively. A firm from any industry if uses debt capacity beyond the safer limit the default risk in the equities will be priced which will result in a plunge down in the stock prices. Conversely, Market timing hypothesis shows a positive relationship of financial leverage with stock returns. Leverage decreasing activities are negatively priced in stocks but on the other hand an increase in leverage activities is positively priced in the firm’s equity of any industry shows in Figure 1.

Figure 1: Study Model
The trade-off theory explores a cost-benefit analysis between the cost of bankruptcy and tax shield. The marginal advantage and cost of increasing debt financing are not the same, so the value optimization of the company emphasizes the theory of trade-off while choosing the proportion of loan and equity in designing the financing mix. Optimal target debt ratio exists that signal to improve the net worth of the company and its stock price. The discussion leads to generate the following hypotheses.
Hypotheses
H1 Financial leverage affects stock market response in various industrial sectors of Pakistan.
H2 Financial leverage does not affect financial leverage and stock market response in various industrial sectors of Pakistan.
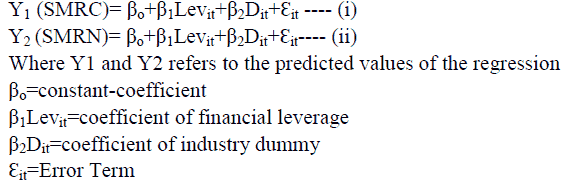
Econometric Model
From theoretical framework the econometric model for the study is formulated. It is narrated as;
Study Design & Methodology
Population & Sample
The data population comprises of the public limited companies listed on PSX. There are 664 listed companies including 34 (non-financial and financial) sectors. The sample size consists of 436 listed public companies at PSX in 22 non-financial sector industries. For instance, the financial statements of the financial sectors are structured as per the laws governing financial intermediaries and their funding sources also vary from that of the non-financial segments.
Data Collection & Analysis Techniques
The data for the study during the time frame 2007-2019 has been collected from the business recorder, investing com, annual reports, and SPB’s Financial Statement Analysis.
For the data analysis by the panel the random/fixed effect model has been applied. Prior to that Levin & Chu (2002) test and heteroskedasticity tests are applied to verify the Stationarity and reliability testing.
Measurement of Variables
To define and operationalize the study variables, the following proxies are used on the criteria adapted from literature.
Financial Leverage
According to Mule (2015); Hillier, et al., (2010) Leverage is an indication of the level of usage of debts compared to the equity in a financing structure of a firm. The broader indicators used to measure the leverage as discussed in the above literature are;
• Debt to equity ratio=Debt/Common Equity
• Debt to total capitalization=Total debt/Total capitalization
Stock Market Response
William, et al., (2010) refer to the market response as associated with positive or negative shocks to required equity returns. Therefore, the market response can be split into market reaction and market returns.
Stock Market Reaction (SMRC)
Scordis, et al., (2008) explain the market reaction in the context of leverage as the market responds to the events which increase the leverage, i.e., good news and leverage decreasing events as bad news. The historical trend revealed from the study data (2007 to 2019) of the market to book value recommends that a change in leverage ratio from time t0 to t1 brings a respective change in the stated ratio for similar firms. Hence, the phenomena predict certain responsiveness of market price towards a firm’s leverage. Therefore, the market value to book value ratio is represented as;
Market to book-value ratio=MBV=Market Value per Share/Book-Value per Share
Stock Market Returns (SMRN)
Choi (2013) refers that a positive return premium in the financial market is associated with financial leverage because financial leverage reduces the residual claim of equity on firms earning and increases the corporate earning risk due to the default option as well. Both of them increase the earning yield or return of shareholders given as;
Stock Market Return=Earnings per Share (EPS)/Market Price per Share (MPS)
Industry Effect (D)
Frank & Goyal (2009) state that the industry is anticipated to influence the firm’s financial leverage. The variation in leverage risk across different industries affects their respective returns (Hillier et al., 2008). The industry effect is determined by employing industry dummies across 22 non-financial sectors listed at PSX.
Statistical Analysis
Panel Unit Root Test (PURT)
The PURT recommended by Levin, Lin & Chu (2002) has been applied to test the Stationarity of balanced panels. Result of test is stated in table 1 which validates the significance. The statistical check approves the Stationarity of times series data.
| Table 1 Levin, Lin and Chu Test |
||
|---|---|---|
| Variables | Statstics | P-Value |
| D/E | -2.25158 | 0.0122** |
| DTC | -5.02025 | 0.0000*** |
| M/B | -2.07156 | 0.0192** |
| EY | -1.64761 | 0.0497** |
Descriptive Statistics
The standard deviation, skewness and kurtosis lie in the appropriate acceptable ranges represented by the table 2. The kurtosis is leptokurtic denoting the presence of extreme values commonly found in the data. M/B ratio is skewed towards left whereas the rest of the variables are positively skewed.
| Table 2 Means, Standard Deviation, Skewness, Kurtosis Statistics |
||||
|---|---|---|---|---|
| Scales | Mean (SD) | Skewness | Kurtosis | |
| 1 | D/E | 0.3646 (0.694) | 2.599407 | 10.19274 |
| 2 | DTC | 0.5704 (0.575) | 1.794719 | 7.767867 |
| 3 | M/B | 1.1072 (1.074) | -2.16473 | 12.62135 |
| 4 | EY | 0.0572 (11.29) | 10.32385 | 291.1502 |
Heteroskedasticity Test
The heteroskedasticity is determined by using the pattern of residual plots in OLS. The standardized residual plots verify the absence of heteroskedasticity among the data observations.
Analysis of Correlation
Table 3 reports a low magnitude of association among the predictor, predicted and control variable verify the nonexistence of multicollinearity.
| Table 3 Correlation Matrix Among Predictor, Predicted & Control Variables |
||||
|---|---|---|---|---|
| D/E | DTC | M/B | EY | |
| D/E | 1 | |||
| DTC | 0.085 | 1 | 1 | |
| M/B | 0.134* | -0.065 | -0.011 | |
| EY | -0.127* | 0.009 | 1 | |
Panel Regression
The leverage ratios with 22 industrial dummies are regressed against the stock market response in the following pattern.
? A panel regression between leverage (D/E) and stock market reaction (M/B ).
? A panel regression between leverage (DTC) and stock market reaction (M/B).
? A panel regression between leverage (D/E) and stock market returns (E/Y).
? A panel regression between leverage (DTC) and stock market returns (E/Y).
Regression Analysis
The model of Fixed/random effect is applied in the Panel data setting after confirmation of the Housman test. In table 4, first-panel regression statistical results reveal a good model fit as the statistic F is highly significant. The debt-to-equity ratio is accountable for a 28.85% effect on the market to book value. The beta coefficients of industry effect show that D15, the chemical industry, and D21, there was some sectors that were proved to be the substantial factors in the contribution to the reaction of stock market including food and self-care items industries.
In second-panel regression (table 4), the leverage (DTC), has no major or substantial effect on the stock market reaction (M/B). Results of the study support Dessi and Robertson (2003). They empirically evidence about a lack of relation among leverage and firm’s value. The controlling effect of industry proves to be significant with D15, chemical, and D21, personal care products.
| Table 4 Regression Statistics to Estimate the Effect of Leverage on Stock Market Reaction with Control Effect of Industry |
||||||||||
|---|---|---|---|---|---|---|---|---|---|---|
| Variable | D/E versus M/B | DTC versus M/B | ||||||||
| Coefficient | std. Error | t-Statistic | P Value | Coefficient | std. Error | t-Statistic | P Value | |||
| D/E | 0.288525 | 0.089696 | 3.216699 | 0.0014*** | 0.11765 | 0.076886 | -1.530177 | 0.1266 | ||
| D2 | -0.214249 | 0.289704 | -0.739545 | 0.4599 | 0.031197 | 0.278924 | 0.111847 | 0.911 | ||
| D3 | -0.420867 | 0.440639 | -0.955129 | 0.3399 | -0.390332 | 0.43276 | -0.901959 | 0.3675 | ||
| D4 | 0.78631 | 0.440271 | 1.78597 | 0.0747 | 0.752284 | 0.447596 | 1.680722 | 0.0934 | ||
| D5 | 0.543573 | 0.738667 | 0.735883 | 0.4621 | 0.547976 | 0.719607 | 0.761494 | 0.4467 | ||
| D6 | -0.159666 | 0.380738 | -0.419359 | 0.6751 | -0.084294 | 0.367675 | -0.229263 | 0.8188 | ||
| D7 | 0.204149 | 0.489053 | 0.417438 | 0.6765 | 0.130887 | 0.476771 | 0.274528 | 0.7838 | ||
| D8 | 0.5474 | 0.692448 | 0.790529 | 0.429 | 0.433291 | 0.6766 | 0.640394 | 0.5222 | ||
| D9 | 0.412233 | 0.328727 | 1.25403 | 0.2104 | 0.30884 | 0.338819 | 0.91152 | 0.3624 | ||
| D10 | 0.40796 | 0.564096 | 0.72321 | 0.4699 | 0.347583 | 0.55636 | 0.624746 | 0.5324 | ||
| D11 | 0.173125 | 0.374434 | 0.462365 | 0.644 | 0.347583 | 0.55636 | 0.624746 | 0.5324 | ||
| D13 | 0.167762 | 0.404578 | 0.414659 | 0.6786 | 0.130094 | 0.427466 | 0.304338 | 0.761 | ||
| D12 | -0.284713 | 0.373255 | -0.762784 | 0.4459 | -0.460904 | 0.366208 | -1.258583 | 0.2087 | ||
| D14 | -0.056511 | 0.689876 | -0.081915 | 0.9347 | -0.151201 | 0.685906 | -0.22044 | 0.8256 | ||
| D15 | 1.733954 | 0.975662 | 1.777208 | 0.0761* | 1.866741 | 0.961481 | 1.941527 | 0.0527* | ||
| D17 | -0.121411 | 0.297466 | -0.40815 | 0.6833 | -0.029901 | 0.298641 | -0.100123 | 0.9203 | ||
| D18 | 0.250245 | 0.370945 | 0.674613 | 0.5002 | 0.268501 | 0.380626 | 0.705419 | 0.4809 | ||
| D19 | -0.639844 | 0.443035 | -1.444231 | 0.1493 | -0.401763 | 0.431056 | -0.932044 | 0.3517 | ||
| D20 | -0.416221 | 0.975486 | -0.426681 | 0.6698 | -0.380581 | 0.934572 | -0.407225 | 0.684 | ||
| D21 | 1.102061 | 0.352791 | 3.123835 | 0.0019*** | 0.974433 | 0.357197 | 2.727996 0.0066*** | |||
| D22 | 0.399231 | 0.304941 | 1.309207 | 0.191 | 0.446749 | 0.305894 | 1.460468 | 0.1448 | ||
| C | 0.219488 | 0.07072 | 3.103615 | 0.002 | 0.318665 | 0.079241 | 4.021454 | 0.0001 | ||
| Diagnostics | ||||||||||
| R-squared | 0.202508 | 0.17031 | ||||||||
| Adjusted R-squared | 0.16346 | 0.12968 | ||||||||
| F-statistic | 5.186067 | 4.19229 | ||||||||
| Prob (F-statistic) | 0 | 0 | ||||||||
| Durbin-Watson stat | 1.60447 | 0.763914 | ||||||||
The debt-to-equity ratio and the industry are regressed with stock market returns (E/Y) in table 5. The leverage (D/E) beta is negative but insignificant showing that the debt-to-equity ratio has no influence on the returns. The industry prototypes are also noticed not to be very substantia.
In table 5, the beta coefficients represent that financial leverage (DTC) strongly influences stock market returns (E/Y) in the fourth-panel regression. The result of the study has found that there is no significant industrial effect in predicting stock market returns at PSX.
| Table 5 Regression Statistics to Estimate the Effect of Leverage on Stock Market Returns with Control Effect of Industry |
||||||||
|---|---|---|---|---|---|---|---|---|
| Variable | D/E versus EY | DTC versus EY | ||||||
| Coefficient | Std. Error | t-Statistic | P Value | Coefficient | Std. Error | t-Statistic | P Value | |
| D/E | -0.488625 | 0.415346 | -1.176429 | 0.24 | 0.900277 | 0.370992 | 2.426674 | 0.0156** |
| D2 | -0.261447 | 1.18951 | -0.219794 | 0.8261 | -0.846529 | 1.186582 | -0.713418 | 0.4759 |
| D3 | -0.463551 | 2.135817 | -0.217037 | 0.8283 | 0.950915 | 2.138363 | -0.444693 | 0.6567 |
| D4 | -2.095333 | 3.07091 | -0.682317 | 0.4953 | -2.195177 | 3.05282 | -0.719065 | 0.4724 |
| D5 | -1.577881 | 3.396232 | -0.464598 | 0.6424 | -1.746193 | 3.381165 | -0.516447 | 0.6058 |
| D6 | 0.171114 | 1.531485 | 0.111731 | 0.9111 | 0.313113 | 1.52622 | 0.205156 | 0.8375 |
| D7 | -1.721987 | 2.17208 | -0.792782 | 0.4283 | -1.638899 | 2.162998 | -0.757698 | 0.449 |
| D8 | 0.433948 | 3.37875 | 0.128435 | 0.8979 | 0.927478 | 3.360951 | 0.275957 | 0.7827 |
| D9 | 0.431931 | 1.489597 | 0.289965 | 0.772 | 0.494283 | 1.482875 | 0.333327 | 0.7390 |
| D10 | 1.521995 | 3.246342 | 0.468834 | 0.6394 | 1.639155 | 3.228499 | 0.507714 | 0.6119 |
| D11 | -0.109346 | 1.737732 | -0.062925 | 0.9499 | 0.189579 | 1.731963 | 0.109459 | 0.9129 |
| D12 | 0.753092 | 1.79883 | 0.418657 | 0.6756 | 0.7472 | 1.789585 | 0.413544 | 0.6794 |
| D13 | 0.961542 | 4.088198 | 0.235199 | 0.8141 | 0.662277 | 4.05502 | 0.163323 | 0.8703 |
| D14 | 0.214844 | 5.833308 | 0.036831 | 0.9706 | 0.605828 | 5.785252 | 0.104719 | 0.9166 |
| D15 | -0.34378 | 4.940822 | -0.069579 | 0.9446 | -0.731887 | 4.919404 | -0.148776 | 0.8818 |
| D17 | 0.061203 | 1.268201 | 0.04826 | 0.9615 | 0.105479 | 1.262759 | 0.083531 | 0.9335 |
| D18 | -0.250897 | 1.634872 | -0.153466 | 0.8781 | -0.668111 | 1.635351 | -0.408543 | 0.683 |
| D19 | 3.640476 | 1.998797 | 1.821334 | 0.0691 | 2.939544 | 1.98284 | 1.482492 | 0.1388 |
| D20 | -0.042704 | 3.573804 | -0.011949 | 0.9905 | 0.389705 | 3.561323 | 0.109427 | 0.9129 |
| D21 | 1.165567 | 1.701094 | 0.685187 | 0.4935 | 1.147433 | 1.692149 | 0.678092 | 0.498 |
| D22 | -0.031763 | 1.317995 | -0.0241 | 0.9808 | 0.229196 | 1.303136 | 0.17588 | 0.8605 |
| C | -0.754894 | 0.566952 | -1.331494 | 0.1836 | -1.175905 | 0.582889 | -2.017374 | 0.0442 |
| Diagnostics | ||||||||
| R-squared | 0.165527 | 0.170417 | ||||||
| Adjusted R-squared | 0.124668 | 0.129797 | ||||||
| S.D. dependent variable | 4.859603 | 4.54908 | ||||||
| F-statistic | 4.051154 | 4.195398 | ||||||
| Durbin-Watson stat | 2.446666 | 2.449868 | ||||||
| Prob (F-statistic) | 0.000000 | 0.000000 | ||||||
The robustness check is justified with the introduction of the multiple proxies being used to measure the same construct. For instance, leverage includes D/E & DTC while response of the stock market is measured with the use of reaction of the stock market and returns represented by different ratios.
The study results support the hypotheses H1 that financial leverage poses a significant influence on the response of the stock market in various industrial sectors of Pakistan.
The possible reason for the industry effect of food and personal care products is the difference in its capital structure due to fewer investment requirements in fixed assets. In addition, the financial structure of the food and personal care products industry mainly based on foreign ownership structure which is diversified. Such companies derive and follow the capital structure from their native countries and the economies of their origin. Hence, the difference in their leverage structure may create a difference in the industry's influence on stock market reaction. The study results are in line with Tilehnouei & Shivaraj (2014) who report that the market to book equity ratio of FMCG sector, luxuries, motor cars and Information Technology industry exhibit a substantial and inverse relation with the firm leverage whereas, such relationship for other sectors proved to be not very substantial in the Indian economy.
Conclusion and Discourse
According to the result of the study it can be inferred a positive effect of leverage on the stock market reaction and returns supporting timing of market hypothesis. It refers that the increase in leverage activities is positively priced in the firms’ equities of any industry at PSX. The tradeoff theory also partially supports the study findings. As the theory states that the leverage is positively related to value in a positive direction before the attainment of the firm’s optimal capital structure. Nenu, et al., (2018) also illustrate empirically a positive association between financial leverage and stock price volatility in Bucharest stock exchange. Moreover, Jermais (2008); Adeyemi & Oboh (2011); Jameel (2013); Fosu (2013); Barakat (2014); Farooq & Masood (2016); Akhtar, Khan, Shahid & Ahmad (2016); Aveh & Awunyo-Vitor (2017) likewise establish a constructive relation among leverage and the value of the firm. Very clear justification for positive response is that global discrepancies prevail in rectifying the agency problems. In local economy, more reliance on institutional debt due to the absence of a developed public bonds selling and purchasing which may decrease the influence of security instrument holders. Practically, follow up procedures of institutional debt are weak. In addition, there is difference in the legal and institutional environment among countries. The protection provided by the law to the creditors varies from country to country as per the effectiveness of the law enforcing agencies. The Pakistani market is currently struggling towards legal and financial development. The higher development of the stock market in a country and law enforcement decreases the value with leverage (Aggarwal et al., 2008). The more developed banking sector will guarantee the enhancement of the leverage value.
Whereas the Default premium theory does not acclaim the study results as it provides a inverse relation with leverage change and the equity prices. A firm of any industry if uses debt capacity beyond the safer limit the default risk in the equities will be priced that will lead to drop the stock price. Acheampong, et al., (2014) found an inverse relation with financial leverage and return of stocks. Matemilola, Bany-Ariffin & Azman-Saini (2013) argued about the effect of leverage to the shareholder’s return. Mustafa, et al., (2017) investigated that there is no statistically significant influence of financial leverage on stock returns of the non-financial sector listed companies in the emerging markets.
Furthermore, this study observes that leverage is positively influencing the stock market response in chemical, food and personal care products sectors. It is empirically evidenced by Pal, et al., (2019). The study investigates that any deviation from the expected capital structure of firms or industry responds in the market and reflects in the share price fluctuation. The optimum capital structure is not easy to be established but there is variety of range available from which optimal usage of leverage can increase the market value (De Wet, 2006). In contrast, the range can vary among industry sectors. Though, Awan, Rashid & Rehman (2011) examined the determinants of capital structure in the Sugar and Allied industries of Pakistan. Javid & Imad (2012) establish a lethargy and industry-specific effect, and the nature of industry seems to be playing a trasparent role in identifying the relationship of leverage with other variables.
Future Directions
This study can be expanded for the exploration of the impact of leverage on the decisions of corporate governance for the purpose of maximization of the value of a firm and stock market response. Moreover, the study may incorporate risk management through derivatives for the improved stock market reaction. Future studies may discover the relationship between the zero-leverage policy and the stock market response. Furthermore, another empirical study may be carried on with overseas potential investors interested in investing in financial instruments other than equity. In addition to that, for expanding this study it can include extensive emerging markets beyond foreign markets and Pakistan Stock Exchange. How the market response in developed markets is different from emerging markets. The study is limited to nonfinancial sectors listed at PSX. Financial sectors may be considered in the future to do a comparative study.
References
- Abubakar, A. (2015). Relationship between financial leverage and financial performance of deposit money banks in Nigeria. International Journal of Economics, Commerce and Management, 3(10), 759 – 77.
- Adami, R., Gough, O., Muradoglu, G., & Sivaprasad, S. (2010). The leverage effect on stock returns. Working paper, University of Westminster, Social Science Research Network.
- Acheampong, P., Agalega, E., & Shibu, A.K. (2014). The effect of financial leverage and market size on stock returns on the Ghana Stock Exchange: Evidence from selected stocks in the manufacturing sector. International Journal of Financial Research, 5(1), 125–134.
- Adeyemi, S.B., & Oboh, C.S. (2011). Perceived relationship between corporate capital structure and firm value in Nigeria. International Journal of Business and Social Science, 2(19).
- Ahmad, H., Fida, B.A., & Zakaria, M. (2013). The co-determinants of capital structure and stock returns: Evidence from the Karachi stock exchange. Lahore Journal of Economics, 18(1), 81.
- Ardishvili, A., Cardozo, S., Harmon, S., & Vadakath, S. (1998). Towards a theory of new venture growth. Paper presented at the 1998 Babson entrepreneurship research conference, Ghent, Belgium, 21-23.
- Awan, T.N., Rashid, M., & Zia-ur-Rehman, M. (2011). Analysis of the determinants of capital structure in sugar and allied industry. International Journal of Business and Social Science, 2(1), 221-229.
- Aveh, F.K., & Awunyo-Vitor, D. (2017). Firm-specific determinants of stock prices in an emerging capital market: Evidence from Ghana stock exchange. Cogent Economics & Finance, 5(1), 1339385.
- Bahreini, V., Baghbani, M., & Bahreini, R. (2013). Analysis between financial leverage with the stock price and the operational performance of the accepted companies in Tehran’s stock market. European Online Journal of Natural and Social Sciences: Proceedings, 2(3s), 25.
- Banerjee, A. (1992) A simple model of herd behavior. The Quarterly Journal of Economics, 107, 797–817.
- Barakat, A. (2014). The impact of financial structure, financial leverage and profitability on industrial companies shares value. Research journal of Finance and Accounting, 5(1), 55-66.
- Berk, J.B. (1997). Does size really matter? Financial Analysts Journal, 53(5), 12-18.
- Bonaventure, O.C., Chitom, J.A.R., & Asika, E.R. (2019). Effect of financial mix on profitability of quoted beverage firms in Nigeria. International Journal of Accounting, Finance and Risk Management, 4(4), 102.
- Chamley, C.P. (2004). Economic models of social learning. Cambridge University Press, 1-39 & 58-91.
- Bradley, M., Jarrell, G.A., & Kim, E.H. (1984). On the existence of an optimal capital structure: Theory and evidence. Journal of Finance, 39(3), 857-878.
- Choi, J. (2013). What drives the value premium? The role of asset risk and leverage. The Review of Financial Studies, 26(11), 2845-2875.
- Cooper, D.R., Schindler, P.S., & Sun, J. (2006). Business research methods. New York: McGraw-Hill Irwin.
- Degryse. H., De Goeij, P., & Kappert, P. (2010). The impact of firm and industry characteristics on small firm’s capital structure. Small business Economics, 38, 431-447.
- Davidsson, P., & Delmar, F. (1997). High-growth firms and their contribution to employment: The case of Sweden 1987-96. Paris: OECD Working Party on SMEs.
- Dessí, R., & Robertson, D. (2003). Debt, incentives and performance: Evidence from UK panel data. The Economic Journal, 113(490), 903-919.
- De Wet, J. (2006). Determining the optimal capital structure: A practical contemporary approach. Meditari: Research Journal of the School of Accounting Sciences, 14(2), 1–16.
- Dobson, D., & Dobson, K.S. (2009). Evidenced-based practice of cognitive-behavioral therapy. New York:Guilford.
- Dobson, K., & Dozois, D. (2001). Historical and philosophical basis of cognitive behavioral therapy. In K. Dobson (Ed.), Handbook of cognitive-behavioral therapies (pp. 3–39). New York: Guilford.
- Do, H.X., Nguyen, N.H., & Nguyen, Q.M. (2020). Financial leverage and stock return comovement.
- Eatwell, J., Milgate, M., & Newman, P. (1987). The new Palgrave: A dictionary of economics.
- Evgeny, I. (2015). The impact of financial leverage on firm performance: Evidence from Russia. Journal of Corporate Finance Research, 34, 24-26.
- Farooq, M.A., & Masood, A. (2016). Impact of financial leverage on value of firms: Evidence from cement sector of Pakistan. Research Journal of Finance and Accounting, 7(9), 73-77.
- Frank, M.Z., & Goyal, V.K. (2009). Capital structure decisions: Which factors are reliably important? Financial management, 38(1), 1-37.
- Fazzari, S.M., Hubbard, R.G., Petersen, B.C., Blinder, A.S., & Poterba, J.M. (1988). Financing constraints and corporate investment. Brookings papers on economic activity, 1988(1), 141-206.
- Field, A. (2009). Discovering statistics using SPSS. Sage publications.
- Florou, C., & Chalevas, C. (2010). Key accounting value drivers that affect stock returns: Evidence from Greece. Managerial Finance, 36(11), 921–930.
- Fosu, S. (2013). Capital structure, product market competition and firm performance: Evidence from South Africa. The Quarterly review of Economics and Finance, 53(2), 140-151
- George, D., & Mallery, P. (2003). SPSS for Windows step by step: A simple guide and reference.
- Graham, J.R., Hughson, E., & Zender, J.F. (1999). Market reactions to capital structure changes: Theory and evidence. Working Paper.
- Hasan, A., & Gupta, A. (2013). The effect of leverage on shareholders' return: An empirical study on some selected listed companies in Bangladesh. European Journal of Business and Management, 5(3), 46–53.
- Hasanzadeh, R.B., Torabynia, S., Esgandari, K., & Kordbacheh, S. (2013). Evaluating effects of financial leverage on future stock value at stock exchange. Research Journal of Recent Sciences, 2(2), 81-84.
- Haugen, R.A., & Senbet, L.W. (1988). Bankruptcy and agency costs: Their significance to the theory of optimal capital structure. Journal of Financial and Quantitative Analysis, 23(1), 27-38.
- Hovakimian, G. (2009). Determinants of investment cash flow sensitivity. Financial management, 38(1), 161-183.
- Hens. T., & Steude. S.C. (2006). The leverage effect without leverage: An experimental study. National Center of Competence in research financial valuation and risk management, Working paper No.318.
- Hens, T., & Steude, S.C. (2009). The leverage effect without leverage: An experimental study. Finance Research Letters, 6(2), 83-94.
- Heshmati, H. (2001). On the growth of micro and small firms: Evidence from Sweden. Small Business Economics, 17(3), 213-228.
- Hadlock, C.J., & James, C.M. (2002). Do banks provide financial slack? The Journal of Finance, 57(3), 1383-1419.
- Hillier, D., Draper, P., & Faff, R. (2006). Do precious metals shine? An investment perspective. Financial analysts’ Journal, 98-106.
- Hillier, D., Ross, S., Westerfield, R., Jaffe, J., & Jordan, B. (2010). Corporate finance. McGraw Hill.
- Honjo, Y., & Harada, N. (2006). SME policy, financial structure and firm growth: Evidence from Japan. Small Business Economics, 27(4), 289-300.
- Johnson. T.C., Chebonenko, T., Cunha, I., Almeida, F.D., & Spencer, X, (2011). Endogenous leverage and expected stock returns. Finance Research Letters, 8(3), 132-145.
- Jang, S., & Park, K. (2011). Inter-relationship between firm growth and profitability. International Journal of Hospitality Management, 30, 1027-1035.
- Jameel Hasan, A.N. (2013). The Effect of Financial Leverage on the performance of firms listed at Palestinian security exchange-An empirical study. Alazhar University Journal, 15(1), 281-318.
- Javid, A.Y., & Imad, Q. (2012). A decomposition analysis of capital structure: Evidence from Pakistan’s manufacturing sector. The Lahore Journal of Economics, 17(1), 1-31.
- Jeremias, J. (2008). The relative influence of competitive intensity and business strategy on the relationship between financial leverage and performance. British Accounting Review, 40, 71-86.
- Kalantonis, P., Kallandranis, C., & Sotiropoulos, M. (2021). Leverage and firm performance: new evidence on the role of economic sentiment using accounting information. Journal of Capital Markets Studies.
- Kaplan, S.N., & Zingales, L. (1997). Do investment-cash flow sensitivities provide useful measures of financing constraints? The quarterly journal of economics, 112(1), 169-215.
- Levin, A., Lin, C.F., & Chu, C.S.J. (2002). Unit root tests in panel data: Asymptotic and finite-sample properties. Journal of econometrics, 108(1), 1-24.
- Markowitz, T.J., & Grinblatt, M. (1999). Do industries explain momentum? The Journal of Finance, 54(4), 1249-1290.
- Matemilola, B.T., Bany-Ariffin, A.N., & Azman-Saini, W.N.W. (2013). Impact of leverage and managerial skills on shareholders’ return. Procedia Economics and Finance, 7(3), 103-15.
- Modigliani, F., & Miller, M.H. (1958). The cost of capital, corporation finance and the theory of investment. The American economic review, 48(3), 261-297.
- Modigliani, F., & Miller, M.H. (1963). Corporate income taxes and the cost of capital: A correction. The American economic review, 433-443.
- Mohamed, I.B. (2016). Effect of financial leverage on financial performance of non-financial firms listed at the Nairobi Securities Exchange.
- Mustafa, S., Saeed, A., & Zafar, A. (2017). The effect of financial leverage and market size on stock returns on the Karachi stock exchange: Evidence from selected stocks in the non-financial sector of Pakistan. The International Journal of Business & Management, 5(10).
- Myers, S.C. (1977). Determinants of corporate borrowing. Journal of financial economics, 5(2), 147-175.
- Myers, S.C. (1984). The capital structure puzzle. The journal of finance, 39(3), 574-592.
- Myers, S.C., & Majluf, N.S. (1984). Corporate financing and investment decisions when firms have information that investors do not have. Journal of financial economics, 13(2), 187-221.
- Mumaz, R., Rauf, A., Ahmed, B., & Noreen, U. (2013). Capital structure and financial performance: Evidence from Pakistan (KSE 100 Index). Journal of Basic and applied Scientific Research, 3(4), 113-119.
- Muradoglu, G., & Sivaprasad, S. (2008). An empirical test on leverage and stock returns. The Journal of Finance, 36(6), 39-56.
- Nunnally, J.C., & Bernstein, I.H. (1994). Psychometric Theory. New York: McGraw-Hill.
- Nenu, E.A., Vintil?, G., & Gherghina, ?.C. (2018). The impact of capital structure on risk and firm performance: Empirical evidence for the Bucharest stock exchange listed companies. International Journal of Financial Studies, 6(2), 41.
- Nyamita, M.O. (2014). Factors influencing debt financing and its effects on financial performance of state corporations in Kenya. Doctorate Thesis. Durban University of Technology.
- Obreja, I. (2006). Financial leverage and the cross-section of stock returns. Review of Financial Studies, 26(5), 1146-1189.
- Okada, K. (2006). Size effect and firm size-new relationship with the value effect. Security Analysts Journal, 44(7), 1-24
- Odzagli, A.K. (2009). Financial leverage, corporate investments, and stock returns. Working paper, 09-13.
- Onwuegbuzie, A.J., & Leech, N.L. (2007). Validity and qualitative research: An oxymoron? Quality & Quantity, 41(2), 233-249.
- Onwuegbuzie, A.J., & Leech, N.L. (2005). On becoming a pragmatic researcher: The importance of combining quantitative and qualitative research methodologies. International Journal of Social Research Methodology, 8(5), 375-387.
- Pal, S., & Garg, A.K. (2019). Macroeconomic surprises and stock market responses-A study on the Indian stock market. Cogent Economics & Finance, 7(1), 1598248.
- Pachori, S., & Totala, K. (2012). Influence of financial leverage on shareholders return and market capitalization: A study of automotive cluster companies of Pithampur, India. In 2nd International Conference on Humanities, Geography and Economics (ICHGE'2012) Singapore, 23-26.
- Rajan, R.G., & Zingales, L. (1995). What do we know about capital structure? Some evidence from international data. The journal of Finance, 50(5), 1421-1460.
- Ramadan, I.Z. (2015). Leverage and the Jordanian firms' value: Empirical evidence. International Journal of Economics and Finance, 7(4), 75.
- Rezaei.F., & Habashi, S. (2012). Co-determination of capital structure and stock return through simultaneous structural equation model. Journal of Basic and Applied Scientific Research, 2(12), 12939-12948.
- Ricardo, D. (1817). On the principles of political economy and taxation. Cambridge University Press, 1, 135.
- Savage, L.J. (1954). The foundations of statistics. Wiley, New York.
- Scordis, N.A., Barrese, J., & Wang, P. (2008). The impact of cash flow volatility on systematic risk. Journal of insurance issues, 43-71.
- Shah, A., & Hijazi, T. (2004). The determinants of capital structure of stock exchange-non listed financial firms in Pakistan. Pakistan Development Review, 43, 3-27.
- Shah, A., & Khan, S., (2007). Determinants of capital structure: Evidence from Pakistani penal data. International Review of Business Research Papers, 3(4), 265-282.
- Shamaileh, M.O., & Khanfar, S.M. (2014). The effect of the financial leverage on the profitability in the tourism companies (analytical study-tourism sector-Jordan). Business and Economic Research, 4(2), 251–264.
- Siegel, J.G., & Shim, J.K. (2000). Accounting handbook. Barron's Educational Series.
- Schwartz, E. (1959). Theory of the capital structure of the firm. The Journal of Finance, 14(1), 18-39.
- Suhaila, M.K., Mahmood, W., & Mansor, W. (2008). Capital structure and firm characteristics: Some evidence from Malaysian companies, 1-16.
- Telmoudi, A., Ziadi, J., & Noubbigh, H. (2010). Factors determining operating cash flow: Case of the Tunisian commercial companies. International Journal of Business and Management, 5(5), 188-200.
- Tilehnouei, M.H., & Shivaraj, B. (2014). Relationship between market-to-book equity ratio and firm's leverage: A case study of firms listed on national stock exchange of India (NSE). Asian Journal of Research in Business Economics and Management, 4, 114.
- Tversky, A., & Kahneman, D. (1992). Advances in prospect theory: Cumulative representation of uncertainty. Journal of Risk and uncertainty, 5(4), 297-323.
- Von Neumann, J., & Morgenstern, O. (1944). Theory of games and economic behavior. Princeton University Press.
- Zeitun, R., & Tian, G.G. (2007). Capital structure and corporate performance: Evidence from Jordan. Australasian Accounting Business and finance Journal, 1(4).