Research Article: 2022 Vol: 21 Issue: 2S
Forming of the Investment Portfolio Using Sharp and Sortino Models: An Empirical Study in the Iraq Stock Exchange
Shatha Abdul Hussein Jebur, Middle Technical University/Technical College of Management
Shakir Mohsen Saber, Ministry of Transportation
Asaad Hameed Hamzah albudairi, Ministry of Higher Education and Scientific
Research Scholarships and Cultural Relations
Keywords
Stock Exchange, Sortino Models
Citation Information
Jebur, S.A.H., Saber, S.M., & Albudairi, A.H.A. (2022). Forming of the investment portfolio using sharp and Sortino models: An empirical study in the Iraq stock exchange. Academy of Strategic Management Journal, 21(S2), 1-16.
Abstract
The present study aims to test the sharp and Sortino models' ability to inform investment portfolios from the shares of companies listed in the Iraq Stock Exchange for the period from (2015-2019). The return and risk of portfolios in light of the two models were used to compare them. The cut rate was also used to evaluate the performance of portfolios and choose the best portfolio. The three researchers reached several conclusions, the most important of which was that the Sharp model measures the portfolio's return better than the Sortino model. The present study seeks to apply this method to the shares of the Iraqi market for securities for the banking sector, based on the principles of Markowitz's theory for managing investment portfolios.
Introduction
The goal of any investment activity is to achieve returns. At the same time, this activity is not without risks Fisk, Patrício, Ordanini, Miceli, Pizzetti & Parasuraman (2011). To reduce this risk, investors resort to diversifying their investments by holding investment portfolios instead of holding individual stocks, which are consistent with the investor's desire for bearing the amount of risk. Through investing their money, investors in the stock market seek to achieve the most significant returns with the lowest possible risk. Among the methods used to achieve this goal is diversifying their investments in an investment portfolio Al-Wattar, Almagtome & AL-Shafeay (2019). These methods have varied according to the investor’s vision and tendencies. Perhaps, the most important of these means or tools are forming an investment portfolio that Markowitz developed in 1956. After him, others, such as sharp, Sortino, et al., studied and created them Almagtome, Al-Yasiri, Ali, Kadhim & Bekheet (2020). Portfolio formation aims to maximize the owners' wealth by increasing the benefit achieved and reducing the risk that the investor may face. Investment portfolios are considered relatively modern financial sciences in the world of finance and business Amagtome & Alnajjar (2020). Their importance stems from the nature of the diversity of available investment tools, the multiplicity and diversity of financial and economic markets characterized by significant changes, and their high degree of vulnerability to financial and economic factors, the most important of which is economic openness and technological development, especially in the field of communications and relations. The magnitude of the surplus funds also plays an essential role in that.
The Sharpe ratio is a measure of risk-adjusted return Mahdavi (2004). This ratio has become the industry standard for those calculations Khaghaany, Kbelah & Almagtome (2019). Nobel Prize winner William F. Sharp developed this ratio that uses the Sharpe standard deviation ratio of returns in the denominator as an indicator of total portfolio risk. It is what assumes returns are normally distributed Mustafakulov & Khudoykulov (2015). Unfortunately, evidence has shown that returns on financial assets tend to deviate from a normal distribution, making the Sharpe ratio's performance misleading. The variance in the Sharpe ratio is the Sortino ratio, which may erase the benefits of upward price movements over the standard deviation. Besides, forming an investment portfolio is not an easy thing.
Many factors must be considered as there are no clear and specific rules for creating the portfolio Driessen, Van Tartwijk, Van Der Vleuten & Wass (2007). This means that building an investment portfolio requires a good study of the objectives that the owner of the portfolio seeks and what he/she wants to achieve, willingness to risk capital, and the need for high profits or low returns in exchange for the risk ratio. The issue of the investment portfolio has gained significant importance within the literature of financial management as it represents one of the essential foundations for investing in financial assets Widyawati (2020); Hameedi, Al-Fatlawi, Ali & Almagtome (2021). The diversity of the investment portfolio is substantial because it reduces the chances of some factors that hurt the portfolio Ali, Almagtome & Hameedi (2019). The portfolio formation aims to maximize wealth by increasing the benefit and reducing investors' risk Al-Fatlawi, Al Farttoosi & Almagtome (2021). The present study seeks to Analyze the return and risk of stocks for the Research Sample companies. It also aims to Form an investment portfolio based on the cutoff limit and form an investment portfolio according to the two models. Accordingly, the Sortino ratio is helpful for investors, analysts, and managers to evaluate the returns that an investment project is exposed to with a high degree of risk. This ratio uses low deviation as a measure of risk. In light of this, the present study seeks to address the sharp and Sortino models Almagtome, Khaghaany & Önce (2020). The Sortino ratio is a valuable method for investors, analysts, and managers to evaluate the returns achieved by an investment project exposed to a high degree of risk. This ratio uses low deviation as a measure of risk. The Sharpe ratio is used to distinguish reasonable risks from negative ones, which provides positive returns for investors. In light of those above, the present study is divided into four sections. Section one deals with the research methodology. Section two deals with general concepts about the portfolio and portfolio models that the study dealt with. Section three is devoted to analyzing the research variables and testing hypotheses. Section four deals with the conclusions and recommendations of the present study.
Literature Review
The portfolio is the assortment of assets kept by the investor that generate income, such as securities and real estate Kimani & Aduda (2016). The first one who wrote about managing portfolios was the scholar Markowitz (1952). This scholar is considered the first to put the basis for managing portfolios, which is a theory that shows the relationship between the risk component and the variance in the investment portfolio's return. The investment portfolio aims to meet liquidity requirements and face financial hardship by disposing of some of its assets and selling them promptly in the financial markets. In conjunction with the need to pay certain financial obligations on the management towards creditors, security will be one of the most important sources of liquidity Anjom (2020). To determine the optimal portfolio point, the concept of smoothness curves that reflect the investor's tendencies in return by risk is used Bekhet & Matar (2012). The principles of choosing the optimal investment portfolio are summarized in the following points:
1. Choosing the lowest risk portfolio in the case of equal return.
2. Selecting the highest return portfolio if the degree of risk is equal.
3. Choosing the highest return portfolio and the lowest risk in the remaining cases.
The optimal portfolio is chosen according to the investor's preferences as follows:
1. Risky portfolio optimized for the risk-averse investor.

Figure 1 Optimal Risk Portfolio for the risk Averse Inverstor
According to the above figure 1, the point (s) whose characteristics are as follows is noted (Al-Hinnawi, 2003: 277).
1. It is the point at which the slope of the efficient boundary curve begins to be inconsistent.
2. In economics terminology, it is the point of contact of the efficient boundary with the investor's normalization curve.
The investor prefers the portfolio that represents the meeting point of the efficient boundary with the higher smoothness curve.
3. The optimal risky portfolio for the risk-averse investor.

Figure 2 The Ultimate Risky Portfolio For The Hawkish Investor
In figure 2 it is noticed that point (x) occurred at a lower level than it was. The curve of the efficient boundary at this point is more significant, i.e., the investor refuses to accept an additional unit of risk unless he/she obtains a return that exceeds the return that the investor demands in exchange for a further similar team of risk. The curve of the efficient boundary at the point where the smoothness curve and the efficient bound is tangled is the highest possible slope (Issam, 2008: 206-209).

Figure 3 Lenient Investor In Aversion To Risk
Figure 3 He/she is the lenient investor in aversion to risk. The (x) point is located at a higher-end on the efficient threshold. This means that the investor does not mind accepting an additional unit of risk in exchange for a lower return than the investor's return. According to their historical sequence, the following is a presentation of portfolio theories Srivastava & Mazhar (2018). Markowitz undertook pioneering work to develop portfolio theory. He provided a conceptual framework and an analytical tool for selecting the optimal portfolio in which he explained how an investor would create his/her investment portfolio. Sharpe (1963) introduced the SINGLE INDEX MODEL. The primary variable of the single-index model is that the return on securities can be considered a single indicator of the market. Misner & Sharp (1964) developed a capital asset pricing model for how to price risky assets. CAPM attempts to find a relationship between the risk of an investment and its expected return. Expected return can be used to determine whether a stock earns more or less than its fair return. Thus, CAPM helps identify underpriced or overpriced assets. Sharpe (1994) developed Sharpe's Historical Return Index in terms of the risk-free rate of the standard deviation of portfolio returns.
Treynor concluded that standard deviation measures systemic risk and non-systemic risk. In the case of a mutual fund by creating a portfolio, non-systemic risk can be diversified, and only regular risks remain. So, the beta should be used instead of standard deviation. Jensen (1968) developed another model for evaluating portfolio performance. This scale is based on differential returns. It is known as the Jensen ratio or the Jensen index. The Jensen ratio measures the difference between the actual return of a portfolio and the portfolio's expected to return in light of the portfolio's risk. Fama (1972) tried to measure performance in terms of portfolio risk components. In this model, the risk premium consists of a risk tolerance reward and a stock selection bonus. The stock pick bonus is the better choice for stocks for a portfolio. It is the return earned on the portfolio plus the return in light of the portfolio's risk. Toppari (1996) explained portfolio selection theory, capital asset pricing theory under risky conditions, and the general behavior of stock market prices. The results obtained in all three areas are relevant to evaluating the performance of mutual funds. However, one paper emerged indicating the direction of future studies of mutual fund performance. It represents an attempt to influence the measurement and forecasting of mutual funds' performance, some recent business findings in capital theory, and the behavior of stock and market prices. SORTINO (1997) introduced a portfolio evaluation model similar to Sharpe's model in that it used standard deviation as a measure of overall risk. The Sharpe ratio is a measure of the adjusted risk-return. This ratio has become the industry standard for those accounts. The Sharpe ratio is an average return earned more than the risk-free rate of return ~ per unit price fluctuations or absolute risk. By subtracting the risk-free rate of return from the relevant ratio, the performance related to the risk-taking activity can be isolated. The nature of this calculation is that a portfolio that enters risk-free investment, such as buying US Treasury bonds (in which the expected return is the risk-free rate of return), has a Sharpe ratio equal to zero. In general, the higher the Sharpe ratio, the more attractive the risk-adjusted return is.
The Sharpe Ratio has become the most widely used method for calculating Risk-Adjusted Return (RR). However, it may be imprecise when applied to portfolios and assets that do not usually distribute expected profits. In addition, many investments have a high degree of "mechanical" or harmful twisting. The Sharpe ratio tends to fail when analyzing portfolios with significant unplanned risks such as options contracts or treasury bonds. Over the years, modified risk-return approaches were created, including the SORTINO Ratio, Return on Highest Reduction, and Trainor Ratio. Modern portfolio theory demonstrates that adding assets to a diversified portfolio with less than one link can reduce the risk of the portfolio without sacrificing return. This diversity may help increase Sharpe's portfolio ratio.
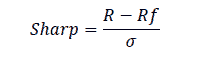
Sharpe Ratio=(Return on Interest-Free Portfolio - Rate of Risk Free Return)/Standard Deviation of Portfolio Return
The Sharpe ratio is often used to compare the change in the characteristics of the general risk-return in the portfolio when a new asset or a new class of assets is added to it. If the addition of the investment reduced the share of Sharpe, it should not be added to the portfolio. The Sharpe ratio can also help explain whether excess portfolio returns are due to smart investment decisions or excessive risk. The higher the Sharpe portfolio ratio, the better the risk-adjusted-performance. A negative Sharpe ratio indicates that the asset with the lowest risk could perform better than the help analyzed.
Sharpe’s standard deviation ratio of returns is used in the denominator as an indicator of the total risk of the portfolio, which assumes that returns are distributed normally. Evidence has shown that returns on financial assets tend to deviate from a normal distribution, making the Sharpe ratio's performance misleading. The variance in the Sharpe ratio is the SORTINO ratio, which may erase the benefits of upward price movements over the standard deviation. In doing so, it only measures yield against downward price fluctuations and uses the semi-variance function in the denominator. The Trainor Ratio uses systematic risk or beta instead of standard deviation as the metric in the denominator.
Hedge funds or portfolio managers seeking to boost a clear history of risk-adjusted returns could also manipulate the Sharpe ratio. This can be done by:
1. Prolonged measurement period; This reduces the expectation of price volatility. For example, the annual standard deviation of daily returns is generally higher than weekly returns, more elevated than monthly returns.
2. Doubling the monthly returns but calculating the standard deviation from the non-multiplying monthly returns.
3. Recording out-of-profit collateral and purchase options on the portfolio; This strategy can increase returns by collecting the premium on the option contract without repaying for several years. Plans that involve taking a hypothetical risk, liquidity risk, or other forms of catastrophic risk have the same ability to disclose the upward biased of the Sharpe ratio. An example is the Sharpe ratio in hedge funds, independent of the trends of financial markets before and after the 1998 liquidity crisis.
4. Yield Adjustment; Using specific derivative structures, referring to the illiquid asset market infrequently, or using pricing models that reduce monthly gains or losses can minimize price fluctuations.
5. Excluding excessive returns; Because these returns increase the standard deviation reported to the hedge fund, the manager can choose to try to exclude the best and worst monthly returns each year to reduce the standard deviation.
Sorento Ratio
SORENTO provided a model for evaluating the investment portfolio in 1997. It is similar to Sharpe’s model in that it used the standard deviation as a measure of total risk. According to SORTINO, the standard deviation measures the difference between the investment portfolio's returns and the minimum acceptable return for the investor. This model replaces the risk-free return. With the minimum return acceptable to the investor, which does not accept less than it, this model can also distinguish between the fluctuations of good and not good returns. The higher the model's value, the better the performance of the portfolio, and vice versa (Sourd, 2007: 31). The SORTINO ratio, known as Frank A. SORTINO, A high screening ratio indicates a low probability of significant loss. SORTINO’s balance can be calculated as follows:
The SORTINO ratio is a modification of the Sharpe ratio. Still, it uses negative deviation instead of standard deviation as a measure of risk, i.e., only those returns that fall under a specific target for the user or the required rate of return is considered risky. Interestingly, even when NOBEL LAUREATE Harry Markowitz developed the theory Modern Portfolio In 1959, he realized that negative deviation is closely related to investors. Using negative deviation to measure risk would be more appropriate than using standard deviation. In the early 1980s, Dr. Frank SORTINO researched to find an improved measure of the risk of adjusted return. According to SORTINO, Brian Rom's idea in investing terminology to call a new measure the SORTINO Ratio, the first reference to the ratio was in the Journal of the Chief Financial Officer in August 1980, and the first account was published in a series of articles in the Journal of Risk Management in September 1981. The SORTINO Ratio was defined as (Mazhar & Srivastava, 2018,96):
S=(RT)/TDD
R=average return for the period
T=Objective or required rate of return for the investment strategy under consideration
TDD=Targeted downward deviation
Both the SORTINO Ratio and the Sharpe Ratio measure risk-adjusted return for an investment strategy. Sharpe ratio uses standard deviation or total positive and negative volatility. Upside volatility is a positive return that should not be used as a measure of risk. The negative divergence is a measure of downside risk that focuses on returns that fall below zero. It is used in the SORTINO ratio. Negative deviation and the SORTINO ratio may provide a way to analyze performance with conservative investors' goals consistently. Empirically, investors want more risks when the markets rise and fewer risks when the needs are down. One potential problem with Sharpe Ratio is that it treats troubles in growing markets the same way it treats concerns in bear markets. However, conservative investors may view risks differently and have different tolerances for each. The SORTINO ratio is one of the metrics that may help an investor isolate the measure just for the stake in bear markets specifically.
The return is high when the risk is low. Thus, seeking to obtain equity exposure, treasury bonds when risk stops, and taking advantage of good cash if there is no risk opportunity to preserve capital.
There are several reasons for preferring the SORTINO ratio, including:
1. Investors generally ignore the positive volatility and focus on volatility or the risk of negative returns. If threats are measured over extended periods, the crossover ratio is ineffective in this scenario as the volatility of returns is low due to insufficient data. On the other hand, the SORTINO ratio effectively compares high volatile portfolios over shorter periods. The higher the proportion, the better.
2. The SORTINO Ratio is one way to calculate risk-adjusted returns. It best suits investors who compare portfolios based on downward volatility. Practically, one cannot ignore bullish volatility completely. Risk is a two-way concept. When risk leads to outperformance on the other side, it may also lead to underperformance.
3. The SORTINO ratio measures the excess return per unit of downside risk. The higher the SORTINO ratio, the better.
4. Rational investors are risk-averse by nature and only take risks if compensated with an additional return. The Sharpe ratio is a standard measure of the trade-off between risk and reward. Excess return is compared with the total standard deviation of returns on investments portfolio, which measures variations above the average return and those below the average return. But upward divergences are beneficial to the investor. So, the real risk that investors should be concerned about is the risk of yields falling below the average. The SORTINO ratio defines risk as only the risk of negative variation and provides a better image of risk-adjusted performance than the Sharpe ratio.
5. The SORTINO ratio is helpful for investors, analysts, and portfolio managers to assess the return on investment of a given level of bad risk. Since this ratio uses downward deviation as a measure of risk, it addresses using absolute risk or standard deviation as upward volatility is beneficial to investors.
6. The SORTINO ratio variation in the Sharpe ratio characterizes the adverse volatility from the total general volatility using the asset standard deviation of negative asset returns, which is called the downward deviation. The SORTINO ratio calculates the return on assets and subtracts the risk-free rate. Then, it divides that amount by the low deviation of the investment. This ratio is attributed to the scholar Frank SORENTO.
Ninth; The equation for the SORTINO model; The following equation describes the calculation of the SORTINO ratio (Vivek et al., 2017: 221):
SORTINO Ratio=Portfolio Return - Risk Free Rate.
The risk-free rate of return represents the value of the required return by the index of the capital asset pricing model. The standard deviation of the portfolio side represents the numerator of the SORTINO ratio, which is equal to Jensen's alpha. Portfolio return equals the weighted average return of the entire portfolio of investments. It is calculated as the sum of the product of investment weights and individual returns. The risk-free rate equals the yield on long-term government bonds. The standard deviation of the negative side is calculated as follows:
Step 1: Determining the reference point under which the return is terrible can be called the minimum acceptable return (MVR). It might be the average return, the risk-free rate, or 0.
Step 2: Finding a deviation for each return value from the minimum acceptable return. If the value is higher than the MVR, it is ignored. If the value is less than the MVR, it is squared.
Step 3: All the squared values in Step 2 are summarized.
Step 4: The values obtained in Step 3 are divided by n, the total number of observations.
Step 5: The square root of the value in Step 4 is taken.
Data and Methodology
The financial and statistical methods used in the analysis.
The Sharp Model
The Sharpe ratio is calculated according to the following equation;
Sharpe Ratio=(Return on Interest-Free Portfolio - Rate of Risk-Free Return)/ Standard Deviation of Portfolio Return.
The Sortino Model
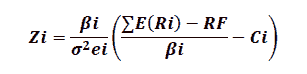
The Sortino ratio is calculated according to the following equation:
S=SORENTO Ratio Scale.
R=dividend yield.
T=Discount rate according to the capital asset pricing model.
DR=standard deviation of stock returns.
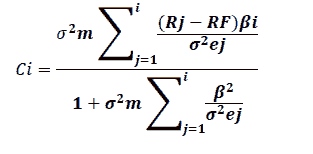
Cut-Rate
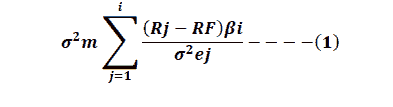
To calculate the investment weights of stocks that have achieved a positive SORTINO ratio, the cut ratio must be calculated as follows:
Calculation of the Relative Weight
It represents the correct numerical value of the weight of the security for each security in the portfolio, and it is calculated as follows:
The weight of Each Company
The weight of each company within the portfolio is calculated as follows:
The Earning Per Share
It is calculated as the difference between the current and previous share price as in the following equation:
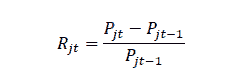
Rjt Actual yield, stock returns.
Pjt Closing price: j day t.
The following equation calculates the expected return on the security:

Capital Asset Pricing Model
It is calculated using the capital asset pricing model according to the following equation:
Ke=Rf+(Rm –Rf) Bj
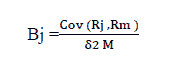
The beta coefficient (Bj) per share is calculated for each company according to the following equation:
The Research Population and Sample
The population of the present study consists of companies listed on the Iraq Stock Exchange. The banking sector was chosen because it is the most effective active sector in terms of the large volume of circulation and the number of shares traded compared to other industries during the period of study that extends between (2015-2019) according to the data published in the Iraq Stock Exchange Directory. In addition, its financial statements are available for the years covered by the present study (2015-2019). The research sample is selected according to the following conditions:
1. The bank must be listed in the market during the research period.
2. The bank should not have stopped trading shares during the research period.
The above conditions were applied to (8) banks from the banking sector (22) banks. Table (1) presents the banks that represented the research sample.
| Table 1 The Research Sample |
|||
|---|---|---|---|
| No | Banks | Year of establishment | Year of listing |
| 1 | Trade Bank of Iraq | 1992 | 2004 |
| 2 | Baghdad Bank | 1992 | 2004 |
| 3 | The Iraqi Islamic Bank for investment and development | 1992 | 2004 |
| 4 | The Middle East Iraqi Bank for investment | 1993 | 2004 |
| 5 | The Iraqi Investment Bank | 1993 | 2004 |
| 6 | The Iraqi Private Bank | 1995 | 2004 |
| 7 | The Iraqi Crediting Bank | 1998 | 2004 |
| 8 | Darulsalam Investment Bank | 1998 | 2004 |
Results
Analyzing the research model variables and testing the hypothesis First, analyzing the variables of Sharpe's model.
Analyzing Earnings Per Share
Table (2) shows the earnings per share from (2015-2019) for the research sample banks.
| Table 2 Analysis Of Earnings Per Share For The Research Sample Banks. |
||||||||
|---|---|---|---|---|---|---|---|---|
| No | Banks | 2015 | 2016 | 2017 | 2018 | 2019 | Medium | Standard deviation |
| 1 | Trade bank of Iraq | 0.040 | 0.032 | 0.048 | 0.048 | 0.115 | 0.057 | 0.033 |
| 2 | Baghdad Bank | 0.080 | 0.254 | 0.597 | 0.490 | 0.304 | 0.345 | 0.203 |
| 3 | The Iraqi Islamic Bank for investment and development | 0.040 | 0.0306 | 0.746 | 0.544 | 0.184 | 0.364 | 0.282 |
| 4 | The Iraqi Middle East Bank for investment | 1.120 | 0.192 | 0.512 | 0.496 | 0.296 | 0.523 | 0.360 |
| 5 | The Iraqi Investment Bank | 0.320 | 0.002 | 0.437 | 0.346 | 0.158 | 0.252 | 0.172 |
| 6 | The Iraqi Private Bank | 0.120 | 1.088 | 0.096 | 0.208 | 0.032 | 0.039 | 0.440 |
| 7 | The Iraqi Crediting Bank | 0.360 | 0.784 | 0.608 | 0.400 | 0.251 | 0.481 | 0.213 |
| 8 | Darulsalam Bank for Investment | 0.040 | 0.816 | 0.048 | 0.550 | 0.165 | 0.324 | 0.345 |
| Total | Medium | 0.265 | 0.434 | 0.386 | 0.385 | 0.188 | 0.332 | 0.102 |
The table 2 shows the earnings per share analysis results calculated by dividing the difference between the closing price for the first and the last period of the share by the closing price for the previous period. It appears that the average returns were (0.332) dinars and that it seemed to be optimistic because it reflects the continuous rise in share prices for most of the research sample banks. It is also evident from the table that the Iraqi Middle East Investment Bank achieved the highest rate of return on the share, with an average speed of (0.523). Yogesh (2019) This indicates the efficiency of the bank’s management in encouraging investors to acquire its shares in a manner that guarantees its growth and expansion in the future. On the other hand, the Trade Bank of Iraq achieved the lowest rate of return on the claim as it averaged (0.057), which indicates the bank’s inability to influence the prices of its shares. This impedes its future growth and thus makes its shares less attractive to investors and pushes the price down. It is noticed from the analysis of the standard deviation of the stocks of the research sample banks that the returns of the Iraqi Private Bank for Investment were the highest dispersion, and their standard deviation them was (0.440), which is high compared to the average of (0.102). On the other hand, the returns of the Trade Bank of Iraq were the most stable. The coefficient of standard deviation reached (0.033).
Beta Coefficient of Systemic Risk and Required Rate of Return
| Table 3 The Beta Coefficient And The Required Rate Of Return For The Shares Of The Research Sample Banks. |
|||
|---|---|---|---|
| No | Banks | BJ | The required return |
| 1 | Trade Bank of Iraq | 12.640 | 0.0912 |
| 2 | Baghdad Bank | 14.224 | 0.088 |
| 3 | The Iraqi Islamic Bank for Investment and Development | 21.440 | 0.0768 |
| 4 | The Iraqi Middle East Bank for Investment | 19.200 | 0.08 |
| 5 | The Iraqi Investment Bank | 12.768 | 0.0912 |
| 6 | The Iraqi Private Bank | 10.672 | 0.0944 |
| 7 | The Iraqi Crediting Bank | 15.360 | 0.0864 |
| 8 | Darussalam Bank for Investment | 7.536 | 0.0992 |
| Medium | 0.0884 | ||
It is evident from Table (3) that the Iraqi Islamic Bank achieved the highest beta coefficient of (21.44). This reflects the high degree of sensitivity to the return of the bank above’s share and the direction of the change in the market portfolio's return. As for Darulsalam Bank, it achieved the lowest beta coefficient of (7.536). This reflects a less sensitive degree to the return per share towards the market portfolio return. It is noted that the beta coefficient of all banks is more significant than one correct, as the shares of these banks are described as a risk to reflect the risk of more substantial investment in these shares. The market portfolio's return and the beta coefficient for each bank’s share were analyzed in the previous paragraphs. It is clear from the table that Darulsalam Bank achieved the highest required rate of return as it reached (9.92%), which is relatively high compared to the average of (8.84%) despite the low beta coefficient of the bank above’s share. The Iraqi Islamic Bank achieved the lowest required rate of return of (7.68%).
The Sharp Model
| Table 4 That The Average Required Rate Of Return According To The Sharp Model |
|||||
|---|---|---|---|---|---|
| No | Banks | Average return | Risk-free return | Standard deviation | Sharpe value |
| 1 | The Trade Bank Of Iraq | 0.057 | 0.060 | 0.033 | 0.101 |
| 2 | Baghdad Bank | 0.345 | 0.060 | 0.023 | 1.405 |
| 3 | The Iraqi Islamic Bank for Investment and Development | 0.0364 | 0.060 | 0.282 | 1.076 |
| 4 | The Iraqi Middle East Bank for Investment | 0.523 | 0.060 | 0.360 | 1.287 |
| 5 | The Iraqi Investment Bank | 0.252 | 0.060 | 0.172 | 1.116 |
| 6 | The Iraqi Private Bank | 0.309 | 0.060 | 0.440 | 0.565 |
| 7 | The Iraqi Crediting Bank | 0.481 | 0.060 | 0.213 | 1.972 |
| 8 | Darulsalam Bank for Investment | 0.324 | 0.060 | 0.345 | 0.765 |
| Medium | 0.332 | 0.060 | 0.256 | 1.011 | |
It is noted from Table (4) that the average required rate of return according to the sharp Model was (1.011) and that the highest value for it was achieved in the Iraqi Crediting Bank with (1.972). According to SHARP's model, the optimum value of an effective strategy or effective performance of an investment portfolio is (1) or more, and the higher the ratio, the better. If the result is less than (0), this strategy is not recommended, or the investment portfolio management is ineffective.
Analyzing the SORTINO model
In this section, the SORTINO ratio is analyzed according to the following equation: According to the (CAPM) model, the value of (T) has been extracted in the above SORTINO model. Table (5) shows the results of the SORTINO ratio for the research sample banks.
| Table 5 Analyzing The Sortino Model Variables. |
|||||
|---|---|---|---|---|---|
| No | Banks | Average return | Average required return | Standard deviation | SORENTO value |
| 1 | The Trade Bank of Iraq | 0.057 | 0.0912 | 0.033 | -1.035 |
| 2 | Baghdad Bank | 0.345 | 0.088 | 0.023 | 1.267 |
| 3 | The Iraqi Islamic Bank for Investment and Development | 0.364 | 0.0768 | 0.282 | 1.017 |
| 4 | The Iraqi Middle East Bank for Investment | 0.523 | 0.08 | 0.36 | 1.231 |
| 5 | The Iraqi Investment Bank | 0.252 | 0.0912 | 0.172 | 0.935 |
| 6 | The Iraqi Private Bank | 0.0309 | 0.0944 | 0.44 | 0.487 |
| 7 | The Iraqi Crediting Bank | 0.841 | 0.0864 | 0.213 | 1.848 |
| 8 | Darulsalam Bank for Investment | 0.324 | 0.099 | 0.345 | 0.652 |
| Medium | 0.332 | .088 | 0.256 | 0.800 | |
It is clear from the table (5) that the value of the SORTINO ratio of the research sample banks ranged between the highest positive value in the Iraqi crediting bank with (1.848) and its risk was (0.213). The lowest negative percentage was achieved in the Trade Bank of Iraq with (-1.035). It is the only negative value among the bank’s values, and its risk was (0.033).
After analyzing the SORTINO values, it was found that only one bank had a negative value, which is the Trade Bank of Iraq. So, it will be excluded. Therefore, the following table shows only the banks that achieved favorable rates of SORTINO for which the cutting rate will be calculated. as shows in Table 6.
| Table 6 Variables Of The Values Of The Sortino Model Of Positive Returns. |
|||||
|---|---|---|---|---|---|
| No | Banks | Average return | Average of required return | Standard deviation | SORENTO value |
| 1 | Baghdad Bank | 0.345 | 0.088 | 0.203 | 1.267 |
| 2 | The Iraqi Islamic Bank for Investment and Development | 0.364 | 0.0768 | 0.282 | 1.017 |
| 3 | The Iraqi Middle East Bank for Investment | 0.523 | 0.08 | 0.36 | 1.231 |
| 4 | The Iraqi Investment Bank | 0.252 | 0.0912 | 0.172 | 0.935 |
| 5 | The Iraqi Private Bank | 0.309 | 0.0944 | 0.44 | 0.487 |
| 6 | The Iraqi Crediting Bank | 0.481 | 0.0864 | 0.213 | 1.848 |
| 7 | Darulsalam Bank for Investment | 0.234 | 0.0992 | 0.345 | 0.652 |
| 0.379 | 0.088 | 0.288 | 1.062 | ||
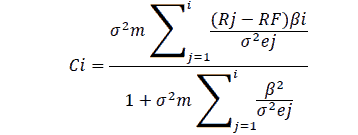
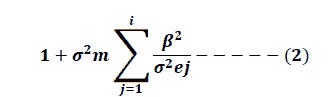
Calculation and analysis of the cut-off factor for the research sample banks. After analyzing the SORTINO ratio indicator in the previous paragraph, the cut-off rate for the banks that achieved a positive SORTINO ratio will be calculated. First, the cut-off rate is calculated according to the following equation: as shows in Table 7.
| Table 7 Shows The Cut-Off Rate Values ??For The Research Sample Banks According To The Positive Sortino Values |
|||||||||||
|---|---|---|---|---|---|---|---|---|---|---|---|
| No | Banks | Medium | Rf | Bj | (Rj-RF) | (1)eq | β^2 | (2)eq | Ci | ||
| 1 | Baghdad Bank | 0.102 | 0.345 | 0.06 | 14.224 | 4.054 | 0.203 | 2.037 | 202.332 | 11.166 | 0.182 |
| 2 | The Iraqi Islamic Bank for Investment and Development | 0.102 | 0.364 | 0.06 | 21.440 | 60518 | 0.282 | 2.357 | 459.674 | 17.626 | 0.134 |
| 3 | The Iraqi Middle East Bank for Investment | 0.102 | 0.523 | 0.06 | 19.200 | 8.890 | 0.360 | 2.519 | 368.640 | 11.445 | 0.220 |
| 4 | The Iraqi Investment Bank | 0.102 | 0.252 | 0.06 | 12.768 | 2.451 | 0.172 | 1.454 | 163.022 | 10.668 | 0.136 |
| 5 | The Iraqi Private Bank | 0.102 | 0.309 | 0.06 | 10.672 | 2.657 | 0.440 | 0.616 | 113.892 | 3.640 | 0.169 |
| 6 | The Iraqi Crediting Bank | 0.102 | 0.481 | 0.06 | 15.360 | 6.467 | 0.213 | 3.097 | 235.930 | 12.298 | 0.252 |
| 7 | Darulsalam Bank for Investment | 0.102 | 0.324 | 0.06 | 7.536 | 1.990 | 0.345 | 0.588 | 56.791 | 2.679 | 0.220 |
It is clear from Table (7) that the highest cut-off rate for banks that achieved positive SORTINO values were committed in the Iraqi Crediting Bank with (0.252). On the other hand, the lowest value of the cut-off rate was at the Iraqi Islamic Bank for Investment and Development (0.134).
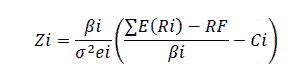
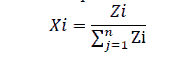
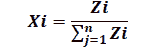
After calculating the cut-rate, the relative weight (Zi) will be calculated to find the investment weight of the shares Xi. Analyzing the values of relative weight (Zi) and investment weight (Xi).
In this paragraph, the relative weight Zi and the investment weight of shares Xi will be calculated, depending on the SORTINO values calculated in the previous section according to the following equations:
The weight of each company.
The weight of each company within the portfolio is calculated as follows:
as shows in Table 8.
| Table 8 The Results Of Calculating The Relative Weight Zi And The Investment Weight Of Shares Xi With Their Returns And Risks |
||||||||||||
|---|---|---|---|---|---|---|---|---|---|---|---|---|
| No | Banks | Medium | Rf | Bj | Zi | Xi | ||||||
| 1 | Baghdad Bank | 0.102 | 0.345 | 0.06 | 14.224 | 4.054 | 0.203 | 70.069 | 0.02 | 0.202 | 14.156 | 0.177 |
| 2 | The Iraqi Islamic Bank for Investment and Development | 0.102 | 0.364 | 0.06 | 21.44 | 6.518 | 0.282 | 76.028 | 0.0142 | 0.148 | 11.266 | 0.141 |
| 3 | The Iraqi Middle East Bank for Investment | 0.102 | 0.523 | 0.06 | 19.2 | 8.89 | 0.36 | 53.333 | 0.0241 | 0.244 | 13.019 | 0.163 |
| 4 | The Iraqi Investment Bank | 0.102 | 0.252 | 0.06 | 12.768 | 2.451 | 0.172 | 74.233 | 0.015 | 0.151 | 11.212 | 0.14 |
| 5 | The Iraqi Private Bank | 0.102 | 0.309 | 0.06 | 10.672 | 2.657 | 0.44 | 24.255 | 0.0233 | 0.192 | 4.665 | 0.058 |
| 6 | The Iraqi Crediting Bank | 0.102 | 0.481 | 0.06 | 15.36 | 6.467 | 0.213 | 72.113 | 0.0274 | 0.279 | 20.149 | 0.252 |
| 7 | Darulsalam Bank for Investment | 0.102 | 0.324 | 0.06 | 7.536 | 1.99 | 0.345 | 21.843 | 0.035 | 0.255 | 5.571 | 0.07 |
Table (8) shows that the highest relative weight value was achieved in the Iraqi Crediting Bank with (20.149) with an investment weight of (0.252), which is the highest investment weight among the banks as well. It is also noted that this bank achieved the highest rate of return on shares during the research period with (0.481). As for the lowest relative weight, it was completed in Darulsalam Bank with (5.571). As for the investment weight of this bank, it reached (0.07), which is the lowest investment weight for stocks among the research sample banks.
The Sharp Portfolio Return and Risk
| Table 9 The Results Of Calculating The Relative Weight Zi And The Investment Weight Of Shares Xi With Their Returns And Risks. |
||||||||
|---|---|---|---|---|---|---|---|---|
| No | Banks | Average return | Standard deviation | SHARPE value | Zi | Xi | Ri=Sharp*Xi | Sdi= |
| 1 | The Trade Bank of Iraq | 0.057 | 0.033 | 0.10059 | 0.857 | 0.011 | 0.0011 | 0.0004 |
| 2 | Baghdad Bank | 0.345 | 0.203 | 1.4059 | 14.156 | 0.175 | 0.2460 | 0.0355 |
| 3 | The Iraqi Islamic Bank for Investment and Development | 0.364 | 0.282 | 1.076248 | 11.266 | 0.139 | 0.1496 | 0.0392 |
| 4 | The Iraqi Middle East Bank for Investment | 0.523 | 0.360 | 1.2673 | 13.019 | 0.161 | 0.2072 | 0.0580 |
| 5 | The Iraqi Investment Bank | 0.252 | 0.172 | 1.115962 | 11.212 | 0.139 | 0.1551 | 0.0239 |
| 6 | The Iraqi Private Bank | 0.309 | 0.440 | 0.565286 | 4.665 | 0.058 | 0.0328 | 0.0255 |
| 7 | The Iraqi Crediting Bank | 0.481 | 0.213 | 1.972276 | 20.149 | 0.249 | 0.4911 | 0.0530 |
| Darulsalam Bank for Investment | 0.324 | 0.345 | 0.765238 | 5.571 | 0.069 | 0.0528 | 0.0238 | |
| 0.332 | 0.102 | 2.671594 | 0.857 | 0.011 | 0.0294 | 0.0011 | 1.3628 | |
It is clear from Table (9) that the return of the shares portfolio formed according to Sharp's model was (1.3628) and that the highest return within the portfolio was for the Iraqi Crediting Bank with (0.4911). The lowest value within the portfolio was in the Trade Bank of Iraq, which was negative (-0.0011). As for the portfolio risk, it was (0.2604). The highest risk was achieved in the Iraqi Islamic Bank for Investment and Development with (0.058) with a relative weight of (13.019) and an investment weight for shares of (0.161).
The SORTINO
Portfolio Risk-Return
| Table 10 Analyzing The Sortino Portfolio Risk And Return. |
||||||||
|---|---|---|---|---|---|---|---|---|
| No | Banks | Average return | Xi | SORTINO values | Rs=S*Xi | SD= | ||
| 1 | Baghdad Bank | 0.345 | 0.203 | 14.156 | 0.177 | 1.267 | 0.224 | 0.036 |
| 2 | The Iraqi Islamic Bank for Investment and Development | 0.364 | 0.282 | 11.266 | 0.141 | 1.017 | 0.143 | 0.040 |
| 3 | The Iraqi Middle East Bank for Investment | 0.523 | 0.360 | 13.019 | 0.163 | 1.231 | 0.201 | 0.059 |
| 4 | The Iraqi Investment Bank | 0.252 | 0.172 | 11.212 | 0.140 | 0.935 | 0.131 | 0.024 |
| 5 | The Iraqi Private Bank | 0.309 | 0.440 | 4.665 | 0.058 | 0.487 | 0.028 | 0.026 |
| 6 | The Iraqi Crediting Bank | 0.481 | 0.213 | 20.149 | 0.252 | 1.848 | 0.466 | 0.054 |
| 7 | Darulsalam Bank for Investment | 0.324 | 0.345 | 5.571 | 0.070 | 0.652 | 0.046 | 0.024 |
It is clear from Table (10) that the return of the shares portfolio formed according to the SORTINO model was (1,239) and that the highest return within the portfolio was for the Iraqi Crediting Bank with (0.466), with a value of SORTINO for the bank’s shares amounting to (1.848) and relative weight of (20.149). The lowest value was within the portfolio In the Iraqi Private Bank with (0.028). The risk of the portfolio was (0.262). The highest risk was achieved in the Iraqi Middle East Bank for Investment with (0.059) with a relative weight of (13.019) and an investment weight for shares of (0.163). It is noted that the portfolio of shares formed according to Sharp is better than the portfolio developed under the SORTINO Model according to the following facts:
| Table 11 Comparison Between The Risk-Return Of Sharp And Sortino Portfolios |
||
|---|---|---|
| Portfolio | Return | Risk |
| Sharpe | 1.3628 | 0.2604 |
| Sortino | 1.239 | 0.262 |
It is noted from Table (11) that the return of Sharp’s portfolio is higher than the return of the SORTINO portfolio with (1.3628) compared to the return of the SORTINO portfolio of (1.239). Thus, from the convergence of risk in the two portfolios, the return of Sharp’s portfolio is higher, and so Sharp’s portfolio is better.
Conclusions and Discussion
Sharp's model measures the return of the portfolio better than the SORTINO model. The stocks with positive returns could not form a higher-yielding portfolio. The high risk of bank shares, represented by the rise in the stock beta, reflects the high sensitivity of the return of bank shares towards the change in the market portfolio's return. The shares of these banks are described as a risk, reflecting the greater risk of investment in these shares. The market return reflected the continuous rise in stock prices for most banks of the research sample as it was positive. This indicates the efficiency of banks ’management in encouraging investors to acquire their shares in a manner that guarantees their growth and expansion in the future. There is a risk variation in the banking stocks, which was reflected in the standard deviation analysis.
Investors in the Iraq Stock Exchange should adopt modern models informing investment portfolios, especially the sharp model because of its role in building a portfolio with less risk and higher return. There is a necessity of applying the SORTINO model in forming portfolios for companies ’shares in sectors other than the banking sector. Perhaps, it gives better results in terms of a higher return on the portfolio and lower risk. Investing in stocks with low returns should be avoided as it will affect the return and risk of the portfolio that will disrupt it. There is a necessity of following up the performance of stocks by financial analysts and brokers to maintain the permanence of the performance of the market as a whole and the investment portfolios in particular.
References
Al-Fatlawi, Q.A., Al Farttoosi, D.S., & Almagtome, A.H. ( 2021) Accounting information security and IT governance under COBIT 5 Framework: A Case Study.
Ali, M.N., Almagtome, A.H.., & Hameedi, K.S. (2019). "Impact of accounting earnings quality on the going-concern in the Iraqi tourism firms." African Journal of Hospitality, Tourism and Leisure,8(5, 1-12.
Almagtome, A., Khaghaany, M., & Önce, S. (2020). Corporate governance quality, stakeholders’ pressure, and sustainable development: An integrated approach." International Journal of Mathematical, Engineering and Management Sciences,5(6), 1077-1090.
Almagtome, A.H., Al-Yasiri, A.J., Ali, R.S., Kadhim, H.L., & Bekheet, H.N. (2020). Circular economy initiatives through energy accounting and sustainable energy performance under integrated reporting framework. International Journal of Mathematical, Engineering and Management Sciences,5(6), 1032-1045.
Al-Wattar, Y.M.A., Almagtome, A.H., & AL-Shafeay, K.M. (2019). The role of integrating hotel sustainability reporting practices into an accounting information system to enhance hotel financial performance: Evidence from Iraq. African Journal of Hospitality, Tourism and Leisure,8(5), 1-16,
Amagtome, A.H., & Alnajjar, F.A. (2020). Integration of financial reporting system and financial sustainability of nonprofit organizations: Evidence from Iraq. International Journal of Business & Management Science, 10(1).
Anjom, W. (2020). A quantitative approach to evaluate the financial performance of growth oriented bangladeshi close-end mutual funds: An empirical study. Global Journal of Management and Business Research.
Bekhet, H.A., & Matar, A. (2012). Risk-adjusted performance: A two-model approach application in Amman stock exchange. International Journal of Business and Social Science,3(7).
Driessen, E., Van Tartwijk, J., Van Der Vleuten, C., & Wass, V. ( 2007). "Portfolios in medical education: Why do they meet with mixed success? A systematic review," Medical education, 41(12), 1224-1233.
Fama, E.F. (1972) "Components of investment performance." The Journal of finance, 27(3), 551-567,
Fisk, R.P., Patrício, L., Ordanini, A., Miceli, L., Pizzetti, M., & Parasuraman, A. (2011). Crowd-funding: Transforming customers into investors through innovative service platforms. Journal of service management.
Hameedi, K.S., Al-Fatlawi, Q.A., Ali, M.N., & Almagtome, A.H. (2021). Financial performance reporting, IFRS implementation, and accounting information: Evidence from Iraqi banking sector. The Journal of Asian Finance, Economics and Business,8(3), 1083-1094.
Hole, Y. (2019). Journal of physics Conference series.
Jensen, M.C. (1968). "The performance of mutual funds in the period 1945-1964." The Journal of finance, 23(2), 389-416.
Khaghaany, M., Kbelah, S., & Almagtome, A. (2019). Value relevance of sustainability reporting under an accounting information system: Evidence from the tourism industry. African Journal of Hospitality, Tourism and Leisure, 8, 1-12.
Kimani, M.P., & Aduda, D.J. (2016).The effect of portfolio size on the financial performance of portfolios of investment firms in Kenya. International Journal of Finance and Accounting,1(2), 77-94.
Mahdavi, M. (2004). Risk-adjusted return when returns are not normally distributed: Adjusted sharpe ratio. The Journal of Alternative Investments,6(4), 47-57.
Markowitz, H. (1952). The utility of wealth. Journal of political Economy,60(2), 151-158.
Misner, C.W., & Sharp, D.H. (1964). Relativistic equations for adiabatic, spherically symmetric gravitational collapse. Physical Review, 136(2B), B571.
Mustafakulov, S., & Khudoykulov, K. (2015). "Verifying capital asset pricing model in Greek capital market. "Central European Review of Economics & Finance,7(1), 5-15.
Sharpe, W.F. (1963). A simplified model for portfolio analysis. Management science. 9(2), 277-293, 1963.
Sharpe, W.F. (1965). "The sharpe ratio." Journal of portfolio management, 21(1), 49-58, 1994.
Srivastava, P., & Mazhar, S.S. (2018). Comparative analysis of sharpe and sortino ratio with reference to top ten banking and finance sector mutual funds. International Journal of Management Studies,93(10).
Toppari, J. (1996). "Male reproductive health and environmental xenoestrogens." Environmental health perspectives, 104(4), 741-803.
Treynor, J. (n.d). "How to rate management of investment funds.
Widyawati, L. (2020). "A systematic literature review of socially responsible investment and environmental social governance metrics." Business Strategy and the Environment, 29(2), 619-637.
Received: 14-Nov-2021, Manuscript No. asmj-21-9230; Editor assigned: 16-Nov-2021, PreQC No. asmj-21-9230 (PQ); Reviewed: 07- Dec-2021, QC No. asmj-21-9230; Revised: 27-Dec-2022, Manuscript No. asmj-21-9230 (R); Published: 03-Jan-2022