Research Article: 2021 Vol: 20 Issue: 2
Futuristic Trends and Innovations for Examining the Performance of the Course Learning Outcomes using Rasch Analytical Model
Moustafa M. Nasralla, Prince Sultan University
Basiem Al-Shattart, Prince Sultan University
Dhafer J. Almakhles, Prince Sultan University
Abdelhakim Abdelhadi, Prince Sultan University
Eman Sabry, Prince Sultan University
Iván García-Magariño, Complutense University of Madrid
Abstract
The literature on engineering education research highlights the relevance of evaluating course learning outcomes (CLOs). However, generic and reliable mechanisms for evaluating CLOs remain as challenges. The purpose of this project is to accurately evaluate the efficacy of the learning and teaching techniques through analyzing CLOs performance by using an advanced analytical model (i.e., Rasch model) in the context of engineering and business education. An association pattern between the students and the overall achieved CLO performance will be produced by this model. The sample in this project will be conducted on students who are enrolled in some nominated engineering and business courses over one academic year at Prince Sultan University, Saudi Arabia. This sample will consider several types of assessments, such as direct assessments (e.g., quizzes, assignments, projects, and examination) and indirect assessments (e.g., surveys). The current research illustrates that the Rasch Model for measurement is able to categorize grades in accordance with course expectations and standards in a more accurate manner, thus differentiating students by their extent of educational knowledge. The results from this project will guide the educator to track and monitor the CLOs’ performance, which is identified in every course to estimate the students’ knowledge, skills, and competence levels, which will be collected from the predefined sample by the end of each semester. The proposed approach with the Rasch measurement model can adequately assess the learning outcomes.
Keywords
Education and Learning, Data Analytics, Bloom Taxonomy, Assessment, Course Learning Outcomes, Student Performance.
Introduction
Learning outcomes can be defined as statements that describe what students can do or to perform at the end of a learning process. Probably, they have to be differentiated from learning goals. Outcomes of learning are directly associated with students to ensure understandable directions of what they have to accomplish throughout a course/program. In turn, learning goals are made rather for teachers in relation to program management and implementation (Bai et al., 2013). Bloom, who was a pundit in education, classified learning outcomes by three core dimensions of study: cognitive (based on knowledge), emotional (based on attitude), as well as psychomotor (based on human skills) (Bloom, 1956). Nevertheless, the Arabian sector of higher education has also classified learning outcomes by three relevant dimensions (knowledge, competence, and skills), referring to the so-called Saudi Qualification Framework (SAQF). The domains of knowledge and skills are relatively clear and easy to understand, whereas competence represents a more complex category and needs further interpretation.
The application of teacher assessment techniques has got a lot of attention in terms of policymaking. The studies revealed that 15-25% of the discrepancy in student accomplishments and grades is rather attributed to teachers’ work and contribution. Eventually, a variety of research-related classroom monitoring tools have been designed since then (Aaronson et al., 2007 and van de Grift et al., 2014). Today, teacher assessments fulfill three basic functions. They are not limited by policies anymore, yet functions remain to be of formative and summarizing nature. Summarizing teacher assessment maintains decisions on teacher’s choices as well as solutions related to career development. Nonetheless, it is quite neglected that valid summarizing decisions should be assessed based on more than ten independent evaluations made by diverse experts (van der Lans et al., 2016). The formative assessment also demands different monitoring reviews from experts to constitute a valid decision. In the context of teaching, this issue is typically managed by a brief communication with a teacher under observation, with asking something like: “Was the class indicative enough?” or “Have you had the chance to demonstrate all professional skills?” If answers are mostly negative, a second monitoring assessment is conducted.
Nowadays, the techniques of measuring learning outcomes and course performance basically include the delivery of questionnaires to students in the last week of the educational semester (as per Prince Sultan University policy). This questionnaire lists the course learning outcomes (CLOs) that the students have to utilize to assess their knowledge over the predefined CLOs. Thus, it remains to be problematic a bit to understand the relevant and exact performance for every selected CLO. Still, this process was found unfit for evaluating the student CLO performances as it was mainly grounded on the students’ subjective feelings and opinions (Bradley et al., 2010; Farhan et al., 2018).
This study aligns with the Kingdom of Saudi Arabia (KSA) National Transfer Program (NTP) 2020; the third PSU Strategic Plan ((2018-2023); and KSA Vision 2030. Theme 2 of NTP 2020 is titled as “Improve Living Standards and Safety” which aimed to extend the delivery of top-quality education services by getting appropriate accreditation, improving education services, and simplifying admission practices in international high-education institutions. Also, the objectives of the NTP that is related to education are: “Improving the learning environment to stimulate creativity and innovation; improving curricula and teaching methods, and Improving students’ values and core skills”. However, the usual procedure to examine the performances for the CLOs is conducted by distributing survey questions either manually or via online to the students (Chae et al., 2016). Unfortunately, following this approach does not accurately interpret the students’ performances through actual evaluation. In addition, in our departments, we lack accuracy in assessing every CLO because weights distributions on the offered activities in the direct assessments are performed heterogeneously regarding each teacher’s criteria.
This study contributes to the literature by providing evidence through using the advanced analytical model, which helps in accurately and statistically assessing the efficacy of the learning and teaching techniques when using both direct and indirect assessment methods. The Rasch Model is known as a measurement technique that utilizes inputs from the students’ evaluations and converses this data into the scale titled as “logit”, thus modifying the evaluation results into a linear interrelation with the equivalent interval (Rozeha et al., 2007). The outcomes are then assessed to find if the evaluation has been made clear. Further, they will be utilized by the professor as certain guidance for streamlining the teaching approaches (Rozeha et al., 2007). The outcomes derived from the Rasch evaluation will supply the professors and teachers with valid information on the students’ learning skills and achievement potential. Technically, the Rasch model concentrates on developing the measurement tool with precision instead of adjusting the inputs to a measurement process, yet with some errors (Aziz et al., 2008). Nevertheless, the current research illustrates that the Rasch measurement technique is able to categorize grades in compliance with course goals in a more accurate manner, thus differentiating the students by their level of knowledge. In a way, the Rasch outcomes will be utilized as a directive for lecturers and professors to observe students’ performance in every particular CLO with the purpose of measuring the extent of efficiency of completing teaching and learning goals in any course program (Abdullah et al., 2009).
Data and Sample
This study was conducted to a sample of 31 students of the first semester of the academic year 2019-2020 from both the Department of Communications and Networks Engineering and the College of Business and Administrative (CBA), Faculty of Accounting at Prince Sultan University, KSA (PSU).
Measuring CLO using Rasch Model
In this research, the specific Rasch Model known as Person-Item Distribution Map(PIDM) is used to ensure significant data on the students’ learning performance, evaluating outcomes on what knowledge a student has and what his/her place is in the instructional order. The model’s capacity to produce data based on a minor sample is a great opportunity for adequate observation over the students’ learning progress in the engineering and accounting fields, especially when the instructional plan is in progress. Significantly, PIDM illustrates the whole scale of learning barriers, clearly outlining the certain challenges that students from engineering and accounting fields experience to have further education progress.
The Rasch measurement model is known as one characteristic, logistic, and non-dynamic design in terms of a single item response theory (IRT) in which the quantity of a selected latent personal characteristic and the quantity of another similar latent characteristic are expressed in different items, which is why it might be calculated separately; however, they can be still compared and contrasted between each other (Rasch, 1993 & 1961; Bradley et al., 2010). Scores can be used in parametric statistics and for validity testing (Wright & Mok, 2000; Bond & Fox, 2015; Kalinowski et al., 2016). Rasch model and the Many-facet Rasch model approach has been used in a steadily increasing number of applications in the fields of language testing, educational and psychological measurement (Bonk & Ockey, 2003; Semerci, 2011; Chang et al., 2016; Cetin & Ilhan, 2017; Kaya-Uyanik et al., 2019).
By using the Rasch Model for measurement, each individual with a specific amount of selected latent characteristics clarifies the chance to reply appropriately in one of the item’s domains. The model hence provides an exceptional and full-fledged Learning Performance Measurement System (LPMS) for CLO evaluation, which is able to improve the understanding of how the education programs are aligned, moreover helping teachers to design and support high-quality education standards in Prince Sultan University (Saudi Arabia) with meeting the country’s national needs-particularly in engineering and accounting educational fields, as mentioned in our case (Talib et al., 2018; Van de Grift et al., 2019). In the dichotomous context, the Rasch Model is shown as follows in the psychological metrics system:
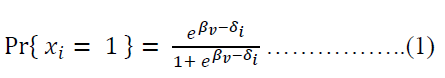
Where,
Pr{ xi=0,1} is the probability of turn of the event upon the interaction between the relevant person and assessment item;
e = Euler’s number, (i.e., 2.71828)
βv = The ability of person v
δi = the difficulty of assessment item i
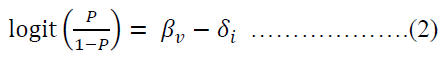
In this scenario, the chance of success might be modified and re-recorded within logit, representing the so-called Logistic Regression Linear Hierarchical Model. It has been depicted that the log-odds, known as logit of appropriate reply to an item by an individual, refer to the model, is modified as:
Thus, the chance of achieving a specific CLO might be considered, as demonstrated in Figure 1.

Figure 1 CLO Success Model
The Rasch Model transforms sequential grading scale or rather partial-credit information into the typical interval-based scale. The eventual Rasch-converted output is placed in “logits”, a unit that incorporates data on every item’s complexity (titled “item complexity”) and the individual’s capacity (titled “personability”). Individual capacities are produced by a calculated maximum probability ratio of item complexities. Numbers related to items and individuals can be closely contrasted with each other to produce deductions on item’s complexity for every person. When the individual’s capacity and item complexity overlap, there is a 50% likelihood for an individual to reply in a correct way (Bond & Fox, 2015).
Empirical Model
The study comprises three stages, namely planning, categorization, and evaluation. The planning stage represents the identification of the domain by assessing each questionnaire list. The test description based on CLO has been prepared. The informational categorizations grounded on the summation of students’ evaluation outcomes for every CLO have been established. Afterward, inputs were converted into the databases, including ratings of grades in the form of mark clusters. The inputs converted will be further used as data for the WinSteps application. Eventually, the outcomes were evaluated through several periods.
During the planning stage, the definition of the research focus and dimension was the starting point. Such modules as CME322 Network Design and Analysis (in terms of engineering) and ACC102 Introduction to Managerial Accounting (in terms of accounting) have been selected for the studying dimension. The CLOs for each module has been thoroughly investigated. Shortly, the course aims at teaching students about the methods of developing expert systems with the help of the life cycle program related to expert system development. The design of the CLO for a particular course is made in compliance with Bloom’s classification, as depicted in Table 1 (Panels A and B). This classification incorporates cognitive learning stages, such as knowledge, understanding, applying, evaluating, estimating, and synthesizing. They are used in relation to CLOs in constructing the course. In a given course, several estimation techniques have been utilized to verify a student’s comprehension of instruction-centered knowledge. The evaluation is based on 10% of quizzes, 10% of special tasks, 40% of two mid-term exams, and 40% of the final exam.
| Table 1 Design of the CLO | ||
| Panel A CLO for CME322 Network Design and Analysis |
||
| Course Learning Outcome (CLO) | Bloom taxonomy | |
| CLO1 | Describe network technologies such as Ethernet, Virtual local area networks, wireless local area networks, mobility management principles, and mobile Internet Protocol. |
Knowledge |
| CLO2 | Describe routing principles and illustrate routing algorithms such as link-state and distance-vector. | Knowledge |
| CLO3 | Explain different type of delay, loss, and throughput, and recognize different type of network switching mechanisms such as packet- and circuit-switching. | Skills |
| CLO4 | Explain transport layer connection/connectionless services, Transport Control Protocol (TCP) reliable data transfer, TCP flow-control and TCP congestion-control mechanisms. | Skills |
| CLO5 | Explain and compare error detection and correction schemes, channel access mechanisms and, data center design and operation. | Skills |
| Panel B CLO for ACC102 Introduction to Managerial Accounting |
||
| CLO1 | Describe the basic management accounting concepts and techniques. | Knowledge |
| CLO2 | Determine the cost of a manufactured product using job order and process costing systems. | Knowledge |
| CLO3 | Explain the purposes of budgeting and prepare the master budget components and relate the budget to planning and control. | Skills |
| CLO4 | Apply break-even techniques in CVP analysis. | Skills |
| CLO5 | Apply and justify relevant techniques to aid internal users in decision making. | Competence |
| CLO6 | Demonstrate oral and written communication skills in evaluating different approaches to management accounting. | Competence |
In the classification phase, we focus on the pre-processing on the total number of eleven students for CME322 and twenty-four students for ACC102, who enrolled for this course in the first semester of the academic year 2019-2020 at Prince Sultan University. Several practices on this stage involved:
1. Quizzes/questionnaires, tasks, mid-term exams as well as final exams that are prepared to test the CLO l for every particular question
2. Marks of students for each assessment domain were gathered in compliance with CLO; and
3. Marks of students have been assigned to each related grade. The grades achieved will be used as data for the Winstep application.
Based on the Rasch Model for measurement, the evaluation of the students’ accomplishments in education may be clearly defined. Moreover, the progress of students’ development of cognitive abilities might also be assessed by investigating the extent of complexities. The measurement of CLO accomplishments for this methodology is presented in the following equation (2).
Estimating every CLO is one of the steps to validate the accomplishments in CME322 and ACC102 courses. The procedure is demonstrated in the graph (Figure 2).

Figure 2 The Stages of CLOS Measurements
Eleven students who enrolled in CME322 entitled Network Design and Analysis during the first semester of the academic year 2019/2020 and twenty students who enrolled in ACC102 entitled Introduction to Managerial Accounting were chosen as the samples in the study. All the lists of questions utilized in assessment forms have been checked and categorized based on CLO standards. With reference to the categorization system, the share of allocation of every question based on CLO was synthesized (Table 2).
| Table 2 Allocation of Every Question Based on CLO | ||||||
| Panel A | ||||||
| Percentage distribution according to CLO for CME322 Network Design and Analysis | ||||||
| Evaluation | Quiz (10%) | Mid-term 1 (20%) | Mid-term 2 (20%) | Assignment (10%) | Final Exam (40%) | Total (100%) |
| CLO1 | 0.35 | 0.8 | 0 | 0 | 0.125 | 0.245 |
| CLO2 | 0.35 | 0.2 | 0 | 0 | 0.175 | 0.145 |
| CLO3 | 0.3 | 0 | 0.55 | 0 | 0.2 | 0.22 |
| CLO4 | 0 | 0 | 0.45 | 0 | 0.25 | 0.19 |
| CLO5 | 0 | 0 | 0 | 1 | 0.25 | 0.2 |
| Check | 1 | 1 | 1 | 1 | 1 | 1 |
| Panel B Percentage distribution according to CLO for ACC102 Introduction to Managerial Accounting |
||||||
| CLO1 | 0.2 | 0 | 0 | 0 | 0.1 | 0.06 |
| CLO2 | 0.5 | 0.35 | 0 | 0 | 0.2 | 0.2 |
| CLO3 | 0.15 | 0.65 | 0 | 0 | 0.2 | 0.225 |
| CLO4 | 0.15 | 0 | 1 | 0 | 0.25 | 0.315 |
| CLO5 | 0 | 0 | 0 | 0 | 0.25 | 0.1 |
| CLO6 | 0 | 0 | 0 | 1 | 0 | 0.1 |
| Check | 1 | 1 | 1 | 1 | 1 | 1 |
The shares of marks’ allocation were calculated based on CLO. Every assessment mark for a particular CLO was synthesized and divided by the summary of total values for particular CLO. Table 3 illustrates the allocation of marks among students based on CLO.
| Table 3 Allocation of Marks Among Students Based on CLO | |||||||
| Panel A Marks distribution according to CLO for CME322 |
|||||||
| Student | CLO1 | CLO2 | CLO3 | CLO4 | CLO4 | CLO5 | |
| S1 | 67 | 83 | 54 | 56 | 86 | 67 | |
| S2 | 80 | 80 | 73 | 93 | 72 | 80 | |
| S3 | 92 | 79 | 85 | 91 | 79 | 92 | |
| S4 | 75 | 87 | 87 | 82 | 75 | 75 | |
| S5 | 75 | 85 | 84 | 77 | 90 | 75 | |
| S6 | 96 | 95 | 79 | 78 | 54 | 96 | |
| S7 | 71 | 77 | 79 | 91 | 90 | 71 | |
| S8 | 84 | 96 | 82 | 83 | 93 | 84 | |
| S9 | 78 | 89 | 82 | 70 | 85 | 78 | |
| S10 | 90 | 85 | 80 | 75 | 65 | 90 | |
| S11 | 77 | 73 | 75 | 88 | 86 | 77 | |
| Panel B Marks distribution according to CLO for ACC102 |
|||||||
| S1 | 52 | 59 | 72 | 78 | 72 | 59 | 52 |
| S2 | 56 | 63 | 77 | 84 | 77 | 63 | 56 |
| S3 | 57 | 64 | 78 | 85 | 78 | 64 | 57 |
| S4 | 52 | 59 | 72 | 78 | 72 | 59 | 52 |
| S5 | 49 | 55 | 67 | 73 | 67 | 55 | 49 |
| S6 | 61 | 68 | 84 | 91 | 84 | 68 | 61 |
| S7 | 54 | 60 | 74 | 80 | 74 | 60 | 54 |
| S8 | 36 | 41 | 50 | 54 | 50 | 41 | 36 |
| S9 | 74 | 83 | 92 | 92 | 92 | 83 | 74 |
| S10 | 50 | 56 | 68 | 74 | 68 | 56 | 50 |
| S11 | 53 | 59 | 73 | 79 | 73 | 59 | 53 |
| S12 | 64 | 72 | 88 | 96 | 88 | 72 | 64 |
| S13 | 76 | 86 | 95 | 95 | 95 | 86 | 76 |
| S14 | 72 | 81 | 99 | 90 | 99 | 81 | 72 |
| S15 | 64 | 72 | 88 | 96 | 88 | 72 | 64 |
| S16 | 61 | 68 | 84 | 91 | 84 | 68 | 61 |
| S17 | 60 | 68 | 83 | 90 | 83 | 68 | 60 |
| S18 | 58 | 65 | 79 | 86 | 79 | 65 | 58 |
| S19 | 68 | 77 | 94 | 85 | 94 | 77 | 68 |
| S20 | 72 | 81 | 90 | 90 | 90 | 81 | 72 |
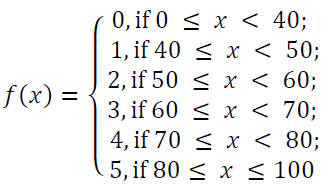
Marks for each CLO were then assigned according to grade based on the category below (as shown in Figure 3).

Figure 3 Grade Rating Based on Marks Cluster
The mapping of the selected CLO marks in the grade classification was ensured prior to their processing in the Winstep application. The output of the mapping procedure is documented in Table 4.
| Table 4 CLO Marks in the Grade Classification | ||||||
| Panel A | ||||||
| Mapping result for CLO rate according to the grade of CME322 | ||||||
| Student | CLO1 | CLO2 | CLO3 | CLO4 | CLO5 | |
| S1 | 3 | 5 | 2 | 2 | 5 | |
| S2 | 5 | 5 | 4 | 5 | 4 | |
| S3 | 5 | 4 | 5 | 5 | 4 | |
| S4 | 4 | 5 | 5 | 5 | 4 | |
| S5 | 4 | 5 | 5 | 4 | 5 | |
| S6 | 5 | 5 | 4 | 4 | 2 | |
| S7 | 4 | 4 | 4 | 5 | 5 | |
| S8 | 5 | 5 | 5 | 5 | 5 | |
| S9 | 4 | 5 | 5 | 4 | 5 | |
| S10 | 5 | 5 | 5 | 4 | 3 | |
| S11 | 4 | 4 | 4 | 5 | 5 | |
| Panel B | ||||||
| Mapping result for CLO rate according to the grade of ACC102 | ||||||
| Student | CLO1 | CLO2 | CLO3 | CLO4 | CLO5 | CLO6 |
| S1 | 2 | 2 | 4 | 4 | 4 | 2 |
| S2 | 2 | 3 | 4 | 5 | 4 | 3 |
| S3 | 2 | 3 | 4 | 5 | 4 | 3 |
| S4 | 2 | 2 | 4 | 4 | 4 | 2 |
| S5 | 1 | 2 | 3 | 4 | 3 | 2 |
| S6 | 3 | 3 | 5 | 5 | 5 | 3 |
| S7 | 2 | 3 | 4 | 5 | 4 | 3 |
| S8 | 0 | 1 | 2 | 2 | 2 | 1 |
| S9 | 4 | 5 | 5 | 5 | 5 | 5 |
| S10 | 2 | 2 | 3 | 4 | 3 | 2 |
| S11 | 2 | 2 | 4 | 4 | 4 | 2 |
| S12 | 3 | 4 | 5 | 5 | 5 | 4 |
| S13 | 4 | 5 | 5 | 5 | 5 | 5 |
| S14 | 4 | 5 | 5 | 5 | 5 | 5 |
| S15 | 3 | 4 | 5 | 5 | 5 | 4 |
| S16 | 3 | 3 | 5 | 5 | 5 | 3 |
| S17 | 3 | 3 | 5 | 5 | 5 | 3 |
| S18 | 2 | 3 | 4 | 5 | 4 | 3 |
| S19 | 3 | 4 | 5 | 5 | 5 | 4 |
| S20 | 4 | 5 | 5 | 5 | 5 | 5 |
In this group of the grade ACC102, we calculated Pearson’s, Kendall’s Tau, and Spearman’s Rho correlation coefficients, as this group has a more representative number of students. For this test, we used the original grades from 0 to 100, as these marks have more information. The results of the three correlation tests were similar and coherent among each other. Figure 4 shows the results of the Pearson’s correlation test.

Figure 4 Histograms of Probabilities Obtained with the Proposed Approach for the Six CLOs Used in Acc102
One can observe that these CLOs marks strongly correlated with significance levels in all the possible pair combinations. This means that students usually obtained similar marks in all CLOs, which show coherence in measuring learning aspects of the same subject.
Empirical Results and Analysis
A combination of inputs covers 31 students in total for two separate courses, such as CME322 (11 participants) and ACC102 (20 participants). The summary of their evaluation outcomes has been treated as valuable input with the help of the WinSteps application. The aim was to calculate the final outcomes. Afterward, PIDM has been designed by the application.
The value δ represents the item’s area on the same characteristic: if βn prevails over δi, then the individual will be likely to reply to the item in a correct manner. The extent of an individual’s capacity is outlined by the item’s differentiation against the individual’s presence on the map. In this sense, the greater the differentiation, the more increased likelihood for an individual to reply appropriately to the given item. Equally, the degree of item complexity is expressed in the distribution of the item throughout the scale: related to the higher bar; the greater and higher the area from the item, Meantime, the bigger the perception is that the item is more complex compared to the item from a lower area. Hence, the Meantime becomes a formal threshold with the following set limits on the logit scale -0.47 for CME322 as well as 1.94 for ACC102. Nevertheless, to estimate the student’s accomplishment and CLO’s progress in terms of the PIDM, the logit parameters are produced specifically, as demonstrated in Tables 5 and 6.
| Table 5 Logit Value for Each Student | |||||
| Panel A Logit Value for Each Student for CME322 |
|||||
| Entry Number | Total Score | Total Count | Measure | Model S. E. | Student ID |
| 8 | 25 | 5 | 3.72 | 1.89 | S8 |
| 2 | 23 | 5 | 1.55 | 0.79 | S2 |
| 3 | 23 | 5 | 1.55 | 0.79 | S3 |
| 4 | 23 | 5 | 1.55 | 0.79 | S4 |
| 5 | 23 | 5 | 1.55 | 0.79 | S5 |
| 9 | 23 | 5 | 1.55 | 0.79 | S9 |
| 7 | 22 | 5 | 1.04 | 0.64 | S7 |
| 10 | 22 | 5 | 1.04 | 0.64 | S10 |
| 11 | 22 | 5 | 1.04 | 0.64 | S11 |
| 6 | 20 | 5 | 0.41 | 0.5 | S6 |
| 1 | 17 | 5 | -0.23 | 0.44 | S1 |
| Mean | 0.79 | ||||
| SD | 0.37 | ||||
| Panel B Logit Value for Each Student for ACC102 |
|||||
| Entry Number | Total Score | Total Count | Measure | Model S. E. | Student ID |
| 9 | 29 | 6 | 51.81 | 5.93 | S9 |
| 13 | 29 | 6 | 51.81 | 5.93 | S13 |
| 14 | 29 | 6 | 51.81 | 5.93 | S14 |
| 20 | 29 | 6 | 51.81 | 5.93 | S20 |
| 12 | 26 | 6 | 35.83 | 5.92 | S12 |
| 15 | 26 | 6 | 35.83 | 5.92 | S15 |
| 19 | 26 | 6 | 35.83 | 5.92 | S19 |
| 6 | 24 | 6 | 27.32 | 3.09 | S6 |
| 16 | 24 | 6 | 27.32 | 3.09 | S16 |
| 17 | 24 | 6 | 27.32 | 3.09 | S17 |
| 2 | 21 | 6 | 18.81 | 3.7 | S2 |
| 3 | 21 | 6 | 18.81 | 3.7 | S3 |
| 7 | 21 | 6 | 18.81 | 3.7 | S7 |
| 18 | 21 | 6 | 18.81 | 3.7 | S18 |
| 1 | 18 | 6 | 10.47 | 2.88 | S1 |
| 4 | 18 | 6 | 10.47 | 2.88 | S4 |
| 11 | 18 | 6 | 10.47 | 2.88 | S11 |
| 10 | 16 | 6 | 4.43 | 2 | S10 |
| 5 | 15 | 6 | 0.27 | 2.45 | S5 |
| 8 | 8 | 6 | -22.03 | 4.02 | S8 |
| Mean | 4.13 | ||||
| SD | 1.39 | ||||
| Table 6 Logit Value for Each CLO | |||||
| Panel A Logit Value for each CLO for CME322 |
|||||
| Entry Number | Total Score | Total Count | Measure | Model S. E. | CLO |
| 5 | 47 | 11 | 0.35 | 0.41 | CLO5 |
| 1 | 48 | 11 | 0.18 | 0.43 | CLO1 |
| 3 | 48 | 11 | 0.18 | 0.43 | CLO3 |
| 4 | 48 | 11 | 0.18 | 0.43 | CLO4 |
| 2 | 52 | 11 | -0.88 | 0.64 | CLO2 |
| Mean | 48.6 | 0.47 | |||
| SD | 1.7 | 0.08 | |||
| Panel B Logit Value for each CLO for ACC102 |
|||||
| Entry Number | Total Score | Total Count | Measure | Model S. E. | CLO |
| 1 | 51 | 20 | 21.09 | 1.55 | CLO1 |
| 2 | 64 | 20 | 11.94 | 2 | CLO2 |
| 6 | 64 | 20 | 11.94 | 2 | CLO6 |
| 3 | 86 | 20 | -11.96 | 1.99 | CLO3 |
| 5 | 86 | 20 | -11.96 | 1.99 | CLO5 |
| 4 | 92 | 20 | -21.04 | 2.1 | CLO4 |
| Mean | 73.83 | 1.94 | |||
| SD | 14.9 | 0.18 | |||
The estimations of students and related CLOs illustrate the logit parameter site for every participant and outcome. The PIDM indicates that the group Meanperson related to CME322 (0.79) and ACC102 (4.13) becomes above the threshold limit. This means that students incorporate great skills and capacities for the CLOs selected. In the CME322 course, one of the students (S1) was found to be below Meanitem. This student generally is able to achieve all the CLO’s except CLO2. Most of the questions to test CLO2 are used in quizzes, mid-term (1), and final examination. Thus, before the examination start, the student needs to attend skill-building workshops (i.e., time management); throughout the semester, students need to attend all of their classes (e.g., go to class prepared; set a study schedule for each class, and follow it; focus on class; attend tutoring sessions; ask your professor for help if you are having difficulty in a course); and during the examination, the period student needs to go to the exam preparation and to help sort out your time management (e.g., set up a timetable for your study; document how many examination forms are in place and how many days it will take to manage them all; prepare your education plans accordingly; make some of the exams more prioritized for preparation, and reach sort of personal peaceful harmony for continuous professional performance. In the ACC102 course, all of twenty students were found to be higher than Meanitem, which indicates that all students able to achieve CLOs without any difficulties.
Table 7 illustrates the likelihood of every learner in accomplishing every CLO in courses such as CME322 and ACC102. It ensures the evaluation of interrelations between each separate student with particular items in greater detail by calculating the likelihood of CLOs accomplishment for every single student. By applying equation (1) and (2) mentioned above, calculations can be conducted manually. By selecting student S8 for the course, CME322 as a case for computing the likelihood of accomplishing CLO5, with referring to equation (2), Pr (Si, CLOi) will become as follows:
| Table 7 Probability of Each Student to Achieve Each CLO | ||||||
| Panel A | ||||||
| Probability of each student to achieve each CLO for CME322 | ||||||
| Probability of success | CLO5 | CLO1 | CLO3 | CLO4 | CLO2 | |
| S8 | 0.815 | 0.812 | 0.812 | 0.812 | 0.777 | |
| S2 | 0.594 | 0.589 | 0.589 | 0.589 | 0.537 | |
| S3 | 0.594 | 0.589 | 0.589 | 0.589 | 0.537 | |
| S4 | 0.594 | 0.589 | 0.589 | 0.589 | 0.537 | |
| S5 | 0.594 | 0.589 | 0.589 | 0.589 | 0.537 | |
| S9 | 0.594 | 0.589 | 0.589 | 0.589 | 0.537 | |
| S7 | 0.557 | 0.552 | 0.552 | 0.552 | 0.5 | |
| S10 | 0.557 | 0.552 | 0.552 | 0.552 | 0.5 | |
| S11 | 0.557 | 0.552 | 0.552 | 0.552 | 0.5 | |
| S6 | 0.522 | 0.517 | 0.517 | 0.517 | 0.465 | |
| S1 | 0.507 | 0.502 | 0.502 | 0.502 | 0.45 | |
| Panel B | ||||||
| Probability of each student to achieve each CLO for ACC102 | ||||||
| Probability of success | CLO1 | CLO2 | CLO6 | CLO3 | CLO5 | CLO4 |
| S9 | 0.99 | 0.98 | 0.98 | 0.98 | 0.98 | 0.98 |
| S13 | 0.99 | 0.98 | 0.98 | 0.98 | 0.98 | 0.98 |
| S14 | 0.99 | 0.98 | 0.98 | 0.98 | 0.98 | 0.98 |
| S20 | 0.99 | 0.98 | 0.98 | 0.98 | 0.98 | 0.98 |
| S12 | 0.99 | 0.98 | 0.98 | 0.98 | 0.98 | 0.98 |
| S15 | 0.99 | 0.98 | 0.98 | 0.98 | 0.98 | 0.98 |
| S19 | 0.99 | 0.98 | 0.98 | 0.98 | 0.98 | 0.98 |
| S6 | 0.82 | 0.75 | 0.75 | 0.75 | 0.75 | 0.73 |
| S16 | 0.82 | 0.75 | 0.75 | 0.75 | 0.75 | 0.73 |
| S17 | 0.82 | 0.75 | 0.75 | 0.75 | 0.75 | 0.73 |
| S2 | 0.9 | 0.85 | 0.85 | 0.85 | 0.85 | 0.83 |
| S3 | 0.9 | 0.85 | 0.85 | 0.85 | 0.85 | 0.83 |
| S7 | 0.9 | 0.85 | 0.85 | 0.85 | 0.85 | 0.83 |
| S18 | 0.9 | 0.85 | 0.85 | 0.85 | 0.85 | 0.83 |
| S1 | 0.79 | 0.71 | 0.71 | 0.71 | 0.71 | 0.69 |
| S4 | 0.79 | 0.71 | 0.71 | 0.71 | 0.71 | 0.69 |
| S11 | 0.79 | 0.71 | 0.71 | 0.71 | 0.71 | 0.69 |
| S10 | 0.61 | 0.5 | 0.5 | 0.5 | 0.5 | 0.48 |
| S5 | 0.71 | 0.61 | 0.61 | 0.61 | 0.61 | 0.59 |
| S8 | 0.92 | 0.88 | 0.88 | 0.88 | 0.88 | 0.87 |
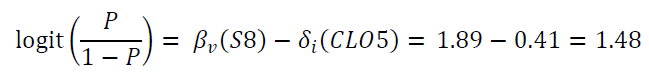
Substitute this value into the equation below:
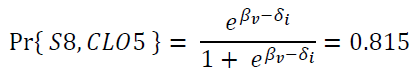
The estimate of 0.815 will become the accomplishment of CLO5 for the particular learner (S8). Table 7 also contains other parts of the evaluation.
In Table 7 Panel A, it can be concluded that out of 11 students of CME322 course, there is only one student who has no problems with his CLOs achievement. This indicates that students (S2, S3, S4, and S5) mostly are having difficulty in achieving CLO2 and no problem with the rest of other CLOs. In addition, these particular students (S1, S6, S7, S10, S11) deal with issues in accomplishing all CLOs where the likelihood of accomplishing outcomes is lower than 0.57, which is emphasized by the italic-bold font. Panel B of Table 7 indicates that among 20 students related to the ACC102 course, only 12 learners experience no issues with accomplishing their CLOs. This implies that the other eight learners have general complexities with accomplishing all CLOs where the likelihood of accomplishing outcomes is lower than 0.83 and emphasized by the italic-bold font.
We analyzed the correlation of probabilities for the different pairs of CLOs, considering Pearson’s, Kendall’s Tau, and Spearman’s Rho correlation coefficients for ACC102. The untabulated results of Pearson’s correlation coefficient show that all the pairs of CLOs kept the strong correlation (i.e., with a significance level of 0.01) for all the pairs. These results are coherent with the previous results, showing that our application of the Rash Model obtained coherent results considering the correlations among different CLO. Figure 4 shows the histograms of the probabilities of achieving each CLO, alongside the normal distribution curves for the corresponding means and SDs.
In this example, one can observe distributions similar to one between 0.50 or 0.60 to 1.00, with means between 80 and 90, showing results similar to the success ratio of students for this course and university. Thus, the proposed approach obtains realistic results. Normally the distributions were similar to normal distributions with the only exception of CLO1, in which the distribution was relatively different.
Conclusions
The Rasch Model for measurement becomes a valid tool for estimating and identifying equivalents within educational courses, which follows the mission and vision of measuring criteria and protocols. Even being a linear model, it is still quantifiable in nature. The model has become highly practical with its predictive functionality and ability to recover missing information pieces. This study discussed the evaluation and practical calculations of students’ learning outcomes for CME322 and ACC102 courses in the first semester of the academic year 2019-2020 for from both the Department of Communications and Networks Engineering and the College of Business and Administrative, Prince Sultan University (PSU) by using Rasch Measurement Model. The results were coherent in terms of correlation among different CLOs for the same group of students, and the probabilities of reaching each CLO usually followed normal distributions.
This research has confirmed that the application of the Rasch Model for assessing CLO performance for courses such as CME322 and ACC102 leads to more precise results. Measurement methodology of this sort becomes highly useful when conventional techniques of measuring the CLO solely on the students’ feedback through questionnaires fail to provide an adequate picture. The given model can generate a clear correlation pattern comparing values of students’ performance with values for every CLO. In fact, a traditional measurement technique is unable to compute such a pattern. This study’s findings might serve helpful guidance for teachers and professors in observing the students’ performance for course-based CLO. Moreover, they might assist the teaching specialists in determining the pitfalls in their teaching approaches, allowing further to enhance their methods and thus contribute to students’ increased performance. As future work, we plan to develop a tool that helps teachers in easily calculating the Rash Model for students. We also plan to apply this approach with this new supporting tool in the subject of fundaments of algorithms of the Complutense University of Madrid, in order to detect some students with learning problems and help them when appropriate to reduce the drop rate.
Acknowledgement
The authors would like to acknowledge Prince Sultan University and Smart Systems Engineering Lab for their valuable support and provision of research facilities that were essential for the completion of this work.
References
- Aaronson, D., Barrow, L., & Sander, W. (2007). Teachers and student achievement in the Chicago public high schools. Journal of Labor Economics, 25, 95-135.
- Abdullah, S., Rahmat, R.A.A.O., Zaharim, A., Muhamad, N., Deros, B.M., Kofli, N.T., Abdullah, M., Tahir, M., Muchtar, A. & Azhari, C.H. (2009). Implementing continual review of programme educational objectives and outcomes for OBE Curriculum based on stakeholders’ input. European Journal of Scientific Research, 29(1), 89-99.
- Aziz, A.A., Mohamed, A., Zaharim, A., Zakaria, S., Ghulman, H.A., & Masodi, M.S. (2008). Evaluation of information professionals competency face validity test using rasch model. In Proceedings of the 5th WSEAS/IASME international conference on Engineering education, 396-403.
- Bai, X., Xu, Y., & Ikem, F. (2013). Rubric and performance-based assessment. Issues in Information Systems, 14(2), 1-11.
- Bloom, B.S. (1956). Taxonomy of educational objectives. Cognitive domain. New York: McKay, 1, 20-24.
- Bond, T.G., & Fox, C.M. (2015). Applying the Rasch model: fundamental measurement in the human sciences. 3 edition, Routledge.
- Bonk, W.J., & Ockey, G.J. (2003). A many-facet Rasch analysis of the second language group oral discussion task. Language Testing, 20(1), 89-110.
- Bradley, K.D., Cunningham, J., Haines, R.T., Harris Jr, W.E., Mueller, C.E., Royal, K.D., Sampson, S.O., Singletary, G., & Weber, J. (2010). Constructing and evaluating measures: Applications of the Rasch measurement model. University of Kentucky (ed.). Lexington, KY.
- Cetin, B., & Ilhan, M. (2017). An analysis of rater severity and leniency in open-ended mathematic questions rated through standard rubrics and rubrics based on the SOLO taxonomy. Egitim ve Bilim, 42(189).
- Chae, J., Cho, Y., Lee, M., Lee, S., Choi, M., & Park, S. (2016). Design and implementation of a system for creating multimedia linked data and its applications in education. Multimedia Tools and Applications, 75(21), 13121-13134.
- Chang, M.L., & Engelhard Jr, G. (2016). Examining the Teachers’ Sense of Efficacy Scale at the item level with Rasch measurement model. Journal of Psychoeducational Assessment, 34(2), 177-191.
- Farhan, M., Aslam, M., Jabbar, S., & Khalid, S. (2018). Multimedia based qualitative assessment methodology in eLearning: student teacher engagement analysis. Multimedia tools and applications, 77(4), 4909-4923.
- Kalinowski, K., Krenczyk, D., Paprocka, I., Kempa, W., & Grabowik, C. (2016). Multi-criteria evaluation methods in the production scheduling. In IOP Conference Series: Materials Science and Engineering, 145(2), 022019.
- Kaya-Uyanik, G., Gur-Erdogan, D., & Canan-Gungoren, O. (2019). Examination of the Relationship between Prospective Teachers' Occupational Anxiety and Technological Pedagogical Content Knowledge by Canonical Correlation. International Journal of Educational Methodology, 5(3), 407-420.
- Rasch, G. (1961). On general laws and the meaning of measurement in psychology. In Proceedings of the fourth Berkeley symposium on mathematical statistics and probability, 4, 321-333.
- Rasch, G. (1993). Probabilistic models for some intelligence and attainment tests. MESA Press, 5835 S. Kimbark Ave., Chicago, IL 60637.
- Rozeha, A.R., Azami, Z., & Mohd Saidfudin, M. (2007). Application of Rasch Measurement in Evaluation of Learning Outcomes: A case study in electrical engineering. In Regional Conference on Engineering Mathematics, Mechanics, Manufacturing & Architecture (EM3ARC).
- Semerci, Ç. (2011). The relationships between achievement focused motivation and critical thinking. African Journal of Business Management, 5(15), 61-79.
- Talib, A.M., Alomary, F.O., & Alwadi, H.F. (2018). Assessment of Student Performance for Course Examination Using Rasch Measurement Model: A Case Study of Information Technology Fundamentals Course. Education Research International.
- van de Grift, W., Helms-Lorenz, M., & Maulana, R. (2014). Teaching skills of student teachers: Calibration of an evaluation instrument and its value in predicting student academic engagement. Studies in educational evaluation, 43, 150-159.
- Van de Grift, W.J., Houtveen, T.A., van den Hurk, H.T., & Terpstra, O. (2019). Measuring teaching skills in elementary education using the Rasch model. School Effectiveness and School Improvement, 30(4), 455-486.
- van der Lans, R.M., van de Grift, W.J., van Veen, K., & Fokkens-Bruinsma, M. (2016). Once is not enough: Establishing reliability criteria for feedback and evaluation decisions based on classroom observations. Studies in Educational Evaluation, 50, 88-95.
- Wright, B.D., & Mok, M. (2000). Understanding Rasch measurement: Rasch models overview. Journal of Applied Measurement.