Research Article: 2021 Vol: 20 Issue: 3
How Do Three Financial Analysis Pillars and Investment Policies Define the Firm Value in the Basic Industry and Chemical Sector?
Nurdian Susilowati, Universitas Negeri Semarang, Semarang
Siti Ridloah, Universitas Negeri Semarang, Semarang
Rahayu Lestari, Universitas Negeri Semarang
Aulia Herdiana, Universitas Negeri Malang
Abstract
This paper examines the effect of liquidity, profitability, solvency, and investment policies on the firms’ value in an important emerging market. The data are from 29 firms listed on the Indonesia Stock Exchange. The quantitative approach was employed in this research. Regression and descriptive statistics models are used by taking the financial statements of the Basic Industry and Chemicals sector from 2014 to 2017. The results revealed that the current ratio, return on assets, debt to equity ratio, price-earnings ratio significantly affect the company's value with Tobin's Q as a proxy. The debt to assets ratio has no significant effect on the company’s value. The overall results revealed that a well-designed liquidity management policy could increase the firm value in the Basic Industry and Chemicals sector. The research contributes to the signalling theory. There is some information asymmetry between principal and agent.
Keywords
Profitability, Solvency, Investment Policies, Liquidity, Tobin’s Q.
Introduction
Firm value is the perception or expectation of investors at the company level, often associated with stock prices (Safitri et al., 2014). Company conditions influence the high or the low share prices. The better the company's performance, the greater the increase in stock prices, the higher the stock price, and the higher rate of return to investors. It means that the higher the company value associated with its goals, maximizing shareholders' prosperity. Firm value can be measured through several aspects: the stock market price because it can reflect the overall investor assessment of any equity the company has. According to Liow (2010), company value is the share price paid by investors for the shares offered by the company. The market price of the company's shares is formed between the buyer and seller at the time of the transaction because the stock market price is considered a reflection of the actual value of the company's assets (Santos et al., 2012).
The Basic Industries and Chemicals sector is the sector that grows the highest on the IDX as of March 14, 2017. The sectors grew up to 5.71% to a level of 568.9 compared to the position at the end of 2016. The sector reached the highest growth rate; it is higher than the JCI (Composite Stock Price Index) growth which was only 2.5% throughout 2017. It shows that the company in the Basic Industry and Chemicals sector has a good value in the eyes of investors. Firm value is influenced by the level of demand for shares by investors towards the company. The higher the demand for shares by investors, the higher the company's share price, which will undoubtedly increase the firm value. Several factors influence the decision of investors to buy stocks or invest. The factors that influence the investor's decision are the liquidity, profitability, solvency of a company, and investment policies by the company's manager concerned, increasing the company's profits and revenue growth. For this reason, investors must have sufficient information about the condition and performance of the company before deciding to invest or buy shares.
The signaling theory encourages information about companies to investors, creditors, or potential investors and creditors (Connelly et al., 2011). The information asymmetry between the agent and the principal results in a lack of trust from the principal, namely investors and creditors in the company, so that investors and creditors protect themselves by providing low share prices (Mavlanova et al., 2012). The lower the stock price, the lower the value of a company. Therefore, investors and creditors need to be a signal to consider investors and creditors in providing value. This signal gives information about the condition and achievements of the company, both positive and negative. Liquidity means its ability to meet its short-term obligations with its current assets (Samo & Murad, 2019). Liquidity is measured by the ratio of current assets to current liabilities.
The higher the level of company liquidity, the higher the ability of its short-term liabilities at maturity (Ku & Yen, 2016). A safe liquidity ratio for the company is above 1 or 100% if it uses a percentage, meaning its current assets can cover its current debt. Liquidity is essential information for investors. Liquidity is related to the company's ability to fulfill its obligations to investors for each period. The higher the level of company liquidity, the more funds available for the company to pay dividends to shareholders, as well as being able to finance operating and investment activities, so that investors' trust and perception of company performance will also increase, which affects company value (Safitri et al., 2014). As measured by the Current Ratio (CR), liquidity has a positive and significant effect on firm value (Wolf et al., 2016; Das et al., 2021). Whereas Ebenezer et al. (2019) found that liquidity with CR as a proxy does not significantly affect firm value. These results are supported by Shubita & Alswalhah (2012) that CR has no significant effect on firm value.
Profitability is the company's ability to earn profits for a certain period. Profitability shows the ratio between profit and assets or capital it owns. Profitability describes the ability of the invested capital in the form of assets that are used to earn profits (Marsha & Murtaqi, 2017). Profitability is measured using two ratios, i.e., Return on Equity (ROE) and Return on Assets (ROA) (Shubita & Alswalhah, 2012). The profitability ratio measured by ROE describes the rate of return that shareholders will receive on their investment in the company (Zuhroh, 2019).
Meanwhile, ROA shows the income level available to company holders on company assets (Marsha & Murtaqi, 2017). High profitability shows that the company can generate profits and benefits for stakeholders (Harahap et al., 2020). Profit is an important consideration for investors in investing. Because of the company's profit, the return that investors will obtain will also be significant. A high rate of return will increase the interest and confidence of investors to invest so that it can affect the value of the company.
The profitability is measured by the ROE level, has a positive and significant effect on firm value. In line with (Chasanah & Adhi, 2017), it shows that profitability, as measured by ROA, has a positive and significant effect on firm value. Meanwhile, (Naceur & Goaied, 2002) found that profitability, as measured by ROA, does not affect firm value. Likewise, in the research (Daines, 2001), profitability with ROE as a proxy does not significantly affect firm value. Solvency or leverage describes how much assets owned by a company are obtained using debt compared to own capital (Wagner, 2014; Suffah & Riduwan, 2016). Solvency is the capital structure policy regarding whether the company will finance its operations and investments with large debt or its capital determine how much assets owned by the company are obtained through debt. Solvency has two ratios, namely Debt to Equity Ratio (DER) and Debt to Assets Ratio (DAR), where DER describes the ratio between debt and capital owned by the company, while DAR describes the number of assets that are funded by debt (Eisenberg et al., 1998; McShane et al., 2011).
A good capital structure is a debt not bigger than own capital, with a debt-to-equity ratio of less than 1 (Safitri et al., 2014). The greater the level of debt, the greater the burden borne by the company on third parties or creditors in the form of debt principal and interest. When the company's business conditions are good and smooth, debt can increase profits, which will also increase returns to shareholders, and vice versa (Efobi et al., 2016). Companies with large business development will certainly need large funds so that other external parties, namely creditors, are needed to meet the needs in business development. The development of a large business that is good in the long term will also produce big profits for investors (Rashid & Saeed, 2017).
The investment policy is related to decision-making by managers in choosing investments. Managers' investment decisions must be correct and expected to provide benefits or economic benefits for the company and shareholders (Naceur & Goaied, 2002). If the manager is wrong in making investment decisions, it will affect its survival, which will affect the investors' judgment or perception of the company (Daines, 2001). Investment decisions measured by the Price Earnings Ratio proxy have a positive and significant effect on firm value (Rashid & Saeed, 2017). It is also supported by (Sujoko, 2018) who concluded that investment policies with Price Earnings Ratio as a proxy have a positive and significant effect on firm value. The price-earnings ratio does not significantly affect firm value (Riahi-Belkaoui & Picur, 2001).
The purpose of this paper is to examine the effect of liquidity, profitability, solvency, and investment policy on firm value. The contribution of this research is to increase the repertoire of knowledge and strengthen the signaling theory. The research contributes to the signaling theory. There is some information asymmetry between principal and agent. In addition, the results of this study are also beneficial for companies in financial management and investors in investing.
Methodology
Research Design
It is a quantitative approach to determine the effects of liquidity, profitability, solvency, and investment policies on Indonesia’s Basic Industry and the Chemicals sector's firm value. A multiple linear regression method was used to analyze 29 the Basic Industry and Chemicals Sector over a period from 2014 to 2017 (4 years). The research also used classic assumptions before regression analysis. It also used the descriptive percentage to describe each variable.
Population and Sample
The populations were 78 companies in the Basic Industry and Chemicals sector, listed on the Indonesia Stock Exchange (IDX) during the observation period from 2014 to 2017. The samples were 29 companies taken by purposive sampling with some criteria as the samples of the study. The criteria were (1) Basic Industry and Chemicals sector companies that publish financially; and (3) Companies that generate profits.
Data Collection Technique
It analyzed the secondary data. The data were from the company's annual financial statements from 2014 to 2017. The data were collected with documentation. Data were taken from observational company financial reports in the Indonesia Stock Exchange and accessed the Indonesia Stock Exchange (IDX) web page and other sources.
Variable Description
The independent variables of the study were liquidity, profitability, solvency, and investment policies. Liquidity was measured as the current ratio. Profitability was measured as return on assets. Solvency was measured as a debt-to-equity ratio, and investment policies were measured as price earnings ratio. The dependent variable was firm value. Firm value was measured as Tobin’s Q formula.
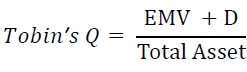
Firm’s Value
Firm value is the investor's perception of the business performance and operations related to the stock price. The firm value was measured as Tobin’s Q formula.
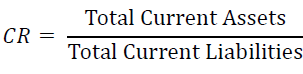
Liquidity
Liquidity is the ability of a company to pay its short-term. Liquidity was measured as the Current Ratio. The formula of the current ratio as follows:
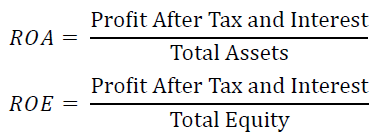
Profitability
Profitability is the company's ability to earn a profit for a certain period. Profitability in this research was measured as Return on Assets (ROA) and Return on Equity (ROE). The formula of ROA and ROE are as follows:
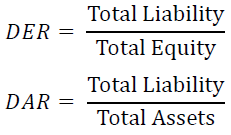
Solvency
Solvency in this research used two ratios. For the measurement of solvency, the Debt-to-Equity Ratio (DER) and Debt to Assets Ratio (DAR) were used. The DER and DAR measurements were as follows:
Investment Policies
Investment policies are decisions taken by managers in choosing capital investments expected to generate profits for the company in the future. Investment policy in this study is measured by the Price Earnings Ratio (PER). PER is a comparison between the company's share price at closing and earnings per share. The PER formula was as follows:
Hypotheses
H1 Liquidity ratio has a significant effect on firm value
H2 Profitability ratio has a significant effect on firm value
H3 Solvency ratio has a significant effect on firm value
H4 Investment policies have a significant effect on firm value.
Data Analyses Model
A multiple regression analysis model was used to propose relationships as hypothesized. This model explains that both slopes and intercepts are constant, in which the time-series data, as well as the cross-sectional firm data, are used. The formula of multiple linear regression analysis was as follows.

Results
Descriptive Statistics
Table 1 shows the descriptive statistics of the Indonesian Basic Industry and Chemicals sector from 2014 to 2017 with 116 observations. Tobin’s Q has a mean value of 1.4873 and a standard deviation of 1.38020 with a range of 0.30 and 8.71. CR has a mean value of 2.9838 and a standard deviation of 2.84928 with a range of 0.79 and 15.16. Next, ROA represents a mean value of 0.0603 and a standard deviation of 0.04825. Then, ROE has a mean value of 0.1316 and a standard deviation of 0.23229. DER has a mean value of 1.0377 and a standard deviation of 1.20050. DAR has a mean value of 0.4120 and a standard deviation of 0.20452. Then, PER has a mean value of 21.6671 and a standard deviation of 28.83352.
| Table 1 Descriptive Statistics of the Indonesia Basic Industry and Chemicals | |||||
| Variable | N | Min | Maximum | Mean | SD |
| TOBIN’S Q | 116 | 0.30 | 8.71 | 1.4873 | 1.38020 |
| CR | 116 | 0.79 | 15.16 | 2.9838 | 2.84928 |
| ROA | 116 | 0.00 | 0.21 | 0.0603 | 0.04825 |
| ROE | 116 | 0.00 | 1.82 | 0.1316 | 0.23229 |
| DER | 116 | 0.08 | 7.99 | 1.0377 | 1.20050 |
| DAR | 116 | 0.07 | 0.89 | 0.4120 | 0.20452 |
| PER | 116 | 0.04 | 253.33 | 21.6671 | 28.83352 |
| Valid N (listwise) | 116 | ||||
Classic Assumption Test
The normality test results to determine whether the data in the research were normally distributed or not with SPSS 21 using the Kolmogorov-Smirnov. The results showed that the data were normally distributed. The significance value is 0.193, more than 0.05. The Durbin Watson test checked whether autocorrelation occurs in this research model or not, and the following results are obtained. Based on the autocorrelation test, the Durbin-Watson (DW) value is 1.892. The dU value in the Durbin-Watson was k=6, and n=116 is 1.8070, and the 4-dU value is 2.193. The author used Variance Inflation Factor (VIF) to detect correlations between independent variables. According to (Lind et al., 2019) a VIF greater than 10 is considered unsatisfactory, indicating that the independent variable should be removed from the analysis. The results of the multicollinearity test showed that all independent variables have a VIF of less than 10, so it concluded that the regression model in this study is broad from multicollinearity. The results of the heteroscedasticity test with Spearman's rho correlation method. The results of Spearman's rho correlation test showed that the correlation significance value of the CR, ROA, ROE, DER, DAR, and PER variables to the Unstandardized Residual Value was more than 0.05. So, it concluded that the regression model in this study does not occur heteroscedasticity.
Multiple Linear Regression Analysis
Based on the data in Table 2, the regression equation is obtained as follows:
| Table 2 Multiple Linear Regression Analysis | ||||||
| Model | Unstandardized Coefficients | Std. Error | Standardized Coefficients | t | Sig. | |
| B | Beta | |||||
| 1 | (Constant) | 1.129 | 0.51 | 2.214 | 0.029 | |
| CR | -0.116 | 0.043 | -0.239 | -2.673 | 0.009 | |
| ROA | 12.296 | 2.115 | 0.43 | 5.815 | 0 | |
| ROE | -0.693 | 0.384 | -0.117 | -1.803 | 0.074 | |
| DER | 0.826 | 0.12 | 0.718 | 6.9 | 0 | |
| DAR | -3.568 | 0.947 | -0.529 | -3.767 | 0 | |
| PER | 0.031 | 0.003 | 0.642 | 10.308 | 0 | |
Source: Processed Data, 2020
TOBIN’S Q = 1,129 – 0,116CR + 12,296ROA – 0,693ROE + 0,826DER – 3,568DAR + 0,031PER + e
Hypotheses Testing
The p-value tests hypotheses; if it is less than 0.05, the hypothesis is accepted, and if it is more than 0.05, the hypothesis is rejected. Based on the research results, only DER p-value more than 0,05. The DER p-value was 0.074, so the hypothesis was rejected. On the other side, the five hypotheses were accepted (Table 3).
| Table 3 Hypothesis Testing | ||||
| Hypothesis | Model | T | p-value | Note |
| (Constant) | -2.673 | 0.009 | Accepted | |
| 1 | CR | -2.673 | 0.009 | Accepted |
| 2 | ROA | 5.815 | 0.000 | Accepted |
| 3 | ROE | -1.803 | 0.074 | Accepted |
| 4 | DER | 6.900 | 0.000 | Rejected |
| 5 | DAR | -3.767 | 0.000 | Accepted |
| 6 | PER | 10.308 | 0.000 | Accepted |
Discussion
The Effect of Liquidity on Firm Value
The results showed that the current ratio as a proxy has a negative and significant effect on firm value. Liquidity is the company's ability to pay its short-term obligations. A high level of liquidity indicates that companies can use many available funds to fulfill their obligations to investors, namely paying dividends (Wolf et al., 2016; Samo & Murad, 2019). The ability to pay dividends on time is an attraction for investors, impacting increasing company value. Lubis et al. (2017) prove that liquidity, as measured by the current ratio, positively and significantly affects firm value. Das et al. (2021) also state that the current ratio significantly affects firm value.
However, in this study, the current ratio has a negative effect on firm value. The higher the current ratio level, the lower the firm value. It is because the higher the current ratio level does not necessarily have high performance. According to Rashid & Saeed (2017), a too high current ratio level indicates many idle company funds in certain conditions. It means that the company's operations are not running well, such as high inventories because they have not been sold, high uncollectible receivables, which of course cannot be used quickly to pay off debt. The high current ratio in these conditions will undoubtedly reduce investors' perceptions of company performance (Riahi-Belkaoui & Picur, 2001).
The Effect of Profitability on Firm Value
Profitability was measured as Return on Assets (ROA) and Return on Equity (ROE). Meanwhile, profitability, as measured by ROE, has no significant effect on firm value. Profitability is a company's ability to generate profits by utilizing resources. Profitability is an important consideration for investors to invest in. A company with high profitability has good business performance and will certainly provide high returns to shareholders. High profitability will attract investors to increase demand for shares due to good investor perceptions of the company to increase company value (Chasanah & Adhi, 2017).
However, high profitability is not the main determinant of investor interest in investing. High profitability may not be due to good company performance but is the result of management skills in performing earnings management. Thus, despite the high profitability, investors' interest in the demand for company shares is not high. In this research, ROE has a negative impact, although not significant. ROE can negatively affect firm value; this is because the level of ROE is unstable every year, thereby reducing asking investors to buy company shares, which affects decreasing stock prices and affecting company value (Eldomiaty et al., 2019; Safitri et al., 2014).
The Effect of Solvency on Firm Value
The results show that DER has a positive and significant effect on firm value. It means a higher level of debt indicates a high firm value. The higher the debt value indicates that the higher the level of company business development. The development of a large business that is good in the long term will also result in large profits for investors (Roy & Narayanan, 2019; Wagner, 2014), thus impacting increasing company value. Meanwhile, DAR has a negative effect on firm value. It shows that the more assets are financed with debt, the lower the firm's value. The level of debt experienced by the Basic and Chemical Companies in this study is too high to finance the company's operations and investment so that the burden borne by the company is far greater than the level of profit that can be distributed to shareholders.
The Effect of Investment Policy on Firm Value
The investment policy has a positive and significant effect on firm value. The results are in line with the research of Efobi et al. (2016); Sujoko (2018), which also states that investment policy positively and significantly, impacts firm value. It shows that the investment made by the Basic Industry and Chemicals Company is very appropriate, so it increases investor confidence in increasing demand for shares of the company and increasing company value. Investment decisions taken by company managers will determine the optimal level of revenue growth and performance, which will later affect the value of the company (Wolf et al., 2016; Eldomiaty et al., 2019).
Conclusions
This paper aimed to know the importance of liquidity, solvency, profitability, and investment policy for a firm's value in the specifically Indonesia Basic Industry and Chemicals Sector. There were six hypotheses, and only one was rejected. The liquidity showed that a firm meeting its day-to-day cash operations appropriately could get high returns on assets. They also can get a high return on equity. High profitability may not be due to good company performance but is the result of management skills in performing earnings management. Thus, despite the high profitability, investors' interest in the demand for company shares is not high. The debt to assets ratio has a negative and significant effect on firm value. It shows that the more assets are financed with debt, the lower the firm's value. Investment decisions taken by company managers will determine the optimal level of revenue growth and performance, which will later affect the company's value. This research can describe the good management of the firm in good decision-making and excellent performance to enhance the business's financial health to encourage investment.
Recommendations
This research is only limited to companies in the Basic Industry and Chemicals sector for the period 2014 - 2017, so that further research can be expanded to other sectors with a longer observation period so that accurate results can be obtained. This study only proceeds those independent and dependent variables as mentioned above, not paying attention to other variables.
References
- Chasanah, A.N., & Adhi, D.K. (2018). Profitability, capital structure and liquidity influence on company value in real estate companies listed on the idx in 2012-2015. Economic Focus: Scientific Journal of Economics, 12(2), 109-128.
- Connelly, B.L., Certo, S.T., Ireland, R.D., & Reutzel, C.R. (2011). Signaling theory: A review and assessment. Journal of Management, 37(1), 39-67.
- Daines, R. (2001). Does Delaware law improve firm value? Journal of Financial Economics, 62(3), 525-558.
- Das, N.C., Chowdhury, M.A.F., & Islam, M.N. (2021). The heterogeneous impact of leverage on firm performance: empirical evidence from Bangladesh. South Asian Journal of Business Studies.
- Ebenezer, O.O., Islam, M.A., Junoh, M.Z.M., & Yusoff, W.S. (2019). Loan Growth, Bank Solvency and Firm Value: A Comparative Study of Nigerian and Malaysian Commercial Banks. Journal of Reviews on Global Economics, 8, 373-386.
- Efobi, U., Voufo, B.T., Beecroft, I., & Okougbo, P. (2016). On the solvency of firms: Can government’s intervention reduce external financing of firms’ working capital in Nigeria? Advanced Series in Management, 15, 47-75.
- Eisenberg, T., Sundgren, S., & Wells, M.T. (1998). Larger board size and decreasing firm value in small firms. Journal of Financial Economics, 48(1), 35-54.
- Eldomiaty, T.I., Andrikopoulos, P., & Bishara, M.K. (2019). Financial decisions and growth of the firm under high and low levels of information asymmetry. Research in Finance, 35, 19-51.
- Harahap, I.M., Septiani, I., & Endri, E. (2020). Effect of financial performance on firms’ value of cable companies in Indonesia. Accounting, 6(6), 1103-1110.
- Ku, Y.Y., & Yen, T.Y. (2016). Heterogeneous effect of financial leverage on corporate performance: A quantile regression analysis of Taiwanese companies. Review of Pacific Basin Financial Markets and Policies, 19(3), 1650015.
- Lind, D.A., Marchal, W.G., & Wathen, S.A. (2019). Basic Statistics for Business and Economics. The Statistician (9th Edn.). McGraw-Hill Education, New York.
- Liow, K.H. (2010). Firm value, growth, profitability and capital structure of listed real estate companies: An international perspective. Journal of Property Research, 27(2), 119-146.
- Marsha, N., & Murtaqi, I. (2017). The Effect of Financial Ratios on Firm Value in The Food and Beverage Sector of The IDX. Journal of Business and Management, 6(2), 214-226.
- Mavlanova, T., Benbunan-Fich, R., & Koufaris, M. (2012). Signaling theory and information asymmetry in online commerce. Information and Management, 49(5), 240-247.
- McShane, M.K., Nair, A., & Rustambekov, E. (2011). Does enterprise risk management increase firm value? Journal of Accounting, Auditing and Finance, 26(4), 641-658.
- Naceur, S.B., & Goaied, M. (2002). The relationship between dividend policy, financial structure, profitability and firm value. Applied Financial Economics, 12(12), 843-849.
- Rashid, A., & Saeed, M. (2017). Firms’ investment decisions–explaining the role of uncertainty. Journal of Economic Studies, 44(5), 833-860.
- Riahi-Belkaoui, A., & Picur, R.D. (2001). Investment opportunity set dependence of dividend yield and price earnings ratio. Managerial Finance, 27(3), 65-71.
- Roy, I., & Narayanan, K. (2019). Outward FDI from India and its impact on the performance of firms in the home country. Journal of Asia Business Studies, 13(1), 1-32.
- Safitri, O.N., Handayani, S.R., & Nuzula, N.F. (2014). The Influence of Capital Structure and Proftability on Firm Value (A Study in Retail Companies Listed in Indonesia Stock Exchange 2010-2013 period ). Jurnal Administrasi Bisnis, 13(2), 1-19.
- Samo, A.H., & Murad, H. (2019). Impact of liquidity and financial leverage on firm’s profitability – an empirical analysis of the textile industry of Pakistan. Research Journal of Textile and Apparel, 23(4), 291-305.
- Santos, R.L., da Silveira, A.D.M., & Barros, L.A. (2012). Board Interlocking in Brazil: Directors’ Participation in Multiple Companies and Its Effect on Firm Value and Profitability. Latin American Business Review, 13(1), 1-28.
- Shubita, M.F., & Alswalhah, J.M. (2012). The Relationship between Capital Structure and Profitability. International Journal of Business and Social Science, 3(16), 104-112.
- Sujoko, S. (2018). Pengaruh Struktur Kepemilikan, Strategi Diversifikasi, Leverage, Faktor Intern Dan Faktor Ekstern Terhadap Nilai Perusahaan (Studi Empirik Pada Perusahaan Manufaktur Dan Non Manufaktur Di Bursa Efek Jakarta). EKUITAS (Jurnal Ekonomi Dan Keuangan), 11(2), 236-254.
- Wagner, J. (2014). A note on the appropriate choice of risk measures in the solvency assessment of insurance companies. Journal of Risk Finance, 15(2), 110-130.
- Wolf, C.A., Stephenson, M.W., Knoblauch, W.A., & Novakovic, A.M. (2016). Dairy farm financial performance: firm, year, and size effects. Agricultural Finance Review, 76(4), 532-543.
- Zuhroh, I. (2019). The Effects of Liquidity, Firm Size, and Profitability on the Firm Value with Mediating Leverage. KnE Social Sciences, 3(13), 203.