Research Article: 2018 Vol: 17 Issue: 2
Image of Indonesian Life Insurance Companies by Their Client's Trust
Paidi, STIE Dharma Bumiputera
Sucherly, Padjadjaran University
Umi Kaltum, Padjadjaran University
Arief Helmi, Padjadjaran University
Keywords
Life Insurance Company, Life Insurance Policy Holder, Life Insurance Premium, Service, Contract Expiry Claim, Loyalty.
Introduction
The progress of insurance in Indonesia has a connection to the national economy growth which is supported by the growth of investment sector which periodically enjoys a positive escalation during the recent few years. Meanwhile on the other hand, the growing investment climate will drive the business world requiring the life insurance protection especially for their employees.
Based on Insurance Sector Statistical Data Year 2013 issued by the Financial Services Authority (OJK) it is indicated that total life insurance companies which have the business permit to operate in Indonesia are 51 companies. The prospect of life insurance and general insurance industry business in Indonesia is relatively stable. It is supported by Indonesian economy which grows and develops from time to time. Indonesia is the fourth most populated country in the world, so the insurance industry in Indonesia especially the individual life insurance has a very big potential to be developed in the future.
The business progress of insurance industry sector has not yet indeed significantly contributed to Indonesia’s economy. The revenue of premium from life insurance sector within the recent 5 years (2010-2014) is as presented in the Table 1 below:
| Table 1 Live Insurance Premium Revenue Year 2010-2014 (in Billion US $) |
|||||
| Premium Revenue | 2014 | 2013 | 2012 | 2011 | 2010 |
| Individual Insurance | 3.74 | 1.40 | 1.99 | 1.31 | 1.64 |
| Group Insurance | 9.16 | 7.36 | 6.30 | 5.96 | 4.21 |
| Total | 12.90 | 8.78 | 8.29 | 7.27 | 5.85 |
The number of life insurance policy holders can be categorized into 2 (two) groups, i.e., individual life insurance and group life insurance or askum. The number of life insurance policy holders within 2010-2014 periods is as indicated in the Table 2 below:
| Table 2 Total Life Insurance Policy Holders in 2010-2014 (in Million People) |
|||||
| Premium Revenue | 2014 | 2013 | 2012 | 2011 | 2010 |
| Individual Insurance | 15.50 | 13.62 | 10.99 | 8.90 | 9.30 |
| Group Insurance | 38.24 | 74.50 | 34.70 | 40.80 | 23.90 |
| Total | 53.74 | 88.12 | 45.69 | 49.70 | 33.20 |
Or graphically total life insurance policy holders in 2010-2014 can be presented as follows (Figure 1):
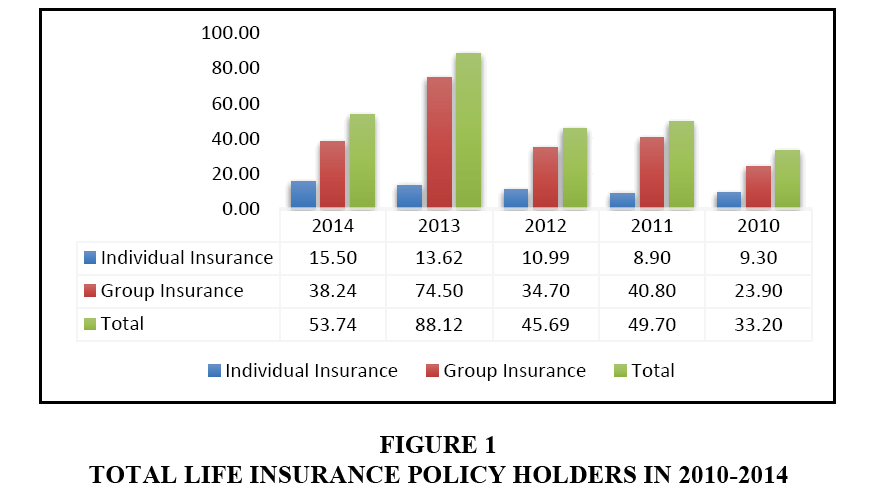
Figure 1: Total Life Insurance Policy Holders in 2010-2014
Meanwhile total life insurance policy holders in Indonesia both individual and group insurances within 2010-2014 whose policies do not last through the contract expiry is shown in Tables 3 and 4 below:
| Table 3 Total Lapsed Policies and Policy Redemption Individual Life Insurance (Asper) Policy in 2010-2014 (in Million People) |
|||||
| Policy Holder | 2014 | 2013 | 2012 | 2011 | 2010 |
| New Policy | 15.50 | 13.62 | 10.99 | 8.90 | 9.30 |
| Lapsed Policy | 3.98 | 3.41 | 2.58 | 2.20 | 1.95 |
| Policy Redemption | 2.36 | 1.97 | 1.51 | 1.15 | 1.16 |
| Total | 9.16 | 8.24 | 6.90 | 5.75 | 6.19 |
Source: Processed life insurance association (AAJI)
| Table 4 Total Lapsed Policy and Policy Redemption of Group Life Insurance Policy (Askum) in 2010-2014 (in Millions) |
|||||
| Policy Holder | 2014 | 2013 | 2012 | 2011 | 2010 |
| New Policy | 38.24 | 74.50 | 34.70 | 40.80 | 23.90 |
| Lapsed Policy | 2.49 | 5.03 | 2.17 | 2.75 | 1.67 |
| Policy Redemption | 2.35 | 4.54 | 1.99 | 2.45 | 1.59 |
| Total | 33.40 | 64.93 | 30.54 | 35.60 | 20.64 |
Source: Processed life insurance association (AAJI)
Based on information collected by the researcher, both from several insurance companies, from the Indonesian Life Insurance Association (AAIJ) and from the Financial Services Authority (OJK) of the Republic of Indonesia, not all policy holders are willing to pay the premium until the expiry of their insurance contract period.
There is an interesting phenomenon, i.e., that the preliminary research result shows a general picture on the corporate image, product quality, service, trust and loyalty of life insurance policy holders in Jakarta and its surrounding area, as shown in Table 5 below.
| Table 5 Perception of Policy Holders on the Corporate Image, Product Quality, Service, Trust and Loyalty of Life Insurance Policy Holders in Dki Jakarta Area in 2015 (Preliminary Survey on 100 Customer Respondents) |
|||||
| Variable | Highly Satisfied | Satisfied | Sufficiently Satisfied | Dissatisfied | Highly Dissatisfied |
| Corporate Image | 3% | 7% | 25% | 55% | 10% |
| Product Quality | 5% | 8% | 15% | 65% | 7% |
| Service | 3% | 7% | 15% | 65% | 10% |
| Trust | 2% | 7% | 10% | 70% | 11% |
| Loyalty | 0% | 3% | 7% | 75% | 15% |
Source: Processed life insurance association (AAJI)
The picture of preliminary survey indicated that the corporate image, product quality, service, trust and loyalty are not yet taken into account by the life insurance companies in DKI Jakarta region in particular and Indonesia in general, since they are still dominated by dissatisfied and highly dissatisfied factors reaching an average rate of 65%. Meanwhile the life insurance policies not covering the contract expiry within 2010-2014 periods are 19.19% in Year 2010; 17.20% in 2011; 18.08% in 2012; 18.08%, 17.47% in 2013; 20.66% in 2014.
Based on the phenomenon from the preliminary survey and the so many insurance policies not covering the contract expiry period, the researcher wished to conduct a deeper and thorough research on the influence of corporate image, product quality, service, trust and loyalty of the life insurance policy holders in Indonesia. The objective was to generate a review on the image of life insurance companies towards customers’ trust.
Research Method
Based on identification, formulation, objective of research as well as frame of reference, the research method applied was random sampling, with the standard control was the policy holders who have minimum coverage rate of US $1.00. The research was conducted in DKI Jakarta region, Indonesia which came from 5 (five) insurance companies considered as the representatives of big, medium and small scales insurance companies in Indonesia.
This research data processing applied the Structural Equation Modelling (SEM). The use of SEM as an analysis tool was based on two key reasons as follows:
1. SEM was able to test a complex and complicated research model partially and simultaneously as well.
2. SEM was able to analyse the unobserved variables and to take into account the error of its measuring rate.
The data obtained from the respondents made as the research samples through the questionnaires distributed would be analysed by using Structural Equation Modelling (SEM) based on LISREL 9.10 program (Table 6). This LISREL 9.10 program showed the measurement of a structural problem and was used to test hypothesis model. The Structural Equation Modelling had a main characteristic that distinguished it from other multivariate analysis techniques.
| Table 6 Samples of Life Insurance Policy Holders in Dki Jakarta Area Years 2011-2014 |
|||
| No. | Life Insurance Company | Remarks | Total Sample |
| 1 | AJB Bumiputera 1912 | 3.608.171/7.040.044x400 | 205 |
| 2 | PT. As. Jiwa Sraya (Persero) | 1.312.725/7.040.044x400 | 75 |
| 3 | PT. Prudential Life Assurance | 1.207.729/7.040.044x400 | 69 |
| 4 | PT. BNI Life Insurance | 480.132/7.040.044x400 | 27 |
| 5 | PT. Zurich Topas Life | 431.287/7.040.044x400 | 24 |
| 6 | Jumlah | 400 | |
Source: OJK insurance sector statistic year 2014 (processed)
Operational Variables in this research were:
1. Independent variable i.e., the corporate image (X1), product quality (X2) and service (X3).
2. Intervening variable i.e., trust (Z).
3. Dependent variable i.e., loyalty (Y).
Meanwhile the paradigm of this research is as shown in the Figure 2 below:
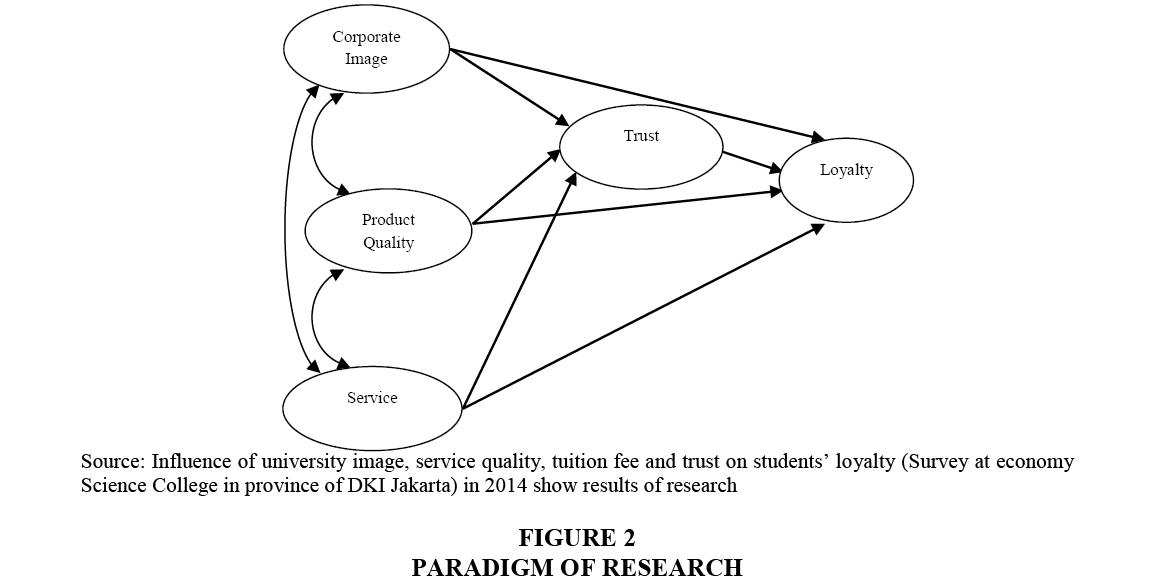
Figure 2: Paradigm of Research
Based on the research analysis and review, the research results are hereby presented as shown in Table 7 below:
| Table 7 Summary of Estimation Result on Line Coefficient and Statistical Test |
||||
| Substructure | Relation | Line Coefficient | T-value | R-square |
| First | X1→Z | 0.155 | 2.475 | 0.485 |
| X2→Z | 0.269 | 4.253 | ||
| X3→Z | 0.384 | 5.453 | ||
| Second | Z→Y | 0.415 | 6.416 | 0.551 |
| X1→Y | 0.092 | 1.621 | ||
| X2→Y | 0.162 | 2.779 | ||
| X3→Y | 0.201 | 2.979 | ||
Based on Table 7 above, the results of study are presented as follows:
1. The research result indicates that the Corporate Image has partially no significant effect on Loyalty. The calculation on line coefficient shows that the value of line coefficient between the Corporate Image (X1) and Loyalty (Y) is 0.092 with positive direction, which means the higher or the better the Corporate Image (X1), the higher the Loyalty (Y), is viewed from the value of thing, the Corporate Image (X1) variable of 1.621 is smaller than table (1.96), since the value of thing is smaller compared to table (1.96).
2. The research results conclude that partially there is a significant effect of Product Quality (X2) on Loyalty (Y). The calculation on line coefficient indicates that the value of line coefficient between Product Quality (X2) and Loyalty (Y) is 0.162 with positive direction. It means the higher or the better the Product Quality (X2), the higher the Loyalty (Y) is. Viewed from the value of thing, the Product Quality (X2) variable of 2.779 is higher than table (1.96), since the value of thing (2.779) is higher compared to table (1.96).
3. Based on the test results it can be concluded that partially there is a significant effect of Service on Loyalty. The calculation on line coefficient reveals that the value of line coefficient between Service (X3) and Loyalty (Y) is 0.201 with positive direction. It means the higher or the better the Service (X3), the higher the Loyalty (Y) is. Viewed from the value of thing, the Service (X3) variable of 2.979 is higher than table (1.96), since the value of thing (2.979) is higher compared to table (1.96).
4. Based on the results of test it can be concluded that partially there is a significant effect of Corporate Image on Trust. The calculation on line coefficient revealed that the value of line coefficient between the Corporate Image (X1) and Trust (Z) is 0.155 with positive direction. It means the higher or the better the Corporate Image (X1), then the higher the Loyalty (Y) is. Viewed from the value of thing, the Corporate Image (X1) variable of 2.475 is higher than table (1.96), since the value of thing (2.475) is higher compared to table (1.96).
5. Based on the test results it can be concluded that partially there is a significant effect of Product Quality on Trust, which means that the higher Product Quality (X2) can improve the Trust (Z). That the value of line coefficient between Product Quality (X2) and Trust (Z) is 0.269 with positive direction. It means the higher or the better the Product Quality (X2) the higher the Trust (Z) is. The value of thing of the Product Quality (X2) variable of 4.253 is higher than table (1.96), since the value of thing (4.253) is higher compared to table (1.96).
6. Based on the test results it can be concluded that partially there is a significant influence of Service variable on Trust. The calculation result on line coefficient showed that the value of line coefficient between Service (X3) and Trust (Z) is 0.384 with positive direction. It means that the higher or the better the Service (X3) the higher the Trust (Z) is. The value of thing of Service (X3) variable is 5.453, higher than table (1.96).
7. Based on the test results it can be concluded that partially there is a significant effect of Trust on Loyalty. The calculation reveals that there is an effect of Trust (Z) on Loyalty (Y). From the calculation result on line coefficient it can be known that the value of line coefficient between Trust (Z) and Loyalty (Y) is 0.415 with positive direction. It means the higher or the better the Trust (Z) the higher the Loyalty (Y) is. The value of thing of Trust (Z) variable is 6.416, higher than table (1.96).
8. Based on such test results it can be concluded that simultaneously the Corporate Image (X1), Product Quality (X2), Service (X3) and Trust (Z) have influence on Loyalty (Z). The research results in a calculation that the value of F count is 121.183, because the value of F count (121.183) is higher than F table (2.395). Although the image variable partially has no effect on loyalty, but simultaneously or collectively with other variables such as product quality, service and trust, it will have a significant effect on loyalty.
Comparison of this Research Result and the Previous Research Results
Based on the results of this research and the previous one, the comparison can be made as follows:
1. This research results show that the corporate image variable has no significant influence on loyalty. It is not in line with the result of research conducted by Cengiz & Hasan (2007) in Turkey titled: Effect and Image and advertising efficiency on customer loyalty and antecedents of loyalty, Turkies Bank Sample, which showed that the image of bank customers had significant effect on bank customers’ loyalty. Similarly, the results of research conducted by Brunner, Markus & Klaus (2008) titled Satisfaction, Image and Loyalty: New versus experienced customers in 2008 on train passengers in Switzerland showed that the train passengers’ image partially had a significant effect on loyalty. In any insurance company it is very possible if the corporate image has no effect on customers’ loyalty, since the customers consider more on the service, facility and speed in handling the insurance claim.
2. This research results show that the product quality significantly affects the customers’ loyalty. It is in line with the result of research conducted by Ayidin & Gokhan (2005) in Turkey in 2005, titled The Analysis of Antecedents of Customer loyalty and the Turkies mobile telecommunication market, that the quality of HP products had an effect on the loyalty of HP users in Turkey. Other researchers namely Kaili, Yu Ching Chiao & Ya kang Chiu in 2007 in Taiwan, produced a research titled Understanding the Antecedents to customers loyalty by Applying Structural Equation Model(SEM), which results showed that the quality of cars in Taiwan would affect the loyalty of car owners. It shows that the research results confirm the results of the previous one that product quality has a significant effect on loyalty.
3. The results of this research show that service has a significant effect on customers’ loyalty. It is in line with that of Ayidin & Gokhan (2005) in Turkey, titled The Analysis of Antecedents of Customer loyalty and the Turkies mobile telecommunication market which result indicated that the service had an effect on the loyalty of HP users in Turkey. A research conducted by Macaulay and Sarah Cook in 2007 titled How to improve your customer in Department Store generated a review that the service had a significant effect on loyalty. It shows that this research results confirm that of the previous one that service has a significant effect on loyalty.
4. The results of this research show that the corporate image has a significant effect on trust. It is in line with that of the previous one conducted by Mawarto titled Influence of University Image, Service Quality, Tuition Fee and Trust on Students’ Loyalty (survey at Economy Science College in province of DKI Jakarta) in 2014 showing that the image directly affects the trust. It shows that the research results confirm that of the previous one that the corporate image has a significant effect on trust.
5. The results of this research show that product quality affects significantly the trust. It is in line with that conducted by Mawarto titled Influence of University Image, Service Quality, Tuition Fee and Trust on Students’ Loyalty (survey at Economy Science College in province of DKI Jakarta) in 2014 showing that the quality directly affects the trust. It shows that the research results confirm that of the one that the product quality has a significant effect on trust.
6. From the test results it can be concluded that partially there is significant effect of Service variable on Trust. It is in line with that conducted by Mawarto titled Inng that the quality directly affects the trust. It shows that this research results confirm that of the previous one that the service has a significant effect on trust.
7. The results of this research show that the trust has a significant effect on loyalty. It is in line with the result of research conducted by Nelson Oly Ndubisi in 2007 in Malaysia titled Relationship marketing and customer loyalty “Marketing Intelligent and Planning”, stating that a bank customer’s trust in Malaysia had an effect on the loyalty of bank customers. Other researchers named Casalo, Carlos & Miguel (2007) conducted a research titled the impact of participation in virtual brand communities’ trust and loyalty stating that the trust of software users had an effect on the loyalty of software users. It shows that the results of this research confirm that of the previous one that trust has a significant effect on loyalty.
Conclusion and Suggestion
Conclusion
Based on the analysis and review as well as discussions already described, this research results are concluded as follows:
1. Partially the corporate image does not affect the loyalty, but product quality and service do.
2. The corporate image, product quality and service partially have significant effect on the life insurance policy holders’ trust.
3. The Corporate Image, Product Quality and Service simultaneously have an effect of 48.5% on trust, while the remaining 51.5% is affected by other variables other than those independent variables. Viewed from the value of line coefficient, the most dominant variables that sequentially affect the Trust are Service, then Product Quality and Corporate Image.
4. The Corporate Image, Product Quality, Service and Trust give a simultaneous influence of 55.1% to Loyalty, while the remaining 44.9% are affected by variables other than those 4 independent ones. Viewed from its line coefficient value, the most dominant variables that sequentially affect the Loyalty are Trust, then Product Quality and Corporate Image.
Suggestion
Based on the above mentioned analysis and review as well as discussions, it is suggested that:
1. The academicians who will conduct a research on life insurance policy holders should be able to add and or replace their research variables to give the better meaning and definition for the science in general and the life insurance knowledge in particular.
2. It is necessary for the practitioners in life insurance sector to understand well that the life insurance companies are those engaged in non-banking financial services, therefore being the matters pertaining to the speed of excellent service, which means the best service must be provided for the customers before they become the policy holders and at the time they are already policy holders.
3. The practitioners in life insurance sector are obliged to communicate to the policy holders regarding the policy holders’ rights and obligations as contained in the general and the specific terms of the policy.
4. Create the policy holders’ loyalty by improving the company’s image, service and trust of the policy holders to the life insurance products, since it is the policy holders’ loyalty that will make a life insurance company bigger, advanced and developed in the future.
5. Exercise the policy holders’ rights quickly, correctly and accurately and the policy holders receive their rights intact.
6. It is necessary for the life insurance practitioners to design an anti-lapse life insurance product so their insurance policy will remain in force throughout the insurance contract term.
7. It is necessary for life insurance sector practitioners to design a multipurpose product which has the elements of risk transfer, investment, hospital cost and the customers will live a happy and prosperous pension life.
References
- Akbar, M.M. & Noorjahan, P. (2009). Impact service quality: Trust and customer satisfaction engender customer loyalty. ABAC Journal, 29(1), 24-38.
- Armira, A., Armira, E., Drosos, D., Skordoulis, M. & Chalikias, M. (2016). Determinants of consumers’ behaviour toward alcohol drinks: The case of Greek millennial. International Journal of Electronic Customer Relationship Management, 10(1), 14-27.
- Ayidin, S. & Gokhan, O. (2005). Tof antecedent of customer loyalty in the Turkish mobile telecommunication market. European Journal of Marketing, 39(7/8).
- Ball, D., Pedro, S.C. & Masnuel, J.V. (2006). Service personalization and loyalty. Journal of Service Marketing, 20(6), 391-393.
- Barney, J.B. (2010). Strategic management and competitive advantage. Printice Hall, One Lake Street: Upper Saddle River, New Jersey.
- Brunner, T.A., Markus, S. & Klaus, O. (2008). Satisfaction image and loyalty: New versus experienced customers. European Journal of Marketing, 42(9/10), 1095-1105.
- Casalo, L., Carlos, F. & Miguel, G. (2007). The impact of participation in virtual bran communities on consumer trust and loyalty: The case of free software. Online Information Review, 31(6), 775-792.
- Cengiz, C., Hasan, A. & Bunyamin, E. (2007). Effect of image and advertising efficiency on customer loyalty and antecedents of trust: Turkies Bank Sample. Banks and Systems, 2(1).
- Chalikias, M., Drosos, D., Skordoulis, M. & Tsotsolas, N. (2016). Determinants of customer satisfaction in healthcare industry: The case of the Hellenic red cross. International Journal of Electronic Marketing and Retailing, 7(4), 311-321.
- Dowling, G.R. (1993). Developing your company image into a corporate asset. Long Range Planning, 26(2), 101-109.
- Drosos, D., Skordoulis, M., Chalikias, M., Kalantonis, P. & Papagrigoriou, A. (2017). The impact of ISO 9001 quality management system implementation in tourism SMEs. Springer Proceedings of Business and Economics: Proceedings of the 3rd International Conference IACUDIT, Tourism, Culture and Heritage in a Smart Economy: Switzerland: Springer International Publishing, 145-157.
- Drosos, D., Tsotsolas, N., Chalikias, M., Skordoulis, M. & Koniordos, M. (2015). Evaluating customer satisfaction: The case of the mobile telephony industry in Greece. Communications in Computer and Information Science: Proceedings of Creativity in Intelligent Technologies & Data Science Conference: Switzerland: Springer International Publishing, 249-267.
- Flavian, C., Miguel, G. & Eduardo, T. (2005). The influence of corporate image on consumer trust: A Comparative analysis in traditional versus internet banking. International Research, 15(4), 447-470.
- Fornell, C. (1992). A national customer satisfaction barometer: The Swedish experience. The Journal of Marketing, 6-21.
- Harriet, E.J. (2005). Principles of insurance: Life, health and annuities. LOMA, Printed in the USA.
- Kaplan, R.S. & Norton, D.P. (2004). Strategy maps: Converting intangible assets into tangible outcomes. Boston: Harvard Business School Press.
- Kartonegoro, S. (2006). Manajemen risiko dan asuransi. Penerbit Gunung Agung: Jakarta.
- Kotler, P. & Gary, A. (2010). Marketing management. International Edition: New Jersey Prentice Hall.
- Mawarto. (2014). The effect of higher image, service quality, educational price and trust on student’s loyalty. Survey at economic higher education institution in Jakarta province: Jakarta.
- Parasuraman, A., Zeithaml, V.A. & Berry, L.L. (1985). A conceptual model of service quality and its implications for future research. The Journal of Marketing, 41-50.
- Porter, M.E. (1985). Competitive advantage: Creating and sustaining superior performance. The Free Press: NY.
- Rouva, E., Lalou, P., Skordoulis, M. & Chalikias, M. (2016). Viral marketing analysis and evaluation: The case of the Greek consumer market. International Journal of Electronic Customer Relationship Management, 10(1), 28-38.
- Rust, R.T. & Zahorik, A.J. (1993). Customer satisfaction, customer retention and market share. Journal of Retailing, 69(2), 193-215.
- Skordoulis, M. & Pekka-Economou, V. (2015). Analysis of the factors affecting customers' satisfaction from the Greek banks. Proceedings of eRA-10 International Scientific Conference: Economy I Session, 32-40.
- Skordoulis, M., Alasonas, P. & Pekka-Economou, V. (2017). E-government services quality and citizens satisfaction: A multicriteria satisfaction analysis of taxis net information system in Greece. International Journal of Productivity and Quality Management, 22(1), 82-100.
- Yu, Y.T. & Alison, D. (2001). The contribution of emotional satisfaction to customer loyalty. International Journal of Service Industry Management, 12(3), 234-250.
- Zeithaml, V.A., Parasuraman, A. & Leonard, L.B. (2001). Delivering quality service: Balancing customer perceptions and expectation. New York: The Free Press.
- Zikmund, W. (2003). Business research methods. Mason, Ohio: Thomson-South-western Press.