Research Article: 2020 Vol: 19 Issue: 4
Impact of Leverage: The Risks to the Listed Industrial Joint Stock Companies in Jordan Stock Exchange
Yaser Mohd Hamshari, Petra University
Mohammad Ahmad Alqam, Petra University
Haitham Yousef Ali, Petra University
Abstract
This study aims to identify the impact of leverage and its risks to the listed Industrial joint stock companies in Amman Stock Exchange. Through studying the rate of Return on equity, assets, and sales, in addition to the market value of the companies, to determine which is more affected by the leverage. Knowing that, the study population represents some of the listed joint-stock companies of the industrial sector in Amman Stock Exchange for the period during 2015-2018. Hence, the study has concluded to the need of achieving a balance between the internal and external financing sources and investing the available funds so competently. So once the administration desires to obtain new financing, it should maintain its financial structure balance. The higher debt ratio means a higher expected return and greater risk as well. Therefore, choosing the most appropriate debt ratios depends on the preference relationship between the risk and the return.
The study found that the risk degree increasingly grows along with the use of the company for the financial leverage, which means the increase of the debts will lead to an increase in the company financial and overall risks. Also, if the financial leverage is not used, the rate of return on assets will equal the rate of Return on equity.
Keywords
Financial Leverage, Rate of Return on Equity, Rate of Return on Assets, Market Value.
Introduction
With the aim of improving the profit, it comes out that borrowing at a relatively low fixed cost for the purpose of operating the borrowed money is the best choice. Whereas, to achieve a better return from the borrowing cost and the financial leverage means buying the assets from the borrowed funds or issuing preferred shares. This is to say, the company’s attempt to achieve a greater return than the borrowing cost, consequently, the financial leverage affects the return and risk.
This measure enlarges the ratio of debt in the capital structure (i.e. an increase in the financing risk), and thereby an increase in the overall risk. Therefore, shareholders expect higher returns of the partly financed assets from debts, since debts into the capital structure increase the overall risk. Subsequently, the available profits and the rate of Return on equity for the shareholders become more volatile (Al-Khalayleh, 2013).
The financial leverage accomplishes the following advantages:
1. Improve the return on shareholders’ equity, when the leverage is positive.
2. Maintain the control for the old owners, since the lenders are unheard by the administration.
3. Benefit from taxes savings, as interest is subject to reduction.
Cones of the financial leverage when the return on assets is less than the cost of borrowing are as follows:
1) Low return on shareholders' equity.
2) Lenders intervention potentiality.
3) Delayed debts payment which may offend the company's reputation and limit its borrowing options.
The Importance of the Study
Definitely the financial leverage is a two-edged sword. If the assets rate of return falls below the cost of capital (and this is possible to happen) then the rate of return on common shareholders' equity is less than it. Thus, reflect the resulting risk from including debts into the capital structure (Al-Khalayleh, 2013).
Which is why the financial leverage must be studied carefully according to the economic conditions; whether its recovery or deflation. In detail, during the recovery condition sales increase, and thus the financing through debts increase the profit. While, during the deflation conditions, the debt financing increases the loss.
Therefore, we seek through this study, to focus on the need to pay attention to positive financial leverage aiming to protect companies from the impact of debts cost and financial leverage on the market value of listed joint stock companies on Amman Stock Exchange.
Study Objectives
1) Knowing the extent to which industrial joint-stock companies in Jordan rely on borrowing or property financing.
2) Helping lenders estimate the volume of demand on their fund from the beneficiary companies through changes in the capital structure.
3) The impact of the financial leverage differences on the financial performance of joint-stock companies in the industrial sector.
4) The impact of the financial leverage on the market value of listed industrial joint-stock companies on Amman Stock Exchange.
Study Limitations
1) This study is confined to Jordanian industrial joint-stock companies in the industrial sector for the period during 2015-2018.
2) The financial statements extracted from the financial reports for the period 2015-2018 were used.
Study Problem
1) Is there a financial leverage impact on the financial performance of the listed industrial joint stock companies on the Amman Stock Exchange? in accordance with the financial indicators; return on assets, equity and sales.
2) Is there a financial leverage impact on the market value of the listed industrial joint stock companies on the Amman Stock Exchange?
Study Hypotheses
First main hypothesis
There is no statistically significant effect of financial leverage on the annual returns of the listed industrial joint-stock companies on Amman Stock Exchange, according to the following indicators:
1) Return on assets
2) Return on equity
3) Return on sales
The sub-hypotheses of the main hypothesis are formed as follow
A. There is no statistically significant effect of financial leverage on the return on assets of industrial companies listed on Amman Stock Exchange.
B. There is no statistically significant effect of financial leverage on the Return on equity of industrial companies listed on Amman Stock Exchange.
C. There is no statistically significant effect of financial leverage on the return on sales of industrial companies listed on Amman Stock Exchange.
Second main hypothesis
There is no statistically significant effect of financial leverage on the market value of the listed industrial joint-stock companies on Amman Stock Exchange using the Tobin’s q form
Study Variables
1) Financial leverage
It is defined as the percentage of change that occurs in the return of the common share due to a change in a certain percentage in operating profit before interest and tax. Also, the increase in the degree of financial leverage increases the degree of financial risk to the common shareholders. Accordingly, the higher the relative weight of debt and preferred shares in the capital structure, the higher the degree of leverage (Matar, 2016).

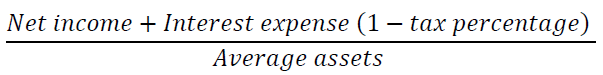
2) Return on assets
Measures the ability of each Dinar of the company's assets to generate net profit. This scale is used to assess the ability and success of the administration to manage the company operations and activities. It is preferred to calculate it through the following formula:
Or by analyzing its components = Adjusted net income margin ratio X Asset turnover ratio
3) Return on equity
Measures the ability of each dinar from common property funds to reach a net profit. It can be calculated through the following formula:

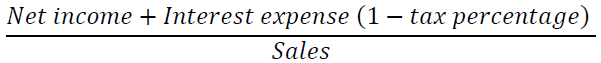
4) Return on sales
Measures the company's ability to generate profits from its sales, and the following formula can be used
5) The company market value
It measures the value of the company as an operating project, whether it is higher than the cost of the assets to get its required cash flows. The used form is Tobin’s q
Where, Q = The company's market value - The replacement value of the assets. Considering the difficulty of measuring the replacement value of companies, the historical value of the assets was used instead. It should be noted that the adjusted Tobin’s q model was used.
Q = The company's market value - Total assets book value
The market value = The number of shares at the end of the year X closing prices
Theoretical Framework of the Study
Elewi (2019) study indicated that companies should pay attention to increasing financial leverage in order to improve their financial performance and return on assets and equity. The study also found that there is no relation between financial leverage and return on assets. Also, research must be sought on factors that affect the return on assets such as solvency. Moreover, the study suggested raising the interest in company’s financial leverage due to make up the shortfall of the required liquidity for operation. Thus, not only because of short and medium-term obligations, but in order to keep the wealth in the hands of owners. Which reduces external financing, namely acquire assets as well as increase investment and sales.
On the other hand, Kokesh (2019) recommended that companies' departments investigate the factors which have an impact on the risks of industrial companies such as financial solvency. Which has a role in achieving the company’s returns in a way that leads to generating profits and reducing the risks faced by the industrial companies? The industrial companies' departments should study and evaluate the financing structure at the time of specify the financial leverage, with a view to reaching the best optimal ratio for the financial leverage. Thus, in order to balance the returns to be pursued with the potential risks in a way that ensures the positive impact of the financial leverage on these companies returns.
However, Al-Ali (2018) study concluded that there is a relationship in companies between the financial leverage and profitability. Whereby, the relationship positively affects the profitability of the companies. The study recommended that decision-making is the role of the companies' administration, especially, decisions related to the financial leverage; counterbalance the financial leverage and its impact on profitability and liquidity and dependence, as well as dependence on funds through equity and get off funds through loans.
In addition to this, the study of Sufyan (2018) tackled the cost of the company's funding sources. Which was mainly limited to the cost of both equity financing and debt financing, clearly, these elements are significant in the financing decision-making processes, as it represents the minimum acceptable return on investment. And as long as it affects the value of the company and its shares price in the market through the inverse relationship between therein. Whereas, whenever the cost of funds decreases, means that there is a positive impact on the company value and its shares market value. Undoubtedly, there are a variety of company's sources of financing; including property financing, which involved self-financing, embodied in retained earnings and amortization. Likewise, equity financing, whether by debt financing or bond loans. Debt financing mainly embodied in all the financing sources that the company obtains from external parties, these sources are bank loans, beside rental and commercial credit.
Further, Khanfar (2017) study pointed out that companies with high liquidity invoke to internal financing, thereby, its first resource is the retained earnings. Hence, companies with fixed asset ratios can increase the financial leverage because these assets are provided as debts guaranties.
The study of Sumayah (2017) found that the leverage estimated ratio of total debts on private capital funds affects the overall profitability, so the administration of small and medium companies must work in a balanced manner on the financial leverage. In other words, borrowing mustn't be the choice in this case, apart from this, programs and plans elaborated by the administration must be compliance to it. Aimed at get rid of idle assets in order to achieve satisfactory results and returns exceed the cost of borrowing.
While, Hajer (2016), discussed the problems facing companies' financing structure, and for the purpose of minimizing these problems many companies list their shares in stock exchange. Even though, this investment process requires detailed and in-depth study of the shares that will be invested. Inasmuch as the recent goal of financial management is to maximize the value of the company, but this can only be achieved by optimizing the use of financial resources, especially these related to external funds in the form of the company granted loans. Therefore, most studies in the financial management indicated that the decision to rely on debt in the financial process by maximizing profits increases shareholders ’profits whenever the leverage increases. The study concluded that financial leverage enables the company to build the needed reputation in the stock exchange. Moreover, the companies’ administration must take into consideration while the process of making decisions about the financial structure, balancing between the financial leverage and its impact on the earnings per share, as well as on the risks facing the company due to its financial structure.
Finally, Al-Barakat (2015) study, conducted on Jordanian industrial companies, the study concluded that Jordanian industrial companies did not use financial leverage. Subsequently, the degree of financing depends on the property’s funds, so there was no effect of the financial leverage, which led to the stability of the financial leverage ratio, as a result of not financing its assets with others funds. This indicates how companies are cautious in order to avoid financial risk. The study further indicated how the operational leverage is affected by the internal factors, which are related to the sector work field. That is to say, the operational leverage risks are due to the demand for products, technological development and the price fixing, which are related to economic conditions, it is called business risks. Hence, the study recommended the necessity of digging up for new investment opportunities in the industrial sector and making the best use of the financial leverage, where it was found that most industrial companies did not use the debt in their financing structure with a rate not exceeding 12.5%, and this indicates failure to utilize benefit from financial leverage and increase the trial to move away from the financial risks, this is largely due to lack of good planning by the administration on how to deal with the financial leverage.
Theoretical Framework
Financial leverage
The financial leverage or equity financing defined as debts saving into the company's financial structure, that is, financing part of the assets through loans or preferred shares that charge fixed returns, although preferred shares aren't considered as debts to others and listed in the budget among shareholders', but as a part of the received capital's fixed returns. Therefore, financing through preferred shares is regarded as a form of financial leverage (Al-Khalayleh, 2013).
Financial leverage depends on the relationship between the rate of the return on assets and the cost of the borrowed capital. So, if the return on assets is greater than the cost of borrowed money, then the effect of financial leverage is positive. But if the return on assets is less than the cost of borrowed money, then the effect of financial leverage is considered negative.
Leverage counts on income generation, the rate of return on assets and the cost of borrowing.
Leverage scale
Financial leverage is measured by the degree of relative change in the return on the share or on the capital associated with a specific change in income before interest and tax.

The following formula can be applied in the event of a change in the profit before interest and tax.

In the case of preferred shares, the following formula can be used.

It is important to realize that examining the financial leverage enables us to acknowledge the extent to which borrowed funds can be used at a fixed interest rate in an investment opportunities provide profit at a higher interest rate than the paid interest. Accordingly, the difference represents a profit for the owners. Therefore, the financial leverage achieves returns which may be higher than, equal or less than the cost of borrowing, it can be classified as follows:
1) Positive financial leverage: - The return on fund is greater than the cost of borrowed money, and thus an increase in the rate of return on equity and the rate of return on assets.
2) Average financial leverage: - The return on money is equal to the cost of borrowed money, and hence the rate of return on equity and the rate of return on assets remain fixed.
3) Negative or reverse leverage: - The return on fund is less than the cost of borrowed fund, and therefore decreases the rate of Return on equity and on assets.
Financial risk measurements (Funding)
Funding risk increases only if debts ratio increases in the capital structure, the following are the most significant measures
1) Debt to assets ratio: Debt includes current and non-current liabilities. A direct relationship between the debt-to-asset ratio and the level of risk.
2) Long-term debt to assets ratio: This measure is considered to be with high financing risk in which current liabilities are excluded.
3) Debt to equity ratio: Debts include current and non-current liabilities to equity, beside the capital of the common shares, the additional capital, and the retained earnings, since the funding risk increases when the debt to equity increases.
Return on equity rate
Reflects the operational and financial activities, thus it is affected by the financial leverage, the size of debts in the capital structure, and the rate of return on assets. Additionally, it reflects the return on fund owners compared with their risks.
Return on equity depends on the following elements:
1) The rate of return on assets
2) The cost of borrowed capital
3) Ratio of debt to equity of the common shareholders
Whereas the relationship between the rate of Return on equity of common shareholders and the cost of borrowed capital is inverse, however, its relationship to the rate of return on assets is direct.
In the event that the rate of return on assets is higher than the cost of the borrowed capital, then the ratio of the expected debts to the rate of return on equity. This can be proven (Table 1) through assuming that the average of assets=600, while the profit before tax=90, when the tax rate = 40%, beside the interest rate on borrowing=12%, Also, in the first case the debt rate is zero, while in the second case the debt rate=50% and the third case the debt rate=75%.
| Table 1 Rate of Return on Assets | |||
| Statement | Case ( 1) | Case ( 2) | Case ( 3) |
| Equity | 600 | 300 | 150 |
| Debts | Zero | 300 | 450 |
| Profits before interests and taxes | 90 | 90 | 90 |
| Interests (12%) | 0 | 36 | 54 |
| Profit before taxes | 90 | 54 | 36 |
| Tax (40%) | 36 | 21.6 | 14.4 |
| Profit net after tax | 54 | 32.4 | 21.4 |
| ROA | 9% | 9% | 9% |
| ROCE | 9% | 10.80% | 14.40% |
The rate of return on assets
It measures the degree of the company's success in achieving the available profits regardless of the way in which these assets are funded. Given that the rate of return on assets is not affected by the change in the interest rate, nor does it differentiate between funding sources. Moreover, it doesn't reflect the effect of financial leverage. The following are the components of the rate of return on assets:
1) Net profit margin ratio = 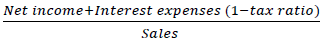 so if this percentage is low, then this means that there is an increase in administrative or selling costs, or that the selling prices aren't consistent with their costs.
2) Assets turnover = 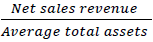 it implies the efficiency of the administration in the optimization utilization of its assets.
The rate of return on assets can be improved by:
1) Improve the profit margin ratio, through:
A) Increase the selling price of the product
B) Reducing the expenses
2) Increasing the asset turnover rate throughout: -
A) Reducing investments in assets, whilst maintaining the same sales level
B) Improving sales volume
The relationship between the company's assets value and its sales, called capital intensity, and its ratio =  Thus, the higher the capital intensity, the greater the need for external funding, since the higher this percentage means that slight growth in sales requires a large investment in assets (Matar, 2016).
Return on sales
It’s an indication of an upturn in profitability, measures the ability of each sales dinar to achieve profits, too. Hence, the financial leverage negatively affects the return on sales, but according to the economic conditions. Provided that the higher the expected rate of growth, the greater the need for more fund to finance this growth.
With this in mind, financial leverage maximizes profits and losses to shareholders depends on the economic situation. So, if it is a revival economic situation, then sales increases, and subsequently profit increases. In contrast, if the economic situation is in recession, sales will decline and thus the borrowed capital will increase the loss.
Accordingly, if the sales level is less than break-even point, then the company goes for fund within equity because it achieves earnings per share higher than borrowed Capital. Even though, if the sales level is greater than the break-even point, it is preferable to borrow the capital since it achieves higher earnings per share (Alqam, 2018). The Figure 1 shows the aforementioned method, as to pursuit the break-even point.

Figure 1 Break-Even Point
Market value
Companies are in need for fund during exercise their economic activity, in order to finance their new investments. With this, the administration is required to balance the available funding sources, the cost of each source, and the consequences thereof. For this reason, the administration is obliged to compare and counterbalance the cost and the return. Therefore, Companies are in need for fund during exercise their economic activity, in order to finance their new investments. With this, the administration is required to balance the available funding sources, the cost of each source, and the consequences thereof. For this reason, the administration is obliged to compare and counterbalance the cost and the return. Therefore,
What matters to the company's administration is achieving the optimal capital structure, whereas any company financial structure is a mixture of preferred shares, common shares and loans (debt). In a nutshell, when the administration aims at obtaining new funding for the purpose of maintaining the balance of its financial structure. In so far as to maintain the marginal cost of the capital or the cost of the additional One Dinar of the capital, fixed as long as the mix rate is fixed.
Research Methodology
Wherein qualitative analysis was used, through the study of 40 listed industrial joint stock companies on Amman Stock Exchange, for the period between 2015 to 2018. The effect of the financial leverage on the return on assets, return on shareholders, return on sales and the market value was examined.
All things considered from the previous Tables 2 & 3 that the financial leverage negatively affects the return on equity and the market value, where the Pearson correlation coefficient reached -0.019 and -0.057 respectively. While it positively affects both the return on assets and the return on sales, where the Pearson correlation coefficient reached 0.038 And 0.001, but it is worth noting that these figures have no statistically significant.
| Table 2 Arithmetic Mean of Study Variables | ||
| Variable | Ratings No. | Arithmetic mean |
| ROA | 40 | 4.408 - |
| ROE | 40 | 49.779 |
| ROS | 40 | 109.332 |
| Company market value (Q) | 40 | 0.649 |
| Financial leverage (2018) | 40 | 1.035 |
| Table 3 Pearson Correlation Coefficient | |||||
| ROA | ROE | ROS | Q | FL | |
| ROA | 1 | ||||
| ROE | -0.161 | 1 | |||
| ROS | 0.262 | -0.021 | 1 | ||
| Market value | 0.020 | 0.091 - | -0.056 | 1 | |
| Financial leverage | 0.038 | 0.019 - | 0.001 | -0.057 | 1 |
Table 4 obviously, shows the impact of financial leverage on the return on assets (ROA). However, this corresponds with variety results of previous studies, where the financial leverage is considered a long-term source of financing. Therefore, the impact is just clear on the subsequent years and not necessarily only for the current year. Noted that F value exceeded 7.236 and it has a statistically significant, which indicates the model significance with its entire variables.
| Table 4 The Impact of Financial Leverage on Return on Assets ROA | ||||||
| Financial Leverage | Coefficient β | t Value (Sig) | Coefficient of Determination R2 | F Value | Sig of F | Correlation Coefficient r |
| Fixed | 6.638 | 1.521 (0.137) |
0.453 | 7.236 | 0.000 | 0.673 |
| FL 2015 | -9.230 | -5.277** (0.000) |
||||
| FL 2016 | 0.017 | 1.016 (0.317) |
||||
| FL 2017 | -0.608 | -.713 (0.481) |
||||
| FL 2018 | -0.145 | -.062 (0.951) |
||||
Further, it’s noted that the coefficient of the determination value R2 exceeds 45.3%, and the correlation coefficient exceeds 67.3%. Then it is worth noting that the financial leverage has a negative impact during a period of a year and more on the return on assets. Accordingly, it can be said that the financial leverage has negative effects on the return on assets based on time dilation, and the following formula explained it.
ROA2018 = 6.638 – 9.230 FL2015 + 0.017 FL2016 – 0.608 FL2017 – 0.145 FL2018
Table 5 shows the impact of financial leverage on the return on equity (ROE). However, this corresponds with variety results of previous studies, where the financial leverage is considered a long-term source of financing. Therefore, the impact is just clear on the subsequent years and not necessarily only for the current year. Noted that F value exceeded 6,542 and it has a statistically significant, which indicates the model significance with its entire variables.
| Table 5 The Impact of Financial Leverage on Return On Equity | ||||||
| Financial Leverage | Coefficient β | t Value (Sig) | Coefficient of Determination R2 | F Value | Sig of F | Correlation Coefficient r |
| Fixed | 2.012 | 3.254 (0.015) |
0.568 | 6.542 | 0.000 | 0.726- |
| FL 2015 | -1.564 | -3.258** (0.001) |
||||
| FL 2016 | -0.675 | 4.597** (0.000) |
||||
| FL 2017 | -0.964 | -2.517* (0.035) |
||||
| FL 2018 | -0.356 | -3.045* (0.042) |
||||
Further, it’s noted that the coefficient of the determination value R2 exceeds 56.8%, and the negative correlation coefficient exceeds 72.6%. Then it is worth noting that the financial leverage has a negative impact during a period of a year and more on the return on equity. Accordingly, it can be said that the financial leverage has negative effects on the return on equity based on time dilation, and the following formula explained it.
ROE2018 = 61306 – 1.564 FL2015 - 0.675 FL2016 – 0.964 FL2017 – 0.356 FL2018
Table 6 shows the impact of financial leverage on the return on Sales (ROS). However, this corresponds with variety results of previous studies, where the financial leverage is considered a long-term source of financing. Therefore, the impact is just clear on the subsequent years and not necessarily only for the current year. Noted that F value exceeded 4,986 and it has a statistically significant, which indicates the model significance with its entire variables.
| Table 6 The Impact of Financial Leverage on Return on Sales ROS | ||||||
| Financial Leverage | Coefficient β | t Value (Sig) | Coefficient of Determination R2 | F Value | Sig of F | Correlation Coefficient r |
| Fixed | 3.258 | 1.256 (0.466) |
0.568 | 4.986 | 0.000 | 0.691- |
| FL 2015 | -0.456 | -4.566* (0.032) |
||||
| FL 2016 | -0.254 | 5.258* (0.021) |
||||
| FL 2017 | -0.358 | -3.588* (0.035) |
||||
| FL 2018 | -0.458 | -5.698* (0.042) |
||||
Further, it’s noted that the coefficient of the determination value R2 exceeds 65.8%, and the negative correlation coefficient exceeds -69.1%. Then it is worth noting that the financial leverage has a negative impact during all the years on the return on sales. Accordingly, it can be said that the financial leverage has negative effects on the return on sales based on time dilation, and the following formula explained it.
ROE2018 = 01650 – 0.456 FL2015 - 0.254 FL2016 – 0.358 FL2017 – 0.458 FL2018
Table 7 shows the impact of financial leverage on the return on market value (Q). However, this corresponds with variety results of previous studies, where the financial leverage is considered a long-term source of financing. Therefore, the impact is just clear on the subsequent years and not necessarily only for the current year. Noted that F value exceeded 5,963 and it has a statistically significant, which indicates the model significance with its entire variables.
| Table 7 The Impact of Financial Leverage on Return on Market Value Q | ||||||
| Financial Leverage | Coefficient β | t Value (Sig) | Coefficient of Determination R2 | F Value | Sig of F | Correlation Coefficient r |
| Fixed | 4.587 | 0.986 (0.652) |
0.712 | 5.963 | 0.000 | 0.731- |
| FL 2015 | -0. 741 | -3.412* (0.045) |
||||
| FL 2016 | -0. 357 | 4.258* (0.034) |
||||
| FL 2017 | -0.412 | -5.254* (0.022) |
||||
| FL 2018 | -0.562 | -4.635* (0.039) |
||||
Further, it’s noted that the coefficient of the determination value R2 exceeds 71.2%, and the negative correlation coefficient exceeds -73.1%. Then it is worth noting that the financial leverage has a negative impact during all the years the return on market value. Accordingly, it can be said that the financial leverage has negative effects on the return on market value based on time dilation, and the following formula explained it.
ROE2018 = 4.587 – 0.741 FL2015 - 0.357 FL2016 – 0.412 FL2017 – 0.562 FL2018
Results
1) We conclude from this current study the direct relationship between the rate of return on common shareholders on assets, when the financial leverage is positive. Namely, in case the borrowed fund cost (rate of debts interest) is less than the return on assets.
2) Markedly, if the financial leverage is negative, basically saying, the cost of the capital is higher than the rate of return on assets, it would result in an increase in the debt to equity ratio, which shall reduce the return on equity.
3) The financial leverage strongly depends on the economic situation. Hence, sales increase in the economic recovery situation, and thus borrowed capital increases the profit. While, in the case of economic deflation, sales decrease. In this sense the loss increases because of the borrowed capital.
4) With regard to the effect of the financial leverage on the market value, the effect is negative therein, see Table 6
Recommendations
1) It is necessary for the joint-stock industrial companies to investigate the financing structure, in order to reach the optimum percentage of positive financial leverage, since it has a positive impact on financial performance.
2) The significance of choosing the best financing method, whether by debt or by equity, the administration plays the most important role. To clarify, if the administration is conservative, it will choose the equity financing with less risk, and in a result the expected earnings per share will be less. In contrast, if the administration accepts the risk, it will choose the debt financing, where the expected profit will be greater, beside the risk which will also be greater.
3) The administration should make optimal use of its available resources, in addition to the optimization utilization of its available financing, whether by debt or equity, aiming to achieve high revenues that cover the cost of borrowing.
4) The administration should be mindful to the economic situation, because of two reasons, firstly, the impact of the economic situation on the financial leverage and secondly, the way it chooses the most appropriate method of financing.
5) The government role, should take into account the economic situation facing the country, in order to reduce the cost of borrowing on the industrial sector, through reducing the interest rates on loans for troubled companies.
References
- Al-Ali, A. (2018). The impact of financial leverage on liquidity & profitability- applied study on a sample listed in damascus stock exchange. Retrieved from https://www.shamra.net/uploads/documents/document_aee4a755513989fc45ab1a216b3b6353.pdf
- Al-Barakat, I. (2015). The impact of financial & operational leverage on the returns & risks in jordanian industrial companies. Unpublished doctoral dissertation, Al-Balqa’a Applied University. Retrieved from https://www.researchgate.net/publication/283901767_athr_alrf_almaly_waltshghyly_ly_alayd_walmkhatrt_fy_alshrkat_alsnayt_alardnyt
- Alqam, M. (2018). Financial statement analysis for the purpose of making- decisions and performance evaluation.
- Al-Khalayleh, M. (2013). Financial statement analysis- sixth edition. Dar Wael for Publishing, Amman- Jordan
- Elewi, N. (2019). The impact of financial leverage on the financial performance in public joint-stock in amman stock exchange. Unpublished doctoral dissertation, Middle East University, Jordan. Retrieved from https://meu.edu.jo/libraryTheses/5ca89ec74625f_1.pdf
- Hajer, M. (2016). Measuring the leverage impact of return on equity, case study: Qatar stock exchange for the period (2010- 2015).
- Khanfar, D. (2017), Limitations Listed Companies in Palestine Stock Exchange Capital, Applied Study for the Period (2005-2014). Retrieved from https://www.mobt3ath.com/uplode/book/book-17997.pdf
- Kokesh, T. (2019). The role of financial leverage in determining the returns & risks in industrial companies listed on Amman stock exchange. Retrieved from https://www.asu.edu.jo/en/Economics/thair_lion/Documents/%D8%AF%D9%88%D8%B1%20%D8%A7%
- Matar, M. (2016). Modern approaches in financial and credit analysis. Dar Wael for Publishing, Amman- Jordan
- Sufyan, D. (2018), The impact of financial decision limitations on the value of company’s leverage from an Islamic perspective: Sample from listed companies in the Malaysian stock exchange. Retrieved from https://www.univ-chlef.dz/RENAF/Articles_Renaf_N_19/Article_14.pdf
- Sumayah, M. (2017). The impact of the financial leverage on small & medium companies profitability, case study: Sayem establishment for wheat & flour. Unpublished doctoral dissertation, University of Oum El Bouaghi- Algeria.