Research Article: 2022 Vol: 21 Issue: 1
Impact of National Lock down on Smes-An Event Study Analysis
A. Antony Lourdesraj, Bharathidasan University
M. Babu, Bharathidasan University
J. Gayathri, Bharathidasan University
G. Indhumathi, Mother Teresa Women’s University
J. Sathya, Sri Sarada College for Women
Citation Information: Antony Lourdesraj, A., Babu, M., Gayathri, J., Indumathi, G., & Sathya, J. (2022). Impact of national lock down on SMES – an event study analysis. Academy of Strategic Management Journal, 21(S1), 1-8.
Abstract
COVID-19 pandemic has a far-reaching impact on businesses. SME sector central to functioning of Indian Economy also suffered from COVID-19. Event study methodology like mean Adjusted Returns Model, Market Adjusted Returns, Market Model and GARCH (1, 1) Model were used, for estimating the volatility in the stock return of SME sector. The study revealed that the national lockdown in India has huge impact on the SME sector, during the pandemic.
Keywords
AR, CAR, AAR, CAAR, Mean Adjusted Returns Model, Market Adjusted Returns, Market Model GARCH (1, 1) Model and SME.
Keywords
AR, CAR, AAR, CAAR, Mean Adjusted Returns Model, Market Adjusted Returns, Market Model GARCH (1, 1) Model and SME.
Introduction
According to the Ministry of MSME Sector it has grown very fast in the last 50 years in India and it contributes to the low-income groups, with less cost of capital. Babu et al. (2019) conducted a study on demonetisation during pre and post of the event, to measure price behaviour by using GARCH (1, 1) model. Indhumathi et al. (2019) conducted study using Treynor, Jensen’s and Sharpe measurement techniques to determine the price movement. Michelson et al. (2000) conducted an event study, using risk-adjusted returns to measure the company’s performance. Chen et al. (2007) conducted an event study during SARS outbreak in Taiwan’s tourism industry and found that several hotels experienced downturn in their stock prices and the CAAR was negative. Ataullah et al. (2011) conducted an event study, using the modified corrado test to observe the abnormal return. Gunasekaran & Selvam (2011) conducted an event study, by using market adjusted model, market model and t-test, to analyse CAR in their studies. Maitra & Dey, (2012) conducted an event study, using CAPM model, to determine impact of dividend announcement. Ahsan et al. (2014) conducted a study in six sectors in DSE, measuring the abnormal return on the announcement of bonus, using the event study methodology. Rosdiana (2020) conducted an event study, to measure the abnormal returns in property sector in Indonesia stock market, during the announcement of presidential candidate. Pandey et al. (2021) conducted an event study on COVID-19 outbreak in the international stock market. By analysing the literature review, research gap was found in the SME sector, particularly in the context national lock down in India.
Objectives of the Study
To determine the impact of national lockdown, using MAR, MKAR, MM and GARCH (1, 1) Model, on the SME sector in India.
NH01 There is no significant impact of national lockdown on the share prices of SME EMERGE Index listed sample companies.
Methodology
According to WHO, Chinese officials in Wuhan City, announced that the first human case of COVID-19 was identified, on 31 December 2019. The lockdown was announced in various countries at differing degrees to contain the spread of COVID -19 virus. This study tries to trace the impact of national lockdown on stock returns in India. The event study deals with the Prime Minister Narendra Modi announcing a national lockdown, for the next twentyone days, in his 8 pm address, on 24 March 2020. Since the announcement was made in the evening, after the trading hours of NSE India, 25 March 2020 was taken as the event date(T=0).
The NIFTY SME EMERGE Index was considered for the sample selection. Based on the weightage of companies included in the Index, data availability, trading on the event date, top three companies were selected, namely, Euro India Fresh Foods Ltd (EIFFL), Softtech Engineers Ltd (SOFTTECH) and Rajshree PolyPack Ltd (RPPL). The period of the study is presented below.

T-100 to T-16 →Estimation Window (100-15=85 days)
T-15 to T-1→Pre-Event Window =15 days
T=0→Event Date=1day (25 March 2020)
T+1 to T+15→Post-Event Window =15 days
T-15 to T +15→Window period=31 days (window of 1 → -1, 0, +1 = 3…window of 15→ -15, 0, +15 = 31).
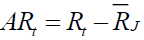
In the Mean adjusted returns Model (MAR)
 (1)
(1)
Where, ARt: Abnormal return on the given day,
Rt : Stock return on the given day and
 : Average return on the stock.
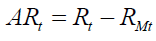
Similarly, Market adjusted returns Model (MKAR)
 (2)
(2)
Where RMt: Market return on the given day.
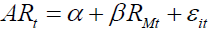
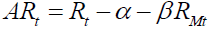
Likewise, Market Model (MM)
 (3)
(3)
α: intercept, β: slope and εit: error termand the Abnormal Return is
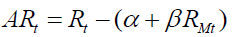
Further denoted as
Results and Discussion
Table 1 illustrates the abnormal return for the listed companies. EIFFL experienced significant impact on T-9, T-7 to T-4, T+2 and T+4. SOFTTECH reported significant impact on T+15. RPPL reported significant impact on T-4, T-2 to T+4, T+6 and T+13. By observing the result, the national lockdown did have impact on SME.
| Table 1 Results of Abnormal Return (AR) and T-Statistics | ||||||
| Day | EIFFL | SOFTTECH | RPPL | |||
| AR | t-STAT | AR | t-STAT | AR | t-STAT | |
| -15 | 0.006 | 0.32 | -0.048 | -1.27 | -0.001 | -0.025 |
| -14 | -0.037 | -1.904 | -0.001 | -0.016 | 0.043 | 1.056 |
| -13 | -0.017 | -0.85 | -0.043 | -1.133 | -0.041 | -1.006 |
| -12 | 0.014 | 0.741 | -0.052 | -1.357 | 0.002 | 0.055 |
| -11 | -0.029 | -1.505 | -0.037 | -0.968 | 0.005 | 0.114 |
| -10 | 0.002 | 0.084 | -0.062 | -1.623 | 0.02 | 0.5 |
| -9 | -0.061 | -3.124* | -0.029 | -0.762 | -0.017 | -0.425 |
| -8 | -0.001 | -0.026 | -0.044 | -1.171 | 0.018 | 0.45 |
| -7 | -0.094 | -4.813* | 0.007 | 0.174 | -0.028 | -0.692 |
| -6 | 0.048 | 2.454* | -0.05 | -1.312 | 0 | -0.005 |
| -5 | -0.195 | -9.980* | -0.044 | -1.154 | -0.051 | -1.268 |
| -4 | 0.044 | 2.254* | -0.058 | -1.531 | -0.085 | -2.109* |
| -3 | -0.016 | -0.807 | -0.009 | -0.235 | -0.046 | -1.145 |
| -2 | -0.018 | -0.911 | -0.044 | -1.153 | -0.087 | -2.157* |
| -1 | -0.031 | -1.56 | -0.055 | -1.46 | -0.081 | -2.002* |
| 0 | 0.005 | 0.25 | 0.05 | 1.321 | -0.091 | -2.235* |
| 1 | -0.031 | -1.592 | -0.026 | -0.687 | -0.089 | -2.184* |
| 2 | -0.046 | -2.331* | 0.031 | 0.819 | -0.102 | -2.512* |
| 3 | -0.026 | -1.316 | 0.031 | 0.821 | 0.11 | 2.718* |
| 4 | 0.09 | 4.574* | -0.052 | -1.362 | 0.099 | 2.446* |
| 5 | 0.002 | 0.102 | 0.045 | 1.178 | -0.001 | -0.029 |
| 6 | -0.018 | -0.944 | -0.027 | -0.699 | 0.081 | 2.002* |
| 7 | -0.013 | -0.648 | -0.029 | -0.772 | 0.003 | 0.067 |
| 8 | 0.005 | 0.235 | -0.039 | -1.027 | -0.005 | -0.114 |
| 9 | -0.015 | -0.75 | -0.026 | -0.672 | -0.075 | -1.862 |
| 10 | -0.003 | -0.143 | 0.041 | 1.079 | 0.007 | 0.18 |
| 11 | -0.017 | -0.869 | -0.043 | -1.138 | 0.036 | 0.901 |
| 12 | 0.004 | 0.216 | 0.038 | 1.01 | 0.03 | 0.733 |
| 13 | -0.027 | -1.384 | 0.017 | 0.437 | 0.089 | 2.197* |
| 14 | 0.008 | 0.419 | 0.021 | 0.547 | -0.035 | -0.853 |
| 15 | -0.022 | -1.108 | -0.078 | -2.047* | 0.051 | 1.26 |
2. Computed in MS-Excel 2019
Table 2 illustrates the cumulative abnormal return for the listed companies. EIFFL reported significant impact on window of 1to 3 and 5 to 15. SOFTTECH experienced significant impact on window of 6 to 15. RPPL recorded significant impact on window of 1 to 13. Compared to Table 1, negative CAR values during the pre and post period for all the three companies revealed that the national lock down, negatively affected SME during the pandemic period.
| Table 2 Result of Cumulative Abnormal Return (CAR) and T-Statistics for the Window Period | ||||||
| EIFFL | SOFTTECH | RPPL | ||||
| CAR | t-STAT | CAR | t-STAT | CAR | t-STAT | |
| 1 | -0.06 | -2.32* | -0.03 | -0.67 | -0.26 | -5.24* |
| 2 | -0.12 | -3.80* | -0.04 | -0.73 | -0.45 | -7.02* |
| 3 | -0.16 | -4.32* | -0.02 | -0.31 | -0.39 | -5.09* |
| 4 | -0.03 | -0.66 | -0.13 | -1.63 | -0.37 | -4.33* |
| 5 | -0.22 | -4.72* | -0.13 | -1.46 | -0.42 | -4.47* |
| 6 | -0.19 | -3.76* | -0.21 | -2.13* | -0.34 | -3.33* |
| 7 | -0.3 | -5.45* | -0.23 | -2.20* | -0.37 | -3.33* |
| 8 | -0.29 | -5.05* | -0.31 | -2.82* | -0.36 | -3.01* |
| 9 | -0.37 | -6.01* | -0.37 | -3.13* | -0.45 | -3.59* |
| 10 | -0.37 | -5.73* | -0.39 | -3.15* | -0.42 | -3.20* |
| 11 | -0.42 | -6.16* | -0.47 | -3.63* | -0.38 | -2.76* |
| 12 | -0.4 | -5.65* | -0.48 | -3.58* | -0.35 | -2.43* |
| 13 | -0.44 | -6.03* | -0.51 | -3.63* | -0.3 | -2.01* |
| 14 | -0.47 | -6.20* | -0.49 | -3.36* | -0.29 | -1.89 |
| 15 | -0.49 | -6.19* | -0.61 | -4.09* | -0.24 | -1.51 |
Table 3 illustrates the CAR for all the models. EIFFL recorded positive response on T-15 day but it was negative for the remaining period, under all the models. SOFTTECH recorded negative return during the entire study period. RPPL reported negative returns during T-4 to T+15 days. By comparing the results, under all the models for the selected companies, it clearly revealed negative impact in the stock return and negative cumulative abnormal return during the study period. Only a few event days were in the positive zone.
| Table 3 Results of Car for MAR, MKAR and MM | ||||||
| Day | MAR | MKAR | MM | |||
| AAR | CARR | AAR | CARR | AAR | CARR | |
| -15 | -0.014 | -0.014 | -0.017 | -0.017 | -0.014 | -0.014 |
| -14 | 0.003 | -0.011 | 0.005 | -0.012 | 0.002 | -0.013 |
| -13 | -0.033 | -0.043 | -0.035 | -0.047 | -0.033 | -0.046 |
| -12 | -0.01 | -0.054 | -0.009 | -0.056 | -0.012 | -0.058 |
| -11 | -0.019 | -0.072 | -0.018 | -0.074 | -0.021 | -0.078 |
| -10 | -0.009 | -0.082 | -0.001 | -0.074 | -0.013 | -0.092 |
| -9 | -0.041 | -0.123 | -0.061 | -0.136 | -0.036 | -0.127 |
| -8 | -0.01 | -0.132 | -0.017 | -0.152 | -0.009 | -0.136 |
| -7 | -0.04 | -0.172 | -0.047 | -0.2 | -0.039 | -0.175 |
| -6 | 0 | -0.172 | -0.001 | -0.201 | -0.001 | -0.175 |
| -5 | -0.097 | -0.269 | -0.101 | -0.302 | -0.097 | -0.272 |
| -4 | -0.03 | -0.299 | -0.024 | -0.326 | -0.033 | -0.305 |
| -3 | -0.021 | -0.32 | -0.017 | -0.343 | -0.024 | -0.329 |
| -2 | -0.049 | -0.368 | -0.049 | -0.392 | -0.05 | -0.379 |
| -1 | -0.053 | -0.422 | -0.049 | -0.441 | -0.056 | -0.434 |
| 0 | -0.012 | -0.433 | -0.015 | -0.456 | -0.012 | -0.446 |
| 1 | -0.047 | -0.48 | -0.044 | -0.5 | -0.049 | -0.495 |
| 2 | -0.035 | -0.514 | -0.025 | -0.526 | -0.039 | -0.534 |
| 3 | 0.044 | -0.47 | 0.059 | -0.466 | 0.039 | -0.495 |
| 4 | 0.048 | -0.422 | 0.05 | -0.416 | 0.046 | -0.45 |
| 5 | 0.015 | -0.407 | 0.01 | -0.406 | 0.015 | -0.434 |
| 6 | 0.017 | -0.391 | 0.028 | -0.378 | 0.012 | -0.422 |
| 7 | -0.011 | -0.402 | -0.01 | -0.387 | -0.013 | -0.435 |
| 8 | -0.009 | -0.411 | 0.001 | -0.387 | -0.013 | -0.448 |
| 9 | -0.034 | -0.445 | -0.025 | -0.411 | -0.039 | -0.487 |
| 10 | 0.018 | -0.427 | 0.025 | -0.387 | 0.015 | -0.472 |
| 11 | 0.005 | -0.422 | 0.044 | -0.343 | -0.008 | -0.48 |
| 12 | 0.028 | -0.394 | 0.036 | -0.307 | 0.024 | -0.456 |
| 13 | 0.036 | -0.358 | 0.064 | -0.243 | 0.026 | -0.429 |
| 14 | -0.003 | -0.361 | -0.01 | -0.253 | -0.002 | -0.431 |
| 15 | -0.005 | -0.366 | 0.028 | -0.225 | -0.016 | -0.447 |
Table 4 presents the Average Abnormal Return (AAR) and Cumulative Average Abnormal Return (CAAR) results for MAR, MKAR and MM. The CAAR reported negative values, under all the three models during the entire window period. Figure 1 clearly shows ‘V’ shape curve, which denotes that there was huge negative change in CAAR before and after the happening of the event.
| Table 4 Results of Average Abnormal Return (AAR) and Cumulative Average Abnormal Return (CAAR) for MAR, MKAR and MM | |||||||||
| Day | EIFFL | SOFTTECH | RPPL | ||||||
| MAR | MKAR | MM | MAR | MKAR | MM | MAR | MKAR | MM | |
| -15 | 0.01 | 0 | 0.01 | -0.05 | -0.05 | -0.05 | 0 | 0 | 0 |
| -14 | -0.03 | -0.03 | -0.03 | -0.05 | -0.05 | -0.05 | 0.04 | 0.04 | 0.04 |
| -13 | -0.05 | -0.05 | -0.05 | -0.09 | -0.09 | -0.09 | 0.01 | 0 | 0 |
| -12 | -0.03 | -0.03 | -0.03 | -0.14 | -0.14 | -0.14 | 0.01 | 0 | 0 |
| -11 | -0.06 | -0.05 | -0.06 | -0.17 | -0.17 | -0.18 | 0.01 | 0.01 | 0.01 |
| -10 | -0.05 | -0.03 | -0.06 | -0.22 | -0.22 | -0.24 | 0.02 | 0.03 | 0.03 |
| -9 | -0.12 | -0.13 | -0.12 | -0.27 | -0.29 | -0.27 | 0.03 | 0.01 | 0.01 |
| -8 | -0.12 | -0.14 | -0.12 | -0.32 | -0.34 | -0.32 | 0.05 | 0.02 | 0.03 |
| -7 | -0.22 | -0.24 | -0.22 | -0.32 | -0.35 | -0.31 | 0.03 | -0.01 | 0 |
| -6 | -0.17 | -0.19 | -0.17 | -0.37 | -0.4 | -0.36 | 0.03 | -0.01 | 0 |
| -5 | -0.37 | -0.4 | -0.36 | -0.42 | -0.45 | -0.4 | -0.01 | -0.06 | -0.05 |
| -4 | -0.32 | -0.34 | -0.32 | -0.47 | -0.5 | -0.46 | -0.1 | -0.14 | -0.14 |
| -3 | -0.33 | -0.34 | -0.34 | -0.47 | -0.5 | -0.47 | -0.15 | -0.19 | -0.18 |
| -2 | -0.35 | -0.36 | -0.35 | -0.52 | -0.54 | -0.51 | -0.24 | -0.28 | -0.27 |
| -1 | -0.37 | -0.38 | -0.38 | -0.57 | -0.58 | -0.57 | -0.33 | -0.36 | -0.35 |
| 0 | -0.37 | -0.38 | -0.38 | -0.52 | -0.54 | -0.52 | -0.41 | -0.45 | -0.44 |
| 1 | -0.4 | -0.4 | -0.41 | -0.54 | -0.56 | -0.54 | -0.5 | -0.54 | -0.53 |
| 2 | -0.43 | -0.43 | -0.46 | -0.5 | -0.51 | -0.51 | -0.61 | -0.64 | -0.63 |
| 3 | -0.45 | -0.43 | -0.48 | -0.45 | -0.44 | -0.48 | -0.51 | -0.53 | -0.52 |
| 4 | -0.35 | -0.33 | -0.39 | -0.5 | -0.49 | -0.53 | -0.42 | -0.43 | -0.42 |
| 5 | -0.35 | -0.34 | -0.39 | -0.45 | -0.45 | -0.49 | -0.41 | -0.43 | -0.42 |
| 6 | -0.36 | -0.33 | -0.41 | -0.47 | -0.45 | -0.52 | -0.34 | -0.35 | -0.34 |
| 7 | -0.37 | -0.34 | -0.42 | -0.49 | -0.47 | -0.55 | -0.34 | -0.35 | -0.34 |
| 8 | -0.36 | -0.32 | -0.42 | -0.52 | -0.49 | -0.58 | -0.35 | -0.35 | -0.34 |
| 9 | -0.37 | -0.31 | -0.43 | -0.53 | -0.49 | -0.61 | -0.44 | -0.43 | -0.42 |
| 10 | -0.36 | -0.3 | -0.43 | -0.48 | -0.44 | -0.57 | -0.43 | -0.42 | -0.41 |
| 11 | -0.35 | -0.25 | -0.45 | -0.48 | -0.4 | -0.61 | -0.43 | -0.38 | -0.38 |
| 12 | -0.34 | -0.23 | -0.45 | -0.43 | -0.34 | -0.57 | -0.41 | -0.35 | -0.35 |
| 13 | -0.34 | -0.21 | -0.47 | -0.38 | -0.26 | -0.56 | -0.35 | -0.26 | -0.26 |
| 14 | -0.34 | -0.21 | -0.47 | -0.37 | -0.26 | -0.54 | -0.37 | -0.29 | -0.29 |
| 15 | -0.34 | -0.17 | -0.49 | -0.41 | -0.26 | -0.61 | -0.35 | -0.24 | -0.24 |

Figure 1 ARR/CARR for all the Models
Table 5 presents the results of the Cumulative Average Abnormal Return (CAAR) and t-statistics in MAR, MKAR and MM. It shows that there was significant impact around the event and hence the study rejected the null hypothesis, NH01 “There is no significant impact of national lockdown on the share prices of SME EMERGE Index listed sample companies.”
| Table 5 Result of Window Period Cumulative Average Abnormal Return (CAAR)and T-Statistics for the Events in MAR, MKAR and MM | ||||||
| Window | MAR | MKAR | MM | |||
| CAAR | t-STAT | CAAR | t-STAT | CAAR | t-STAT | |
| 1 | -0.11 | -3.33* | -0.11 | -3.12* | -0.12 | -3.48* |
| 2 | -0.19 | -4.51* | -0.18 | -4.09* | -0.2 | -4.75* |
| 3 | -0.17 | -3.36* | -0.14 | -2.66* | -0.19 | -3.72* |
| 4 | -0.15 | -2.66* | -0.11 | -1.9 | -0.18 | -3.07* |
| 5 | -0.24 | -3.68* | -0.21 | -3.10* | -0.26 | -4.05* |
| 6 | -0.22 | -3.14* | -0.18 | -2.47* | -0.25 | -3.56* |
| 7 | -0.27 | -3.61* | -0.24 | -3.04* | -0.3 | -4.01* |
| 8 | -0.29 | -3.62* | -0.25 | -3.05* | -0.32 | -4.04* |
| 9 | -0.36 | -4.32* | -0.34 | -3.88* | -0.4 | -4.71* |
| 10 | -0.35 | -4.01* | -0.31 | -3.42* | -0.39 | -4.46* |
| 11 | -0.37 | -3.98* | -0.29 | -2.99* | -0.42 | -4.57* |
| 12 | -0.35 | -3.63* | -0.26 | -2.61* | -0.41 | -4.25* |
| 13 | -0.35 | -3.47* | -0.23 | -2.23* | -0.42 | -4.16* |
| 14 | -0.35 | -3.34* | -0.24 | -2.20* | -0.42 | -4.02* |
| 15 | -0.37 | -3.41* | -0.22 | -2.03* | -0.45 | -4.17* |
2. Computed in MS-Excel 2019
Table 6 and Figure 2 illustrate the result of GARCH (1, 1) model. EIFFL suffered very high volatility and SOFTTECH experienced low volatility. All the three companies reported volatility in stock return, during the event period.
| Table 6 Result of Garch (1,1) Model | ||
| Company | Coefficient | α+β |
| EIFFL | 0.452792 | 1.057782 |
| 0.60499 | ||
| SOFTTECH | 0.143592 | 0.750649 |
| 0.607057 | ||
| RPPL | 0.244078 | 0.881697 |
| 0.637619 | ||

Figure 2 Garch Graph
Conclusion
The event study revealed that the SME EMERGE Index listed companies suffered negative returns during the national lockdown in India. Stock returns were highly volatile during the COVID-19 pandemic period. On the whole, the event study model clearly identified that the market was highly influenced by the event. In other words, there was significant impact, before and after the event. The result recommends to the investor to be aware of the market situation, before and after the occurrence of important event.
References
Indhumathi, G., Babu, M., & Gayathri, J. (2019). Performance of Indian mutual fund schemes. International Journal of Recent Technology and Engineering, 2S6 (8), 590-592.