Research Article: 2022 Vol: 21 Issue: 5
Is There Any Bubble Price in Indonesian Islamic Stock? An Application of Right Tail Augmented Dickey Fuller (RTADF)
Aula Ahmad Hafidh Saiful Fikri, Yogyakarta State University
Hadri Kusuma, Indonesian Islamic University
Sunaryati, UIN Sunan Kalijaga Yogyakarta
Citation Information: Fikri, A.A.H.S., Kusuma, H., & Sunaryati, (2022). Is there any bubble price in Indonesian Islamic stock? An application of right tail augmented dickey fuller (RTADF). Academy of Strategic Management Journal, 21(S5), 1-17.
Abstract
Purpose: The implementation of the Islamic capital market in Indonesia applies the principles of Islamic capital participation not to be realized in the form of sharia or non-sharia shares, but rather in the form of a stock index that meets the principles of sharia i.e. non-bubble stock. Screening companies through methods applied by authority agencies actually cannot avoid speculative actions that cause speculative bubbles. This research intended to detect the bubble price in the Indonesian Islamic Stock Index.
Design/methodology/approach: An econometrical model as well as an equation, according to monthly data, Indonesian Islamic Stock Idex (IDXS) variable analysed by Right Tail Augmented Dickey Fuller (RTADF) approach. This tool very useful to detect and date-stamping of bubble with more accurately than other tools.
Finding: Our empirical results indicate the existence of rational bubbles in Indonesian Islamic stock market.
Practical Implication: This paper show that even Islamic stock with any prohibition and selective instrument can not avoid from bubble phenomenon. The stock may exhibit sharia value, but if the market play the role, so that these value may fallen away.
Originality/value: The current model or tools to analyse and detect accurately is Right Tail Augmented Dickey Fuller (RTADF), the application of those method in Islamic assets was not avalibale. In order to appropriate with Islamic Principes, the Islamic assets are not allowed contain bubble. This paper introduce that those Principes establish or not using this paper analysis.
Keywords
Bubble, Islamic Stock Index, Right tail ADF.
JEL Classifications
C32, E44, E58
Introduction
Financial crises are often accompanied by cycles of asset price booms and busts (Borio & Lowe, 2002; Kindleberger, 2000). Exploding asset price bubbles can hurt the financial system and lead to a systemic financial crisis. However, not all bubbles are equally dangerous. The rise in asset prices is not always the reason for the bubble; there are several reasons for this phenomenon. The first reason is that the increase in risk causes changes in the underlying price of the guaranteed asset within the limits of rational expectations. Other reasons are factors that can cause permanent deviation from the path of balance. Fama states that large asset price movements can be explained by the time-variable risk premium, while Shiller believes that often irrational psychological effects (such as herd behavior) lead to changes in asset prices and the creation of bubbles (Case et al., 2004).
To understand the phenomenon of an investment or asset bubble, a proper description is essential. According to Scherbina (2013) a bubble can be described as a deviation between the fundamental value of a market good and its market price (Scherbina, 2013). This is supported by Siegel (2003) who states that the bubble can be described as a period in which speculative investment causes an overvaluation of securities in a particular sector (Siegel, 2003). This mispricing process can be positive or negative, depending on the current development of the stock in relation to past price movements and the resulting buy or sell reaction.
In the context of bubble formation, behavioral finance plays an important role. There are important concepts in behavioral finance in relation toformation bubble and bust. There is a sign of overconfidence; people make decisions based on their guts (intuition) rather than decisions based on calculations. As a result, social distortions lead to wrong judgments and the formation of public opinion (Case et al., 2004). It can thrive in economics, securities, stock market, real estate, and others. Investors want to pursue profits beyond a reasonable rate of return. Various experiences experienced by developing and developed countries with historical financial crises, begin to highlight the importance of good macroeconomic, financial and regulatory policies (Baker & Nofsinger, 2011). Therefore, identifying and detecting speculative burst bubbles has become a major concern in the economic literature (Tobin, 1984).
Failure to detect asset price bubbles has a devastating impact on the economy. In fact, the detection of future bubbles is very difficult (even the detection of bubbles that occur is difficult). Financial theory suggests that if there is a bubble, the price should inherit its explosive nature (Caspi, 2017). There are many studies that consider the formation of asset price bubbles that can lead to financial crises (Brunnermeier & Cheridito, 2019). One of them analyzes the role of agency problems between conventional banks and their borrowers. Banks have risk transfer contracts on the side of their assets, implying that in case of default, the borrower's limited liability will allow him to transfer the burden of losses to the bank. This will encourage borrowers to overinvest in risky assets (moral hazard), leading to price increases and ultimately creating a financial bubble (Barlevy, 2007). Other literature focuses on the liability side and examines how excessive liquidity shocks in the banking system can trigger the formation of asset price bubbles (Brunnermeier et al., 2020; Corrado & Schuler, 2019; Hanson, 2004; Naqvi, 2010; Berger & Bouwman, 2013). Acharya & Naqvi (2012) argue that during periods of high macroeconomic risk, investors reduce their direct investment in the real economy and keep their savings in banks, which are considered safer (Acharya & Naqvi, 2012). This flight to safety left the banks awash with excess liquidity. Because of compensation (returning), they are encouraged to make risky loans and create asset price bubbles. Empirical evidence supports this opinion, that the increase in commercial paper spread, which is often considered as a measure of investor risk perception in the real economy, is accompanied by an increase in bank deposits, loans, and stock prices assets funded (Bank & Risk, 2005; Berger & Bouwman, 2013; Azmat et al., 2021). But according to Farhi & Tirole (2012) with imperfect capital markets, the economy can become dynamically efficient, and at the same time, interest rates can be lower than the rate of economic growth (Farhi & Tirole, 2012). This is because the social rate of return on internal funds exceeds the rate of return on borrowed funds. Therefore, the social rate of return on investment is higher than the market rate of interest when returns can only be imperfectly guaranteed. So it is concluded that the bubble bias occurs even though the economy is dynamically efficient.
So, can asset price bubbles be detected? Numerical empirical studies seek to investigate the rational bubble of stock assets. The econometric test of asset price bubbles shows that econometric detection of asset price bubbles cannot be achieved with a satisfactory degree of certainty. The empirical identification of asset price bubbles in real time, and even in retrospect, is certainly not an easy task, and has been a source of academic and professional debate for a long time. Some have suggested using time series estimation techniques while making use of the predictions made by financial theory. The main idea, based on the theory of asset pricing, suggests that the presence of a bubble component in the price of an observed asset should be manifested in its dynamics and stochastic nature. More specifically, the theory predicts that if there is a bubble, the price should inherit its explosive nature. This in turn allows the formulation of statistical tests aimed at detecting evidence of explosions in the data.
A number of studies such as Case et al. (2004); Blanchard & Watson (1982) argues that dividend and stock price data are inconsistent with the market fundamental hypothesis, where prices are given by the present discounted value of expected dividends. The main problem with this argument is that the real evidence for bubbles can be reinterpreted in terms of market fundamentals that the researchers did not observe. Ahmed et al. (2010); Diba & Grossman's (1985) have recommended an alternative strategy of rational bubble testing by investigating the stationary nature of asset prices and observable fundamentals. In essence, the argument for equities is that if stock prices are not more explosive than dividends, then it follows that rational bubbles do not exist, because they will produce an explosive component to stock prices.
Yet there is still no general framework on how to detect or predict bubble formation, and consequently, leading to mixed results. Stationarity and cointegration tests were recommended by (Wolf, 2020; Diba & Grossman's, 1985). The main idea behind this test is that if there is a rational bubble and the dividend is stationary at the first difference, the first difference in the stock price must be stationary. On the other hand, the lack of cointegration between price and value fundamentals is indicative of a rational bubble. This test has been used in several previous studies including Case et al. (2004); Diba & Grossman's (1985). Although the unit root and cointegration assays have been widely used in empirical research, there are serious limitations to the methodology demonstrated by (Evans, 1991) who showed that the unit root and cointegration assays are not capable of detecting burst bubbles when there are periodic bubble collapses in the Blanchard & Watson (1982).
Recently, a new bubble detection strategy was developed by Phillips et al. (2015), later PWY and Phillips et al. (2018) hereafter PSY, based on a recursive and scrolling ADF unit root test that allows detecting bubbles in the data and stamping the date of their occurrence. This type of test uses a right-tail variation of the Augmented Dickey-Fuller unit root test in which the null hypothesis is the unit root and the alternative is an explosive bubble. PWY and PSY showed that using a recursive and rolling test resulted in a higher power in detecting bubbles, compared to the standard test on the whole sample. In their Monte Carlo study, Homm & Breitung (2012) compared several time series-based tests for detecting bubbles and found that the PWY strategy performed relatively well in detecting periodically collapsing bubbles and in real-time monitoring. Phillips et al. (2018) showed through a Monte Carlo study that the PSY strategy outperformed the PWY strategy in the presence of several bubbles.
This study uses Rtadf, an EViews Add-in that allows end users to easily test for the presence of bubbles, by applying four variations of the right-tail ADF unit root test. The four tests include the standard ADF test and the rolling window ADF test, as well as the newer PWY supremum ADF (SADF) test and the generalized SADF PSY test (GSADF). Add-ins performs two main tasks. First, calculate the relevant test statistics, according to the selected test. Second, the add-in obtains a corresponding finite sample critical value by performing a Monte Carlo simulation, under the Gaussian innovation assumption, or by bootstrapping, which may be stronger in the presence of non-stationary volatility or a larger sample size. The add-in allows users to choose between performing sequential and parallel (multicore) simulations. It is seen that using the latter option results in a significant reduction in computation time as the amount of recursion required to complete the simulation increases. The difference between this study and previous studies is that apart from finding bubbles, this study tries to do so for the Islamic stock exchange.
The majority of Indonesia's population adheres to Islam; this has led to the development of activities based on sharia laws or principles, especially in economic activities. The practice of conventional economic activities, especially in capital market activities that contain elements of speculation as one of its components, is still a psychological barrier for Muslims to actively participate in investment activities, especially in the capital market, so that foreign investors are more dominant in investing in the capital market. The difference between the conventional capital market and the Islamic capital market in general can be seen in the instruments and transaction mechanisms as well as the issuer's stock criteria that must meet the basic principles of sharia.
The process screening sharia eliminates companies with financial leverage levels in excess of the threshold and engaging in economic activities that are inconsistent with Islamic principles. Furthermore, theprocess screening shariacan expose Islamic equities to different sources of risk compared to non-Islamic equities. For this reason, Islamic equities can be viewed as a separate asset class. Individual and institutional behavior in the Islamic financial system is subject to Islamic norms, which arise from assumptions that are different from conventional or Western markets. If speculation is considered undesirable in Islamic sharia, then the actions of Islamic investors are limited to Islamic stocks that have yields less than or equal to non-Sharia stocks. This is because Islamic portfolios do not include stocks that have been shown to have high returns, such as sin stocks which (Homm & Breitung, 2012) define as publicly traded companies that are directly involved or linked to alcohol, tobacco, andgaming. If this is the case, from the point of view of Islamic economics, the activity is considered gharar because the pricing on speculation is disconnected from the fundamentals related to profit (Ahmed et al., 2010). This deviates from the Islamic expectation of mobilizing capital to encourage real economic development to merely seeking profit through speculation. Given that more than 80 percent of Indonesia's population is Muslim, evidence of a rational bubble in the stock market may go against the basic principles of Islamic finance (Desai & Said, 2004).
Until now, the concept of Islamic finance is developing not only in Muslim countries but also in non-Muslim countries such as the UK and the United States. Now Muslim investors, as well as non-Muslim investors around the world, can choose financial investment assets that have a sharia basis. For example, in the United States capital market, there is the Dow Jones Islamic Market Index (DJIMI) which consists of shares of United States companies that have business activities that do not violate the Islamic sharia corridor, while in the UK, the Islamic Index has been known since 2013 on the London Stock Exchange. On the Indonesia Stock Exchange, there are 2 sharia indices, namely the Jakarta Islamic Index (JII) and the Indonesian Sharia Stock Index (ISSI). JII has been developed since July 3, 2000. The establishment of this sharia instrument is to support the establishment of a Sharia Capital Market which was then launched in Jakarta on March 14, 2003. The purpose of establishing the JII is to guide in investing in shares while still paying attention to sharia regulations. In addition, JII is a performance benchmark in choosing a stock portfolio. The shares entered in JII are 30 (thirty) shares which are considered not to violate sharia principles and are evaluated every six months. ISSI is a stock index that reflects all sharia shares listed on the Stock Exchange. The development and growth of various investment instruments and capital markets based on sharia is good news for investors, especially Muslim investors. One of the problems faced by every investor when investing in the capital market is when assessing assets. When investing in a stock, an investor needs to know and estimate the return and risk of the selected stock (Manap & Omar, 2014).
Literature Foundations
Definition of Bubble
According to Tobm, stock prices are largely inefficient fundamental assessments because they are largely determined by the speculations of other speculators. A continuous sharp rise in the price of an asset is also an indication of a bubble. Speculators create faddism, inflating the price bubble unless it bursts and causes asset prices to fall. Rational speculative bubbles may be an attempt to identify the activity of investors who behave irrationally, especially when dribble attempts appear (Cuthbertson, 1996).
Bubbles in the economy are defined as a price component that is seen from the expectation of future price increases, but is not supported by the fundamental value of these prices. If the bubble occurs continuously, then the price will bounce up. On the other hand, it is feared that the bubble will burst when there is a large-scale trade that causes the price to suddenly drop. Bubble conditions often occur in the world of capital markets. Speculation is one of the activities that can trigger an economic bubble. Speculation arises when investors make decisions by considering reasonable and well-run possibilities, so that profits are obtained in the future. If the decision is not as expected, then losses can occur in the future. So the act of speculation is prone to future problems that may arise. The increase and prospect of these assets can lure new investors in so that prices will continue to increase so that momentum for speculation will be created Galbraith. On the other hand, the tendency of investors to influence the market stemming from the ownership of a more dominant asset can control market conditions into an unnatural trend.
An irrational investor attitude can be characterized as personal satisfaction (Shefrin, 2007). Rational speculative bubbles have a unique feature that makes investors frantic despite the fact that the stock price exceeds their fundamental value, but thinks that it is very likely that the bubble will continue to grow and generate high returns. Finally the losses caused by the bubble crash may be compensated by the high returns earned, a valid reason for rational investors to overplay Chan et al. Investment choices are largely misguided during the bubble formation phase. Stock market bubbles finance volatile businesses and encourage overinvestment in popular sectors. Myopic investors see the stock market will continue to rise in the long term. But the bubble had to burst and the stock price would not recover after the bubble burst. Ultimately the spark has a long-term and detrimental effect on the real economy.
Assets Price Bubble
Within the framework of asset pricing theory and market efficiency assumptions, asset prices only depend on information about asset efficiency, must correspond to the basic value of the asset, and any kind of deviation is called a bubble. It is argued that bubbles are not a meaningful way to characterize asset price cycles because the concept lacks analytical coherence and empirical support. Bubble is not a specific word for the stock market. Early opinions of so-called price bubbles referred to different types of assets, such as foreign exchange, gold, real estate, and stocks. According to Blanchard & Watson (1982) stated that bubbles are more likely to occur in the price of an asset with an unclear fundamental value, it is estimated that the bubble is almost non-existent if the fundamental value of an asset is easily identified. Some of the earlier theories focused on stock bubbles, although most of them theorized about bubbles in general, not about stock bubbles in particular.
Speculative investors as those who are interested in profits from trading assets rather than their use or earning capacity. Thus, non-speculative investors are interested in profiting from product development, or earning from the income from the venture. Siegel (2003) adds that this implies the involvement of momentum investors, aiming to sell to other investors at a higher price, as quickly as possible. Under this definition, almost all investments targeting capital appreciation can be classified as speculative investments. In this context, an economic bubble is defined as a period in which speculative investment leads to an overvaluation of securities in a particular sector (Siegel, 2003). Economic bubbles can burst when investors realize that the industry in a bubble is not as profitable or sustainable as they previously thought. At this point, the valuations of the company and the securities involved drop rapidly to pre-bubble levels. Scientifically defining the term bubble is the subject of some debate, especially bubbles that have not yet collapsed (Hara, 2008). The financial crisis in the period 2008 and 2009 has resulted in an economic slowdown in many countries with high unemployment rates and economic bubbles at the national and international levels. The causes include a lack of governance, easy and uncontrolled mortgage lending, financial market speculation and finally the use of irrelevant models for inappropriate speculation resulting in the evaporation of hot money (Hamnett, 2009); (Mackenzie & Spears, 2012).
A well-functioning and thriving stock market can trigger an economic boom. This encourages the accumulation of capital and its allocation to its best use, paving the way for long-term investment and thereby spurring economic growth. Investors benefit from capital gains and dividends due. In an efficient stock market, stock prices provide accurate signals for optimal resource allocation. Factors such as a healthy economy, growing profit margins, growing consumer base, etc., lead to better fundamentals and higher stock prices. On the contrary, the situation worsens and certain concerns increase if surrounded by speculators. Successful investors start investigating and speculating on upcoming events for other gains. Traders buy and sell stocks based on speculative motives rather than investment value and the market presents nothing more than a casino. Without speculative trading, very few trades occur on individual assets.
Detecting of Bubbles Existence
Based on the previous literature review, generally it found at least three approach methods that applied to examine speculation in stock market on bubble price approach and it covers using log logistic hazard model on duration dependent tests, Markov Switching-Regima and Stasioner test (ADF Test) which developed on cointegration analysis. Several methods have been used to detect explosive behavior that could give rise to an asset price bubble. Various time series methods such as cointegration test (Diba & Grossman's, 1985), finite variance test, specification test and Chow and CUSUM test (Homm & Breitung, 2012) is used to explore speculation in asset prices. Diba & Grossman's (1985) study of the American stock market used a modified stationarity test related to stock prices. The problem with their model is that the previous bubble is ignored if not more explosive than the next bubble. Evans (1991) used the simulation method and showed that in the presence of a bubble, the unit root and cointegration test could not reject the hypothesis of the absence of a bubble.
According to the previous some results, ADF test approach has some personal advantages and completes the other analysis. It is believed that ADF test model is the most accurate and able to detect speculation period in the market. Because of that, to answer this research, the researcher use ADF test, this model at least six previous researches. The researches have been done by Engsted & Nielsen proofed that there is no speculation in stock market. While the researches by Kivedal, Naoui, Engsted and Kia proofed the there is a big effect of speculation in the market. The main problem in this research is to see whether there are signs of speculation in the sharia capital market. However, these various tests cannot determine the time of bubble occurrence. The test can only check for the presence or absence of bubbles.
Three tests were conducted and taken into consideration namely augmenteddickey fuller test (ADF), SADF, maxRADF and Generalized SADF All test are different right tail variation of the well know Augmented Dickey Fuller test for stationarity. RADF test is a rolling regression test performed on subsequent sub- samples of the main samples with the rolling forward initialization. Every sub-sample is finite and fixed. Moreover the detection of bubble entirely dependent on the fact related to sub-sample. Therefore sample size should be optimum in order to determine bubble detection with high accuracy. SADF method is recursive in nature. Recursive means that the solution of a bigger problem is combination of the solution of the smaller problem that constitutes and contributes towards bigger problem. Supremum augmented dickey Fuller test has an important factor named “supremum in the singular form” that is the least upper bound in a partially ordered set. The generalized version of SADF is GSADF that has been conducted by Phillips et al. (2012), which observes the possibility of periodically collapsing bubble (Phillips et al., 2018).
Data and Methodology
Methodology
Tests based on Dicky Fuller's right tail augmented (RTADF) should be used to determine bubble timing. One of the most common methods of empirically identifying bubbles is to investigate the time series property of the underlying asset's price. Asset pricing theory states that a bubble component in asset prices exists if prices exhibit explosive behavior. This is the basis for establishing an econometric test of price's stochastic properties, which is targeted to detect explosive episodes in time series data (Caspi, 2017). A new method for detecting bubbles was developed by (Phillips et al., 2018). This framework is commonly referred to as the Phillip, Shi and Yi (PSY) framework and is based on the earlier Phillip, Wu and Yi (PWY) framework (Phillips et al., 2015). The Recursive window right-tailed ADF test was first introduced by Phillips et al. (2015) was later developed by Phillips et al. (2018). This method is based on Dicky Fuller's rolling and general recursive unit root test and ultimately leads to the discovery of bubbles and their time of occurrence. This test uses changes in Dickey Fuller's Generalized right tile test, where the null hypothesis, alternative hypothesis, and unit root are mild explosive processes. The PWY and PSY studies show that rolling and recursive tests are better able to detect bubbles than standard tests. Homm & Breitung (2012) used the Monte Carlo simulation method to compare several time series tests to explore bubbles and concluded that the PWY strategy worked quite well.
PWY and PSY developed the SADF and GSADF test procedures based on the presentvalue model of stock prices with constant expected returns. In this framework, the day/date-t of Pt's share price is expressed in the Euler equation as follows
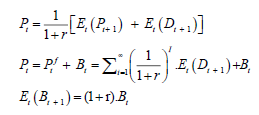
The sum of Ptf = Pt Bt, and Bdt is called the fundamental stock-price and rational bubble.
SADF and GSADF tests are based on a recursive approach and contain a Rolling Augmented Dickey-Fuller (RADF) regression window. The window size of the rolling ADF regression is denoted rw, defined by rw = r2 - r1 and the minimum set of window width is r0. The general RADF test procedure is illustrated by the below Figure 1.

Figure 1: Illustration Of Rolling Adf (Radf) Procedure.
The PWY and PSY procedures are based on the reduced form empirical equation, to obtain the SADF and GSADF statistical tests:
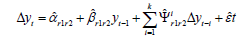
Where k is the transient lag order; “αr1, r2, βr1, r2 and ψr1, r2 are parameters estimated using OLS and yt is the logarithm of the asset price; r1 and r2 show the starting and ending points in the regression window of the total sample (T). The number of observed data is indicated by Tw= (Trw), where (.) is the floor function. ADF statistics (t-ratio), expressed by ADFr2r1, the ratior1, r2 to the standard error. Then the ADF rolling regression was performed to obtain the ADF statistical series value and detect the presence of bubbles. To identify it, the right-tailed variation of the standard Augmented Dickey-Fuller (RTADF) unit root test was used. As the specifications carried out by (Caspi, 2017), on PWY and PSY, the following hypothesis is formulated.
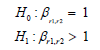
If H0 is accepted then the asset price sero data has a unit root problem, so it is not stationary and if H1 is accepted then the serial data is stationary so it has mildly explosive autoregressive coefficients. So when the P value is lower than 5%, H0 is rejected, and occurs or is detected the occurrence of price bubbles. On the other hand, if the P value is greater than 5%, H0 is accepted and there is no price bubble. In the PWY test, the null hypothesis has a unit root; the alternative hypothesis has one bubble period. While the PSY test, the null hypothesis has a unit root, the alternative hypothesis has several bubble periods.
Bubble Detection by PWY Test (SADF Test)
Phillips et al. (2012) developed the supreme ADF (SADF) process, known as the PWY approach to identify asset price bubbles. SADF series statistics are expressed below.
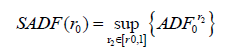
This test estimates repeatedly on the ADF regression model by forward expansion, window size rw expansion from r0 (smallest sample) to r1 (largest sample). The starting point of data r1 remains at point 0, the end point varies rw and ends at r2=1 recursive PWY test can be illustrated below Figure 2.

Figure 2: Illustration Of Supreme Adf (Sadf) Procedure.
Bubble Detection by PSY Test (GSADF Test)
Phillips et al. (2015) developed a Generalized Sup ADF (GSADF) process, known as the PSY approach, to detect the date-stamp bubble period, by estimating iteratively on the ADF regression model with backward expansion. The GSADF process makes it possible to adjust both the start and end points, or from 0 to r2 – r0. As a result the sub-sample used in the recursive process is more comprehensive than the PWY test (SADF). Formally the GSADF test is defined as follows.
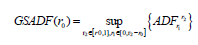
The strength of the GSADF test is greater than that of the SADF. The recursive PWY test can be illustrated below Figure 3.

Figure 3: Illustration Of Supreme Adf (Sadf) Procedure.
The results of this data analysis are useful for determining the presence of an explosive bubble in Islamic stock assets in Indonesia. This knowledge can assist in early detection (early warning) of speculative bubble behavior, so as to adjust to selling assets wisely and carefully, so that market efficiency can be created. This study also helps determine and detect exactly when it starts to occur and when a possible burst occurs.
The Data
The sample in this study used companies listed in the Jakarta Islamic Index (JII) monthly during January 2003-December 2020. One of the reasons for using JII is because as an index containing companies that have passed the sharia screening by the National Sharia Council, it is very likely that every investor who uses JII makes the sharia concept one of their investment considerations.
The study analyzes bubble detection for the Jakarta Islamic Index/Indonesian Sharia Stock Index (denoted IDXS), the data covers the period from 2003-1 to 2020-12 taken monthly from various sources obtained 216 observations, IDXS is the latest index developed by the Composite Stock Index in collaboration with Danareksa Investment Management (DIM) to respond to information needs related to sharia investment. IDXS performs a filter on the listing shares. The reference in screening is the sharia fatwa issued by the National Sharia Council, based on this fatwa; the IDX selects issuers whose business units comply with sharia.
The IDXS variable shows the minimum of 62.35, the maximum is 787.12. The mean value (mean) of IDXS was 476.89, while the standard deviation was 210.34 during the study period from 216 observed data. Likewise IDXS), showing a value that continued to rise during the period. The lowest value in January 2003 was 62.35. This can happen because IDX has just been introduced as an alternative to the JCI, so the number of listed issuers that are incorporated is still small. However, the IDX value always increases in line with the number and performance of companies in the Islamic stock category. In January 2018 it recorded the highest value of 787.12. At the same time, the JCI also recorded a record high. This indicates that the two indices are closely related in their performance. IDX and IDXS move with almost the same pattern or trend but the JCI development is higher. The average IDXS value is 478.75.
Kurtosis is an indicator to show the degree of tailedness. The greater the kurtosis value, the sharper the curve. The reference value of kurtosis is 3. If the kurtosis value is greater than 3, then the distribution curve is called leptokurtic, meaning that the data distribution is positive and standard. Meanwhile, if it is lower than 3, it is called platykurtic, while the kurtosis value equal to 3 means the distribution curve is normal or mesokurtic or mesokurtotic. If the value is more than 3, it means that it supports a lot of observational data close to the average asset price. In financial markets, kurtosis helps in analyzing the risk and return of an asset. Leptokurtic means that risk occurs because of an outlier, this type of asset is attractive to investors who dare to risk takers while assets whose value is below kurtosis are considered safer so that demand increases. In Table 1 IDXS have a value below the standard meaning that the asset contains risk, which is ainvestment less secure.
Skewness is a measure of the asymmetry in the value distribution. Skewness can be positive, negative, and zero. Skewness with a positive value means that the tail of the distribution is to the right of the value which means that investors are likely to get high gains. Meanwhile, a negative skewness means that the tail of the distribution is on the left, indicating that most of the values are on the right side of the curve, so investors are more likely to suffer losses. While the skewness is zero, it means that the value is symmetrically distributed, with the distance between the tails of the distribution on the right and the left being the same. From Table 1, the Islamic Stock Index (IDXS) asset has a negative skewness value of -0.518021. It means that the asset contains risk (less safe).
| Table 1 Descriptive Statistics |
|
|---|---|
| IDXS | |
| Mean | 476.8876 |
| Median | 533.3500 |
| Maximum | 787.1200 |
| Minimum | 62.35000 |
| Std. Dev. | 210.3385 |
| Skewness | -0.518021 |
| Kurtosis | 1.914326 |
| Jarque-Bera | 20.26862 |
| Probability | 0.000040 |
| Sum | 103007.7 |
| Sum Sq. Dev. | 9512092. |
| Observations | 216 |
Skewness and kurtosis can indicate the distribution conditions of the data. The ideal is when the data is normally distributed, i.e. when skewness is 0 and kurtosis is 3. The farther from the ideal condition, the more non-ideal or uneven the data is spread out, so the more risk and speculative returns. Standard Deviation is defined as the mean average, what is the amount (magnitude) of risk in economics and finance, the standard deviation helps determine the amount of risk that investors bear when buying a particular asset. In finance, the standard deviation indicates volatility which indicates risk. Extreme fluctuations show investors how much funds deviates from the expected return. In the table, the standard deviation is 210.34 which means investment in Islamic stocks still contains risk.
Empirical Results
This section presents empirical testing results for speculative bubbles on the Indonesian Islamic stock market. We first apply the RADF, and then SADF and finally GSADF test to the equity market series to compare and make it sure. As a first step in determining the existence of explosive periods and locating their exact origination and termination dates, the lag order in the estimation equation must be specified. (Phillips et al., 2015) argue that the asymptotic distributions of the test statistics remain the same when a low lag order is used, so they used a lag order of zero when conducting the forward recursive analysis with initialization of the first observation. (Phillips et al., 2018) further demonstrate that adding lag orders can potentially bias the estimation results and recommend obtaining the ADF test statistics with a lag order of zero. We thus employ the lag order to zero in equation. The initial start-up sample for the generalized forward recursive analysis contains 216 observations. Table 2 shows that all strategy are exceed their respective 1% right-tail critical values, giving strong evidences that those equity market under study had explosive sub-periods, Therefore we conclude that there are bubbles in these equity markets.
| Table 2 Rtadf Test Of Indonesia Islamic Stock Market (Idxs) |
|||||
|---|---|---|---|---|---|
| ADF | RADF | SADF | GSADF | ||
| Prob.* t-Statistic |
0.671 | 0.058 | 0 | 0.011 | |
| -1.91957 | 1.773931 | 2.557922 | 2.557922 | ||
| Test critical values** | 99% level | 0.651205 | 0.716747 | 1.918606 | 2.594247 |
| 95% level | -0.04641 | 0.009705 | 1.318781 | 2.090744 | |
| 90% level | -0.46149 | -0.36014 | 1.080928 | 1.875756 | |
From Table 2, it can be explained that of the four strategies only one shows the absence of a bubble, namely the ADF standard test, while the other three have significant values, indicating that Islamic stocks (IDXS) also have explosive values, containing bubbles. The table presents the critical values for asset and these were obtained from the Monte Carlo simulation with 1000 replications (sample size 216). In performing ADF regression and calculating critical values, the smallest window consists of 36 observations. From Table 3, the RADF, SADF and GSADF statistical values for the complete data set are -1,920,023, 2.273 and 2.308. Both exceed the critical value of 1,774 > 0.717, 2,558 > 1,919 and 2,558 > 2,091 right-tail critical values, with a significance level of 5 percent, 1 percent and 5 percent, providing strong evidence that Islamic stock prices have explosive subperiods. While the bubble period can be seen in the following Figures 4A, 4B, 4C.
| Table 3 Date-Stamping Procedure Of Indonesia Islamic Stock Market (Idxs) |
|||
|---|---|---|---|
| Period | RADF | SADF | GSADF |
| 1 | 2006:03 – 2006:05 | 2006:03 – 2006:04 | 2006:03 – 2006:04 |
| 2 | 2006:11 – 2007:01 | 2006:08 – 2008:04 | 2006:09 – 2006:11 |
| 3 | 2007:03 – 2008:02 | 2007:03 – 2008:03 | |
| 4 | 2020:03 – 2020:04 | 2020:03 – 2020:04 | |

Figure 4A: Radf Test.

Figure 4B: Sadf Test.

Figure 4c: Gsadf Test.
Date-Stamping Bubble of Idxs
Of the three strategies showing that the Islamic stock price index contains a bubble. RADF shows that there were four bubble periods, the first period occurred in March 2006 to May 2006, the second period occurred from November 2006 to January 2007, had a short decline in March 2007 there was another fairly long bubble until February 2008, or about 11 months, the sharia stock price index experienced a bubble period. IDXS experienced a stable value for a long time, before then containing bubbles again at the end of the analysis period. In general, if ignored minor bubbles, bubbles that occur for less than 5 months, according to the RADF strategy, there will only be one bubble period. Then the SADF test shows 2 bubble periods where the first bubble period is in March - April 2006, then the second period is quite long, the bubble period is from August 2006 to April 2008 or about 18 months. The SADF test can identify more details in reading sharia stock price movements so that they can find a longer period. Even though the bubble period overlaps between RADF and SADF.
Meanwhile, the GSADF strategy as a newer and more complete test succeeded in identifying the bubble period for 4 times. The first period occurred in March – April 2006, the same as the SADF test. The next bubble period was short and only three months, September – November 2006. The GSADF test detected two bubble periods in 2006. The third bubble period lasted for a year from March 2007 to March 2008. In general, the three strategies RADF, SADF and GSADF show one bubble period that lasts long enough for at least a year if minor bubbles are ignored.
From the three tests above, it can be concluded that the most accurate bubble period occurred in the period 2006-2008 because all three showed similar results. With basic methods such as RADF, it is possible to identify bubbles, so the SADF and GSADF tests provide confirmation that the period actually occurred bubbles. This result different with Yu & Hassan (2009), they do not find strong evidence of rational speculative bubbles in OIC stock markets without regard to currency denominations, but similar with Martin-Cervantes & Cruz-Rambaud, they find the delay of tadawul bubble in Saudi Arabia financial Market. So do Ali et al. results indicate the existence of rational bubbles in GCC stock market, the estimation of the starting date of the bubbles indicates that explosive regime emerges in the early 2000s.
Conclsuion
This study examines the presence of the phenomenon of Islamic stock market bubbles in Indonesia over 2003 to 2020 with monthly data. Considering rational bubble change stock price from random walk to an explosive regime and traditional unit roots has less power in detecting periodically collapsing bubbles as point out, this study employ newly developed testing approach right tailed unit root test to not only investigates the presence of rational periodically collapsing bubbles, but also stamps the times of bubbles emergence and collapse. Our empirical results indicate the existence of rational bubbles in Indonesian Islamic stock market, which is contradicted to that.
The results of this paper provide various implications to the investors and most importantly to the policy makers. From the investor’s point of view, it will make them conscious of the size of a bubble, then assist them in identifying early signals prior to crash, which may enable them to perform rationally by selling the assets and adjusting the share price toward its fair value, as well as making the market to be efficient. The existence of rational speculative bubble may lead to a serious mis-allocation of resources and harsh economic fluctuations. These results may also raise questions to Islamic economics and prohibition of gharar. Policy-makers need to be aware, therefore, of the potential harm caused by irrational investor behavior and may require intervention to prevent stock market immoderation.
References
Acharya, V., & Naqvi, H. (2012). The seeds of a crisis: A theory of bank liquidity and risk taking over the business cycle.Journal of Financial Economics,106(2), 349-366.
Indexed at, Google Scholar, Cross Ref
Ahmed, E., Rosser Jr, J.B., & Uppal, J.Y. (2010). Emerging markets and stock market bubbles: Nonlinear speculation?.Emerging Markets Finance and Trade,46(4), 23-40.
Manap, T.A.A., & Omar, M.A. (2014). Speculative rational bubbles: Asset prices in GCC equity markets.Journal of Islamic Finance,3(1).
Indexed at, Google Scholar, Cross Ref
Desai, M., & Said, Y. (Eds.). (2004).Global governance and financial crises. Routledge.
Azmat, S., Hassan, M.K., Ghaffar, H., & Azad, A.S. (2021). State contingent banking and asset price bubbles: The case of Islamic banking industry.Global Finance Journal,50, 100531.
Indexed at, Google Scholar, Cross Ref
Baker, H.K., & Nofsinger, J.R. (2011). Behavioral finance: Investors, corporations, and markets. Behavioral Finance: Investors, Corporations, and Markets.
Indexed at, Google Scholar, Cross Ref
Bank, M., & Risk, L. (2005). FDIC center for financial research working paper no. 2006-03 (Issue 200).
Barlevy, G. (2007). Economic theory and asset bubbles. Economic Perspectives, Q3(Q III), 44-59.
Berger, A.N., & Bouwman, C.H. (2013). How does capital affect bank performance during financial crises?.Journal of Financial Economics,109(1), 146-176.
Indexed at, Google Scholar, Cross Ref
Blanchard, O.J., & Watson, M.W. (1982). Bubbles, rational expectations and financial markets.
Indexed at, Google Scholar, Cross Ref
Borio, C.E., & Lowe, P.W. (2002). Asset prices, financial and monetary stability: exploring the nexus.
Indexed at, Google Scholar, Cross Ref
Brunnermeier, M.K., & Cheridito, P. (2019). Measuring and allocating systemic risk.Risks, 7(2), 46.
Indexed at, Google Scholar, Cross Ref
Brunnermeier, M., Rother, S., & Schnabel, I. (2020). Asset price bubbles and systemic risk.The Review of Financial Studies,33(9), 4272-4317.
Indexed at, Google Scholar, Cross Ref
Case, K.S., & Shill, E. (2004). Is there a bubble in the housing market.Cowles Found. Paper,1089.
Caspi, I. (2017). Rtadf: Testing for bubbles with EViews.Journal of Statistical Software,81, 1-16.
Indexed at, Google Scholar, Cross Ref
Corrado, L., & Schuler, T. (2019). Working paper series. 2336.
Cuthbertson, K. (1996). The expectations hypothesis of the term structure: The UK interbank market.The Economic Journal,106(436), 578-592.
Indexed at, Google Scholar, Cross Ref
Diba, B.T., & Grossman, H.I. (1985).Rational bubbles in stock prices?(No. w1779). National Bureau of Economic Research.
Evans, G.W. (1991). Pitfalls in testing for explosive bubbles in asset prices.The American Economic Review,81(4), 922-930.
Farhi, E., & Tirole, J. (2012). Bubbly Liquidity. November 2011, 678-706.
Hamnett, C. (2009). Tomorrow’s capitalism.
Hanson, S. (2004). Federal Reserve Bank of New York Staff Reports Til Schuermann. 190.
Hara, M.O. (2008). Bubbles: Some perspectives (and loose talk) from history.The Review of Financial Studies,21(1), 11-17.
Indexed at, Google Scholar, Cross Ref
Homm, U., & Breitung, J. (2012). Testing for speculative bubbles in stock markets: A comparison of alternative methods. Journal of Financial Econometrics, 10(1), 198-231.
Indexed at, Google Scholar, Cross Ref
Kindleberger, C.P. (2000). Manias, panics, and crashes: A history of financial crises.The Scriblerian and the Kit-Cats,32(2), 379.
MacKenzie, D., & Spears, T. (2012). The formula that killed Wall Street? The Gaussian copula and the material cultures of modelling.School of Social and Political Science, University of Edinburgh.
Martin-Cervantes, P.A., & Cruz-Rambaud, S. (2020). Date-stamping the Tadawul bubble through the SADF and GSADF econometric approaches. Economics Bulletin, 40(2), 1475-1485.
Naqvi, H. (2010). The Seeds of a Crisis. June.
Phillips, P.C., Shi, S., & Yu, J. (2015). Testing for multiple bubbles: Historical episodes of exuberance and collapse in the S&P 500.International Economic Review,56(4), 1043-1078.
Indexed at, Google Scholar, Cross Ref
Phillips, P.C.B., Shi, S., & Haven, N. (2018). Real time monitoring of asset markets: Bubbles. Cowles Foundation Discussion Paper, 2152.
Indexed at, Google Scholar, Cross Ref
Phillips, P.C., Shi, S., & Yu, J. (2012). Testing for multiple bubbles.
Scherbina, A. (2013). Asset price bubbles: A selective survey. IMF Working Papers, 13(45), i.
Shefrin, H. (2007). How the disposition effect and momentum impact investment professionals.Journal of Investment Consulting,8(2), 68-79.
Siegel, J.J. (2003). What is an asset price bubble ? An operational definition. 9(1), 11–24.
Indexed at, Google Scholar, Cross Ref
Tobin, J. (1984). On the efficiency of the financial-system.Lloyds Bank Annual Review, (153), 1-15.
Wolf, C.K. (2020). Svar (mis) identification and the real effects of monetary policy shocks.American Economic Journal: Macroeconomics,12(4), 1-32.
Yu, J., & Hassan, M.K. (2009). Rational speculative bubbles in the Oic (Organisation of Islamic Conference) stock markets. International Journal of Economics, Management and Accounting, 7(1), 97-131.
Received: 23-Feb-2022, Manuscript No. ASMJ-22-11369; Editor assigned: 25-Feb-2022, PreQC No. ASMJ-22-11369(PQ); Reviewed: 11-Mar-2022, QC No. ASMJ-22-11369; Revised: 18-Mar-2022, Manuscript No. ASMJ-22-11369(R); Published: 28-Mar-2022