Research Article: 2021 Vol: 20 Issue: 2S
Performance is Affected by Leadership and Work Culture: A Case Study from Indonesia
Indra Prasetyo, Universitas Wijaya Putra and Akademi Sekretari dan Manajemen Indonesia Surabaya
Nabilah Aliyyah, Universitas Wijaya Putra and Akademi Sekretari dan Manajemen Indonesia Surabaya
Rusdiyanto, Universitas Airlangga
Chandra Kartika, Universitas Wijaya Putra
Ruddy Winarko, Universitas Wijaya Putra
Chamariyah, Universitas Wijaya Putra
Dwi Lesno Panglipursari, Universitas Wijaya Putra
Muninghar, Universitas Wijaya Putra
Nur Halimah, Universitas Wijaya Putra
Aminatuzzuhro, Universitas Wijaya Putra
Mei Indrawati, Universitas Wijaya Putra
Onong Junus, Universitas Airlangga
Mohammad Herli, Universitas Airlangga
Hafidhah, Universitas Wiraraja
Nanik Kustiningsih, Universitas Airlangga
Gazali, Universitas Madura
Adriani Kusuma, Universitas Madura
Muslimatul Aina, Universitas Madura
Isnain Bustaram, Universitas Madura
Zef Risal, Universitas Madura
Zainurrafiqi, Universitas Madura
Siti Salama Amar, Universitas Madura
Khoiroh Umah, Universitas Gresik
Susan Novitasari Khadijah, Universitas Gresik
Mono Pratiko Gustomi, Universitas Gresik
Hendra Irawan, Universitas Gresik
Arif Syafi'ur Rochman, Universitas Gresik
Dini Ayu Pramitasari, Universitas Gresik
Nawang Kalbuana, Politeknik Penerbangan Indonesia Curug
Muchsin Zuhad Al-asqolaini, STIENU Trate Gresik
Keywords
Leadership, Work Culture, Performance
Abstract
Objective: This paper aims to test the influence of leadership and work culture on the performance of state-owned public bodies.
Design/Methodology/Approach: This paper uses a quantitative approach with the process of finding the knowledge by using data in the form of numbers as a tool that can be generalized to prove hypotheses. Data variable Leadership, work culture and performance of state-owned public agency companies (SOEs). The research method used is the correctional survey method to study the dynamics of correlation between risk factors and effects by approach, observation, or data collection at once.
Findings: The results of this study Leadership have an influence on performance in publicly owned companies, Work Culture has an influence on performance in publicly owned companies, while together leadership variables and work culture variables have an influence on performance variables on publicly owned companies.
Practical Implications: The study results are recommended for employees to improve the effectiveness and efficiency of the performance of state-owned public bodies.
Originality: Previous research has examined the effect of leadership and the culture of work on the performance of Indonesia Stock Exchange companies, and the results have shown that leadership and the working culture in the performance of Indonesia Stock Exchange manufacturing firms. These research researchers replaced the research object in state-owned public agency companies.
Introduction
High employee performance will support the company's productivity, so it should be the company's leadership always pay attention to improving the performance of its members for the betterment of the company (Durrant, 1991; Riksen et al., 2020; Schlesinger & Heskett, 1991). The success rate of employees in performing their responsibilities is employee performance. Two factors, namely internal and external factors, generally influence employee performance (Alessandri et al., 2020; de Mol et al., 2020; Ghezal & Khemakhem, 2020). Internal factors include the company's commitment, the work culture, loyalty, and others, which come from the employee. At the same time, external factors, including management, occupational safety, safety, and corporate culture, come from outside the employee.
Companies, including government bodies (Afanasyev et al., 2019; Agyei & Yankey, 2019; Assaad & El-Adaway, 2020), should own the work culture in such a way that they have to implement values (Asuero, 2013; Ibáñez-Carpena & Benito, 2019; Zamaletdinov et al., 2014), standards, references, and guidelines (Ali et al., 2020; Oberacher et al., 2020; Seibert et al., 2020). Work culture is also an employee's unification, conflict, and motivation in the well-being of their tasks, thereby influencing conduct and performance positively (Al Mansoori, 2017; Rouban, 2005). An enterprise with a strong culture will perform well in the long term. A strong culture means that all employees perceive the company's objectives equally. The unity of perception is based on the similarity of believed values (Suchánek, 2017), upheld norms, and obeyed behavior patterns.
Based on the above exposure, this study raised the problem, among others: Not the maximum role of leaders in mobilizing and motivating subordinates, leaders on under-performing or directing employees who excel and do not even provide training opportunities to employees, Work culture has not been optimally characterized by the number of employees who paced and indifferent to their work, poor work culture due to an uncomfortable work environment and incomplete infrastructure to employee performance, so as not to support employees in work, Lack of high employee motivation in achieving the goals set, so that employee performance is still low, lack of implementation of employee development proportionately and targeted, so that the intellectual ability of employees in their work operations is difficult to improve.
Literature Review and Hypothesis Development
Leadership
Leader is a person who has skills and advantages, especially the prowess of excess in one field, so that he can influence others to jointly do certain activities to achieve one or several goals. So the leader has one or more advantages as a predisposition (a talent brought from birth) and is the need of a situation/age so that he has the power and authority to direct and guide subordinates (Chalikias et al., 2020; Freihat, 2020).
Leaders must be chosen from among employees who truly have the appropriate experience, insight, and competence. The definition of leadership is an effort of influence, not coercion, to motivate people to achieve goals (Aboramadan & Kundi, 2020; An et al., 2020). Leadership is the ability of a person to influence the behavior of others, both higher and lower than him, in thinking and acting so that behavior that may initially be individualistic and egocentric turns into professional behavior (Bäker et al., 2020; Gagné et al., 2020).
Work Culture
The culture of work originated, and the word culture and work, the word culture in the Indonesian language, is the same as culture (Antonova et al., 2020; Bartosh et al., 2020). Therefore, the understanding of culture is the whole system of ideas, actions, and work of human beings in the framework of people's lives that belong to human beings by learning. States that culture is a configuration of the behavior studied and the results of behavior, whose constituent elements are supported and passed on by certain communities (Akhmetshina et al., 2020; Husnutdinov et al., 2020). Work culture as a conjecture and belief contained by company members, developed as they learn to overcome issues of external adaptation and internal integration (Bezugly et al., 2020; Borzenko et al., 2020).
Cultural Functions
Explains that the company has a personality, as do individuals. That personality is corporate culture. Culture implies the presence of certain dimensions or characteristics that are closely related and interdependent (Amangeldiyeva et al., 2020; Chambers et al., 2020). Thus the dimensions for a company must clearly be striking that can be defined and measured. Therefore Gitosudarmo further confirms there are 10 (ten) main characteristics that can be a differentiator of corporate culture, such as the following: Individual initiatives. The level of responsibility, freedom, and independence that the individual has, Tolerance of risky actions. The extent to which members of the company are encouraged to act aggressively, innovatively, and take risks, Direction. The extent to which the company clearly creates goals and expectations regarding achievements, Integration. The extent to which units within the company are encouraged to work in a coordinated manner, support from management.
Cultural Elements
Work culture is a component of human quality that is very attached to the identity of the world nation to be the basic benchmark in development. So it can be said that the work culture, according to Thoha is a philosophy based on the view of life as values that become traits, habits, and driving forces, cultivating in the life of a community or company, then reflected from attitudes into behaviors, beliefs, ideas, opinions, and actions that manifest as "work" or "Work" (Evans et al., 2020; Evstratova et al., 2020).
Performance
Performance as the result of quality work achieved by an employee in carrying out his duties following the responsibilities given to him. After studying the various definitions of performance provided by the experts mentioned above, the author defines the performance or description or appearance of work achievements and productivity achieved by a person, especially employees or employees (Aarrevaara et al., 2017; Adekunle, 2019). Work performance can be measured by indicators of the number of products produced; the time is given to the company, and the quality of the work (Gil, 2016; Lingard et al., 2017). Furthermore, productivity can be measured by indicators of the quantity of results achieved in the results. Measurable performance is not limited to the work of an institution or company but also individual performance.
Frame of Mind
In this study, the authors explained the frame of thought used to determine each free variable (variable X) on bound variables (variable Y). The frame of thought in the research can be described as follows:

Figure 1 : The Frame of Mind
X1 = Leadership (independent variable)
Y = Performance (dependent variable)
rx2y= Structural parameters of x2 effect on y
? = (Epsilon) other factors not studied
X2 = Work Culture (independent variable)
rx1y=Structural parameters of x1 effect on y
Rx1x2y=Structural parameters of x1 and x2 jointly against y
Hypothesis
The hypotheses that the authors proposed in this study are as follows: There is a leadership influence on performance in state-owned public companies, there is an influence of work culture on performance in state-owned public companies, there is an influence of leadership and a culture of work together on the performance of state-owned public companies
Research Methodology
Research Design
This research is descriptive quantitative, namely explaining the relationship between variables by analyzing numerical data using statistical methods through hypothesis testing (Juanamasta, Wati, Hendrawati, Wahyuni, Pramudianti, Wisnujati, Setiawati, Susetyorini, Elan, Rusdiyanto, Muharlisiani et al., 2019; Kunaifi et al., 2021; Luwihono, Suherman, Sembiring, Rasyid, Kalbuana, Saputro, Prasetyo, Taryana, Suprihartini, Asih et al., 2021; Prabowo et al., 2020b; Prasetyo et al., 2021; Rusdiyanto, Agustia, et al., 2020; Rusdiyanto, Hidayat et al., 2020; Rusdiyanto et al., 2021; Shabbir et al., 2021; Susanto, Prasetyo, Indrawati, Aliyyah, Rusdiyanto, Tjaraka, Kalbuana, Syafi’ur Rochman, et al., 2021), (Juanamasta, Wati, Hendrawati, Wahyuni, Pramudianti, Wisnujati, Setiawati, Susetyorini, Elan, Rusdiyanto, Astanto, et al., 2019; Rusdiyanto & Narsa, 2019; Gazali, Kusuma, Aina, Bustaram, Amar et al., 2020; Syafii et al., 2020; Lamtiar et al., 2021; Gazali, Kusuma, Aina, Bustaram, Risal et al., 2020; Rusdiyanto, Sawarjuwono et al., 2020; Muhammad Salman Shabbir et al., 2021; Susanto, Prasetyo, Indrawati, Aliyyah, Rusdiyanto, Tjaraka, Kalbuana, Rochman et al., 2021; Luwihono, Suherman, Sembiring, Rasyid, Kalbuana, Saputro, Prasetyo, Taryana, Suprihartini & Asih, 2021; Rahayu et al., 2020; Utari et al., 2020; Prabowo et al., 2020a; Astanto et al., 2020; Rusdiyanto, Mufarokhah et al., 2020; Rusdiyanto, Sawarjuwono et al., 2020; hidayat et al., 2020; Rusdiyanto & Narsa, 2020; Ulum et al., 2020; Rusdiyanto et al., 2019; Hidayat et al., 2020; Hadi Susanto et al., 2021; Woro Utari et al., 2020; Susanto, Prasetyo, Indrawati, Aliyyah, Rusdiyanto, Tjaraka, Kalbuana, Rochman et al., 2021). The research method used is a correctional survey method that is a study to study the dynamics of correlation between risk factors and effects by approach, observation, or data collection at once.
Population and Sample
The population is a generalization area consisting of objects or subjects with a certain quantity and characteristics applied by researchers to be studied and then drawn conclusions (Asikhia & Naidoo, 2020; Gordon, 2020). So the population is not only people but also other natural objects. The population is also not just the number of objects/subjects studied but covers all characteristics/properties owned by the subject or object. The population is employees of state-owned public agency companies, as many as 125 people.
While the sample of the population whose characteristics are considered to represent the entire population. To determine the number of samples to be taken, used Slovin formula, that is:
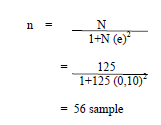
Description
n=Number of samples
N=Population size
e=Error value=10 %
Through the calculation of the formula, Slovin obtained the number of samples of 56, Then draw samples from the population using simple random sampling techniques, namely sampling of population members conducted randomly regardless of the strata in that population.
Research Results and Discussion
In this study, the variables used were two free variables and one bound variable. The two free. variables are leadership (X1) and work culture (X2). While the variable that is used as a bond is performance (Y). The number of research sources analyzed based on questionnaires declared valid and reliable as many as 15 points of statement for each variable. The validated score calculation process is done using computer tools. This is intended to avoid errors in calculating scores so that research can be scientifically accounted for. For more details, the results of a complete analysis of research data can be examined in the attached sheet. To give a clearer picture, the characteristics of the description of research variable data can be described as follows:
Leadership Variables
From the statements made by respondents in the poll given to the leadership percentage of questions as follows: (18,69 %) respondents expressed their strongly agreed 157, (39,88 %) respondents agreed 335, (32,26 % ) respondents expressed disapproval 271, (8,1 %) respondents expressed their disapproval 68, (1,07%) respondents expressed strongly disapproval 9. Based on the figures above, it can be concluded that most respondents agree with the leadership in improving performance in State-Owned Public Agency Companies can be seen in the table below.

Figure 2 :% Frequency of Respondents' Leadership Statements
From the diagram above, it can be seen that as many as 39.88% of respondents said they agree with the leadership in improving performance in state-owned public bodies. The summary of the leadership variable data as one of the factors that affect the performance of state-owned public institutions can be seen in the following table after calculation of 56 respondents sampling. Based on the results of data collection through questionnaires, leadership variables (X1), as one of the factors that affect the performance of publicly owned companies, have: Mean: 55.0536, Standar Deviasi: 7.78675, Range: 39, Minimum: 30, Maksimum: 69 To clarify, the picture of the statistical data of leadership variables (X1) can be seen from the histogram as follows:

Figure 3 : Histogram of Respondents' Leadership Statements
Work culture variables
From the statements made by the respondents in the poll given to the work culture percentage of the questions as follows: (30,48 %) respondents expressed their strongly agreed 256, (40,12 %) respondents agreed 337, (18,33 %) respondents expressed disapproval 154, (10,36 %) respondents expressed their disapproval 87, (0,71%) respondents expressed strongly disapproval 6, ased on the figures above, it can be concluded that most respondents agree with the work culture in improving performance in state-owned public bodies can be seen in the table below:

Figure 4 : % Respondent Frequency Work Culture Statement
From the diagram above, it can be found that as many as 40.12% of respondents said they agree with the work culture in improving performance in state-owned public bodies. After the calculation of the answers given by 56 people who were sampled in the study, the summary of work culture variable data as one of the factors that affect the performance of publicly owned companies.
Based on the results of data collection through questionnaires, work culture variables (X2) as one of the factors that affect the performance of publicly owned companies, have: Mean: 58.3929, Standar Deviasi: 7.95139, Range: 38, Minimum: 33, maksimum: 71. To clarify the description of the statistical data of work culture variables (X2), can be seen from the histogram as follows:

Figure 5 : Histrogram Frequency Distribution of Work Culture Variables (X2)
Performance Variables
From the statements made by respondents in the questionnaire given to the performance of the percentage of questions as follows: (29,05 %) respondents expressed their strongly agreed 244, (37,74 %) respondents agreed 317, (20,59 % ) respondents expressed disapproval 173, (12,14 %) respondents expressed their disapproval 102, (0,48%) respondents expressed strongly disapproval 4, Based on the figures above, it can be concluded that most respondents agree with the performance of.

Figure 6 : % Respondent Frequency Performance Statement
From the diagram above, it can be found that as many as 37.74% of respondents said they agree with leadership and work culture in improving performance in state-owned public bodies. After the calculation of the answers given by 56 people who sampled the research, then the summary of performance variable data on state-owned public agency companies.
Based on the results of data collection through questionnaires, performance variables in state-owned public agency companies, have: Mean: 57.4107, Standar Deviasi: 7.94247, Range: 38, Minimum : 34, Maksimum: 72. To clarify the description of the statistical data of performance variables (Y), can be seen from the histogram as follows:

Figure 7 : Frequency Distribution Histrogram Performance Variables (Y)
Data Analysis
Validity and Reliability Test
Reliability and validity tests on raw data were conducted to check the consistency of measuring instruments and the validity of each questionnaire. To obtain accurate calculation results, the calculation process using a computer, the results are as follows:
Validity Test: A validity test is used to determine whether an indicator of a variable is declared valid or valid to be used as a measuring instrument for that variable. The test is performed benchmarking between the value of r table and r calculate, if the value of r calculate is greater than r table then the indicator is declared valid. R of the table is obtained by using the product-moment table, at n=56 and the probability of 0.05, so it is obtained by 0.266. While r count obtained from the results of respondents' answers that have been processed with the SPSS program with an output named Corrected Item - Total Correlation.
Work Culture Variables (X2).
From the validity test result shows the value of r calculate performance variable is greater than the value of r table. Thus, the questionnaire used by each variable is declared valid to be used as a variable measuring instrument.
Reliability Test: An instrument (questionnaire) is said to be reliabel if a person's answer to a question is consistent or stable over time. Reliability testing in this study is using cronbach alpha. Reliability test results for each variable can be seen in the following table
| Table 1 Coefficent of Reliability |
||
|---|---|---|
| No. | Variable | Coefficient of Reliability (Alpha) |
| 1 | Leadership (X1) | 0.864 |
| 2 | Work culture (X2) | 0.826 |
| 3 | Performance (Y) | 0.819 |
The result of The Coefficient of Reliability (Alpha) stated in the table above, it can be said that the instrument used reliably, meaning an instrument that can be trusted to be used as a data collection tool or measure objects that have been set because the instrument is classified as good where the coefficient of reliability alpha>of alpha correct it alpha item correlation.
Multiple Regression Equations
The results of data analysis with the help of computer processing based on calculations obtained multiple regression equations as follows:
?=a+b1X1+b2X2
?=29,681+0,497 X1 + 0,537 X2
The equation above means : A constant of 29,681 states that if there is no leadership value (X1) and work culture (X2), then the performance (Y) is 29,681, The regression coefficient of 0.497X1 states that each addition of 1 (one) value in the leadership variable (X1) will increase the performance variable (Y) by 0.497 times in constants of 29,681, The regression coefficient of 0.537X2 states that each addition of 1 (one) value in the work culture variable (X2) will increase the performance variable (Y) by 0.537 times in the constant of 29,681.
Hipótesis Testing
The formulation of the hypothesis to be tested is given the symbol H0, while for the alternative hypothesis is given the symbol Ha. Statistical hypothesis testing for the first and second hypotheses was conducted with Ttest, while the third hypothesis was conducted with Test F.
First Hypothesis Testing: The decisions taken are as follows: ho: b1=0; no leadership influence on performance in publicly owned public bodies, Ha: b1 ? 0; there is a leadership influence on the performance of publicly owned companies.
The basis of decision making is to compare t-count with t-table is as follows: If tcount<ttable then Ha is accepted, ho is rejected, If tcount<ttable then Ha is accepted, ho is rejected
With the results of spss program processing obtained tcount value and significance as follows:
| Table 2 Testing Hypothesis T Test for X1 |
|||
|---|---|---|---|
| Equation | tcount Value | ttable Value | Sig. |
| Leadership (X1) Towards Performance (Y) | 2,497 | 2,000 | 0,000 |
Based on the table above, the tcount value of leadership variable (X1) is 2,497, while the ttable in ? (0.05) is 2,000. Thus tcount>ttable, so clearly ho was rejected and Ha accepted. This indicates that leadership has a significant influence on performance in state-owned public bodies, To clarify the description of t hypothesis testing for leadership variables (X1) can be seen in the t hypothesis curve image below:

Figure 8 : First Hypothesis Curve
Second Hypothesis Testing, the decisions taken are as follows: Ho: b2=0; there is no influence of work culture on performance in publicly owned companies. Ha: b2 ? 0; there is an influence of work culture on performance in state-owned public companies. The basis of decision making is to compare tcount with ttable is as follows: If tcount<ttable then Ha is accepted, Ho is rejected, If tcount<ttable then Ha is accepted, Ho is rejected. With the results of spss program processing obtained tcount value and significance as follows:
| Table 3 Testing Hypothesis T Test for X2 |
|||
|---|---|---|---|
| Equation | tcount Value | ttable Value | Sig. |
| Work Culture (X2) Towards Performance (Y) | 2,754 | 2,000 | 0,000 |
Based on the table above, the value of work culture variable tcount (X2) is 2,754, while the ttable in ? (0.05) is 2,000. Thus tcount>ttable, so clearly Ho was rejected and Ha accepted. This indicates that the work culture has a significant influence on performance in state-owned public bodies. To clarify the description of t hypothesis testing for work culture variables (X2) can be seen in the t hypothesis curve image below:

Figure 9 : Second Hypothesis T Test Curve
Third Hypothesis Testing, the decisions taken are as follows: Ho: b1=b2=0; there is no influence of leadership and a culture of work together on performance in state-owned public companies. Ha: one or both ba 0; there is an influence of leadership and a culture of work together on performance in state-owned public materials companies. The basis of decision-making is: If Fcount<Ftable then Ha is accepted, if Fcount>Ftable Then Ho was rejected.
| Table 4 F Test Hypothesis Testing. Dependent Variable: y, Predictors: (Constant), x2, x1 |
||||||
|---|---|---|---|---|---|---|
| ANOVAb | ||||||
| Model | Sum of Squares | Df | Mean Square | F | Sig. | |
| 1 | Regression | 1733.091 | 2 | 866.545 | 16.783 | .000a |
| Residual | 1736.463 | 53 | 51.631 | |||
| Total | 3469.554 | 55 | ||||
With the help of computer processing based on spss program calculation obtained Fcoun amounted to 16,783. While the critical price of Ftable value with free degree numerator 2 and denominator 53 in ? (0.05) is 3.18. Thus tcount>Ftable, so clearly Ho was rejected and Ha accepted. This shows that together leadership and work culture can improve performance in state-owned public bodies. To clarify the description of the F hypothesis test above can be seen in the curve image below:

Figure10 : Distribtuion Hypothesis Curve
Discussion
The Influence of Leadership on Performance on state-owned public bodies. From the hypothetical test results obtained tcount value of 2,497, while ttable with ? 5% and sample (n=56) obtained ttable of 2,000. Thus tcount> ttable, then Ho was rejected and h1 accepted. This means that there is a positive and significant influence of leadership on performance on state-owned public bodies.
The Influence of Work Culture on Performance on publicly owned companies. From the hypothetical test results obtained tcount value of 2,754, while ttable with ? 5% and sample (n=56) obtained ttable of 2,000. Thus tcount>ttable, then Ho was rejected and h1 accepted. This means that there is a positive and significant influence of work culture on performance on state-owned public bodies.
The Influence of Leadership and Work Culture with Performance on state-owned public bodies. From the calculation result obtained Fcount value of 16,783, while Ftable with ? 5% and sample (n=56) obtained Ftable of 3.18. Thus Fcount (16,783)>Ftable (3.18), then Ho was rejected and h1 accepted. This means that there is a positive and significant influence of leadership and a culture of work together with performance on state-owned public bodies.
Conclusion
There is a positive influence between leadership and performance. From the hypothetical test results obtained tcount value of 2,497, while ttable in ? 5% obtained by 2,000. Thus tcount>ttable, then Ho was rejected and h1 accepted. This means that there is a positive and significant influence of leadership on performance in state-owned public bodies. There is a positive influence between work culture and performance in state-owned public companies. From the hypothetical test results obtained tcount value of 2,754, while>ttable in ? 5% obtained by 2,000. Thus tcount>> ttable, then Ho was rejected and h1 accepted. This means that there is a positive and significant influence of work culture on performance on state-owned public bodies.
There is a positive influence between leadership and a culture of work together on performance in state-owned public bodies. From the calculation obtained F-count value of 16,783, while Ftable obtained by 3.18. Thus F-count (16,783)>Ftable (3.18), then Ho was rejected and h1 accepted. This means that there is a positive and significant influence of leadership and a culture of work together on the performance of the companies.
References
- Aarrevaara, T., Wikström, J., & Maassen, P. (2017). External stakeholders and internal practices in departments of teacher education at European universities. Higher Education Quarterly, 71(3), 251-262.
- Aboramadan, M., & Kundi, Y.M. (2020). Does transformational leadership better predict work-related outcomes than transactional leadership in the NPO context? Evidence from Italy. Voluntas, 31(6), 1254-1267.
- Adekunle, T.O. (2019). Summer performance, comfort, and heat stress in structural timber buildings under moderate weather conditions. Smart and Sustainable Built Environment, 8(3), 220-242.
- Afanasyev, V.Y., Lyubimova, N.G., Ukolov, V.F., & Shayakhmetov, S.R. (2019). Digitalization of energy manufacture: Infrastructure, supply chain strategy and communication. International Journal of Supply Chain Management, 8(4), 601-609.
- Bäker, A., Bech, M., Geerts, J., Maigaard Axelsen, S., Ullum, H., Krabbe, M.P., & Goodall, A.H. (2020). Motivating doctors into leadership and management: A cross-sectional survey. BMJ Leader, 4(4), 196-200.
- Bani-Melhem, S., Mohd. Shamsudin, F., Mazen Abukhait, R., & Quratulain, S. (2020). Paranoid personality and frontline employee’s proactive work behaviours: A moderated mediation model of empathetic leadership and perceived psychological safety. Journal of Service Theory and Practice, 31(1), 113-135.
- Chambers, J., Quinlan, M.B., Evans, A., & Quinlan, R.J. (2020). Dog-human coevolution: Cross-cultural analysis of multiple hypotheses. Journal of Ethnobiology, 40(4), 414-433.
- de Mol, E., Cardon, M.S., de Jong, B., Khapova, S.N., & Elfring, T. (2020). Entrepreneurial passion diversity in new venture teams: An empirical examination of short- and long-term performance implications. Journal of Business Venturing, 35(4).
- Durrant, J.H. (1991). Safety management in drilling operations. SPE Asia-Pacific Conference.
- Edikhanov, I.Z., Nabiullina, G.A., Latypov, R.I., & Karahan, A. (2020). Rules of speech behavior in tatar and Turkish proverbs. International Journal of Criminology and Sociology, 9, 2450-2456.
- Freihat, S. (2020). The role of transformational leadership in reengineering of marketing strategies within organizations. Problems and Perspectives in Management, 18(4), 364-375.
- Gazali, Kusuma, A., Aina, M., Bustaram, I., Amar, S.S., Rusdiyanto, Tjaraka, H., & Panjilaksana, S.D.D. (2020). The effect of financial performance on stock prices: A case study of Indonesian. Talent Development and Excellence, 12(1), 40074016.
- Gazali, K.A., Aina, M., Bustaram, I., Risal, Z., Purwanto, R., & Tjaraka, H. (2020). Work ethics of madura communities in salt business : A case study Indonesian. Talent Development and Excellence, 12(1), 3537-3549.
- Hadi, S., Indra, P., Trisa, I., Nabilah, A., & Rusdiyanto, H.T. (2021). The impacts of earnings volatility, net income and comprehensive income on share Price: Evidence from Indonesia Stock Exchange. Accounting, 7(5), 1009-1016.
- Hidayat, W., Soetedjo, S., Tjaraka, H., Septiarini, D.F., Herli, M., Ulum, B., ... & Rahayu, D.I. (2020). The effect of macroeconomics on equity prices: An Indonesian case study. ESPACIOS magazine, 41(17).
- Hidayat, W., Tjaraka, H., Fitrisia, D., Fayanni, Y., Utari, W., & Indrawati, M. (2020). The effect of earning per share, debt to equity ratio and return on assets on stock prices: Case study Indonesian. Academy of Entrepreneurship Journal, 26(2), 1-10.
- Juanamasta, I.G., Wati, N.M.N., Hendrawati, E., Wahyuni, W., Pramudianti, M., Wisnujati, N.S. (2019). The role of customer service through customer relationship management (Crm) to increase customer loyalty and good image. International Journal of Scientific and Technology Research, 8(10)..
- Juanamasta, I.G., Wati, N.M.N., Hendrawati, E., Wahyuni, W., Pramudianti, M., Wisnujati, N. S., & Setiawati, A.P. (2019). The role of customer service through Customer Relationship Management (CRM) to increase customer loyalty and good image. International Journal of Scientific and Technology Research, 8(10), 2004- 2007.
- Kunaifi, A., Rahman, F., Rosyid, A., Mansur, Masithoh, F.N., & Zainurrafiqi. (2021). Quantitative easing in overcoming the crisis: Criticism ofqeinthe monetary system of capitalism. Turkish Journal of Computer and Mathematics Education, 12(3), 3703-3714.
- Lamtiar, S., Arnas, Y., Rusdiyanto, A.A., Kalbuana, N., Prasetyo, B., & Kurnianto, B. (2021). Liquidity effect, profitability leverage to company value: A case study Indonesia. European Journal of Molecular & Clinical Medicine, 7(11), 2800-2822.
- Luwihono, A., Suherman, B., Sembiring, D., Rasyid, S., Kalbuana, N., & Saputro, R. (2021). Macroeconomic effect on stock price: Evidence from Indonesia. Accounting, 7(5), 1189-1202.
- Luwihono, A., Suherman, B., Sembiring, D., Rasyid, S., Kalbuana, N., & Saputro, R. (2021). Macroeconomic effect on stock price.
- Prabowo, B., Rochmatulaili, E., Rusdiyanto, & Sulistyowati, E. (2020a). Corporate governance and its impact in company’s stock price: case study. Utopia y Praxis Latinoamericana, 25(Extra10), 187-196.
- Prabowo, B., Rochmatulaili, E., Rusdiyanto, & Sulistyowati, E. (2020b). Corporate governance and its impact in company’s stock price: Case study. Utopia y Praxis Latinoamericana, 25(Extra10), 187-196.
- Prasetyo, I., Aliyyah, N., Rusdiyanto, Tjaraka, H., Kalbuana, N., & Rochman, A.S. (2021). Vocational training has an influence on employee career development: A case study Indonesia. Academy of Strategic Management Journal, 20(2), 1-14.
- Rahayu, D.I., Ulum, B., Rusdiyanto, Syafii, M., Pramitasari, D.A., & Tuharea, F.I. (2020). Fundamental impact on share prices: Evidence from indonesia. PalArch’s Journal of Archaeology of Egypt/ Egyptology, 17(6), 9090-9104.
- Rusdiyanto, A.D., Soetedjo, S., & Septiarini, D.F. (2020). The effect of cash turnover and receivable turnover on profitability. Opcion, 36(Special Ed), 1417-1432.
- Rusdiyanto, H.T., Mufarokhah, N., Al’asqolaini, M.Z., Musthofa, A.J., Aji, S., & Zainab, A.R. (2020). corporate social responsibility practices in islamic studies in Indonesian. Journal of Talent Development and Excellence, 12(1), 3550-3565.
- Rusdiyanto, H.W., Fayanni, Y., Rahman, M.A., Rosyidi, A.A., & Khadijah, S.N. (2021). Customer satisfaction is effected by the quality of service: A case study Indonesian. Turkish Journal of Computer and Mathematics Education, 12(3), 3560-3567.
- Rusdiyanto, H.W., Tjaraka, H., Septiarini, D.F., Fayanni, Y., & Utari, W. (2020). The effect of earning per share, debt to equity ratio and return on assets on stock prices: Case study Indonesian. Academy of Entrepreneurship Journal, 26(2), 1-10.
- Rusdiyanto, & Narsa, I.M. (2020). The effect of company size, leverage and return on asset on earnings management : Case study indonesian. Espacios, 41(17), 25.
- Rusdiyanto, R., Agustia, D., Soetedjo, S., Septiarini, D.F., Susetyorini, S., & Elan, U. (2019). Effects of sales, receivables turnover, and cash flow on liquidity.
- Rusdiyanto, R., & Narsa, I.M. (2019). The effects of earnigs volatility, net income and comprehensive income on stock prices on banking companies on the indonesia stock exchange. International Review of Management and Marketing, 9(6).
- Rusdiyanto, S.T., & Tjaraka, H. (2020). Interpret the shari ’ ah accounting practice in Indonesian. Talent Development and Excellence, 12(3), 2420-2433.
- Shabbir, M.S., Mahmood, A., Setiawan, R., Nasirin, C., Rusdiyanto, R., & Gazali, G. (2021). Closed-loop supply chain network design with sustainability and resiliency criteria. Environmental Science and Pollution Research.
- Shabbir, Muhammad, S., Mahmood, A., Setiawan, R., Nasirin, C., & Rusdiyanto, R. (2021). Closed-loop supply chain network design with sustainability and resiliency criteria. Environmental Science and Pollution Research.
- Susanto, H., Prasetyo, I., Indrawati, T., Aliyyah, N., Rusdiyanto, R., & Tjaraka, H. (2021). The impacts of earnings volatility, net income and comprehensive income on share Price: Evidence from Indonesia Stock Exchange. Accounting, 7(5), 1009-1016.
- Susanto, H., Prasetyo, I., Indrawati, T., Aliyyah, N., Rusdiyanto, & Tjaraka, H. (2021). The impacts of earnings volatility, net income and comprehensive income on share price: evidence from Indonesia stock exchange. Accounting, 7(5), 1009-1016.
- Syafii, M., Ulum, B., Rusdiyanto, S.P., Rahayu, D.I., & Syasindy, N.B. (2020). The effect of financial performance on the company’s share price: A case study Indonesian. European Journal of Molecular and Clinical Medicine, 7(8), 1055-1071.
- Ulum, B., Rusdiyanto, M.S., Rahayu, D.I., & Pramitasarisari, D.A. (2020). Profitability impact on company share prices: A case study indonesian. Solid State Technology, 63(6), 1672-1683.
- Utari, W., Setiawati, R., Fauzia, N., Hidayat, W., Khadijah, S.N., Pramitasari, D.A., & Irawan, H. (2020). The effect of work discipline on the performance of employees in compensation mediation : A case study indonesia. Palarch’s Journal of Archaeology of Egypt/egyptology, 17(9), 1056-1073.