Research Article: 2021 Vol: 20 Issue: 2S
Pharmaceutical Expenditure and Gross Domestic Product: The Case of North Cyprus
Ahmet Ça?er, Girne American University
Dilber Ça?lar Onba??o?lu, Girne American University
Abstract
Pharmaceutical industry is an important source of growth in many countries. This paper investigates the effect of pharmaceutical spending on Gross Domestic Product (GDP) in North Cyprus economy over the period 2008 and 2018. In the process of carrying out this research work, various variables such as gross domestic product (and per capita), current health expenditure per capita, external health expenditure per capita, life expectancy, population, gross capital formation, pharmaceutical expenditure, import are adopted and the Augmented Dickey Fuller test (ADF) for unit root test, Correlation analysis, Bound test and Autoregressive Distributed Lag Model (ARDL) are used in the estimation of the pharmaceutical expenditure on economy. The results refers that the external health expenditure per capita and gross capital formation was statistically significant to the Gross Domestic Product Per Head (GDDPC) in North Cyprus and there is unidirectional causality from Import (IMP) through the Gross Domestic Product (GDP).
Keywords
Pharmaceutical Industry, GDP, Health Expenditure, Capital Formation, Unidirectional Causality, North Cyprus.
Introduction
Public institutions, especially of developing countries, are faced with a lack of financial resources, which is why they encounter difficulties regarding delivering high-price drugs as preventative or curative medicines to citizens due to patent protection, particularly to disadvantaged individuals and groups. Both at the national and international level, this scenario lead to great social injustice. As a result, these problems are increasing the ethical obligations of the pharmaceutical companies.
The pharmaceutical industry is an industrial field that provides therapeutic treatment by producing synthetic, vegetable, animal and biological chemical substances used for therapeutic, preventive and diagnostic purposes in human and veterinary medicine in accordance with pharmaceutical technology. One of the greatest social responsibilities of today's governments is to deliver health care services to their citizens in a quality and effective manner in order to protect and sustain public health. The fulfillment of this responsibility is only possible with a strong and effective pharmaceutical sector. Besides providing significant contributions in terms of economic development, it is also necessary to have a pharmaceutical industry capable of producing pharmaceuticals that meet the needs of the country in the face of factors such as war, epidemic diseases and possible embargo. (MIT, 2016) In addition to this, the sector provides high value-added products due to its involvement in intensive R&D activities. R&D activities in the pharmaceutical sector that allocates the most resources to R&D in the world are extremely important for sustainable economic growth. (TEPAV, 2015) The pharmaceutical sector is an industry with the potential to provide significant contributions to the economic development of an individual country in terms of its own sectorial characteristics as well as having a great social significance. The industry is at the forefront of the sectors with the highest R&D intensity. Pharmaceutical products are high value added products that are developed because of long and costly research and development activities. In the pharmaceutical industry where the technological changes are very fast, the products produced are under patent protection. The pharmaceuticals that make difference due to the production technology, the activity or the type of treatment can provide serious market share to patent holders in a short period. Hence, having an effective and strong pharmaceutical sector will contribute to the increase of R&D activities, export and economic development by creating value-added and high-tech products. Another feature of the sector is that there are many serious regulations and rules in almost every field. Pre-clinical and post-clinical studies have been regulated by steps such as regulatory, production, pricing and sales, standards set by international organizations, legal regulations of countries and serious regulations within the framework of social security policies. In addition to intensive R&D activities, these regulations are among the causes that increase pharmaceutical development costs and prolong investment processes.
Factors such as increasing world population and average life expectancy, new diseases and new treatment methods, demographic changes and the requirements of being a welfare state constantly increase the need for health services and pharmaceutical industry. In addition to the mentioned social benefits, the pharmaceutical industry is a knowledge-intensive industry with high value-added products, with a potential to contribute positively to countries' economic development, technology transformation and foreign trade performance. These social and economic benefits have played an important role in the growth of the world pharmaceutical industry and its market.
This study attempts to contribute to existing literature in two ways. There is extensive literature regarding the modeling and empirical investigation on the pharmaceutical industry by considering their performance or developments but we will consider the impact of the industry on GDP. We will use a popular techniques as ADF, co-integration test, OLS, ECM and ARDL to determine the importance’s of this sector in North Cyprus Economy. Secondly there are some analysis related with other countries but there are no studies being undertaken to study Pharmaceutical industry in North Cyprus. Therefore this study is very important for two reasons; there is almost no such empirical study in the literature and based on this sector no study has been done on North Cyprus.
General View of the Turkish Republic of Northern Cyprus Economy
Cyprus is the third largest island with 9,251 square kilometres in the north east of the Mediterranean. Northern Cyprus has a population of 350,000 (estimated) (DPO, 2021) and economy has the characteristics of an island economy. The limited natural resources, transportation and energy problems are the most typical problems arising from being an island economy. Similar to other small island economies, because of a small size and narrow resource bases North Cyprus has long had limited economic growth. Another important problem of these is due to the diplomatic recognition by other countries except Turkey.
Like all developing countries, drug expenditures have an important place in the health expenditures of the society in North Cyprus. However, there has not been any comprehensive study to determine drug expenditures and drug profile in the country. In this study, it is aimed to determine the effect of the country's drug expenditures and drug use on economic growth between 2008-2018 by evaluating the data of the Ministry of Health and the Ministry of Trade. The results of the study will guide the health authority in determining the health and drug policies of the country and shed light on the regulations to be made for rational use of limited budget opportunities and consequently the rational use of drugs.
When we compare with other developing countries in terms of health, it can be said that health services in Northern Cyprus are at a more advanced level than many developing countries. The Drug and Pharmacy Department established under the Ministry of Health in North Cyprus is the institution that responsible for the administration of pharmaceutical and pharmacy-related services and the implementation of the laws related to drugs and pharmacy. Due to the underdeveloped local pharmaceutical industry, the majority of the country's drug needs are met by drugs imported from abroad, and a small amount is met by locally produced drugs. Nowadays, there are 24 Pharmacy warehouses and 358 Pharmacies operating in Northern Cyprus.
There have been very few studies in the literature showing the impact of the pharmaceutical industry on economic growth. Most of the studies conducted are related to the development of the pharmaceutical industry. Despite the limited number of studies have been done related with pharmaceutical industry no studies have been done with Cyprus.
Shaikh & Gandjour (2018) analyzed 136 countries using a two?step instrumental variable procedure with the aim of estimating income elasticity of government pharmaceutical spending, and the assessment of synchronized effect of such spending on income itself during the period from 1995 to 2006. Firstly they estimate the effect of GDP on public pharmaceutical expenditure using tourist receipts as an instrument for GDP. Then step two involved the formation of an adjusted pharmaceutical expenditure series where the response of public pharmaceutical expenditure to GDP is partial led out and used as a tool for pharmaceutical expenditure. The result refers that GDP has a strong positive impact on pharmaceutical spending with elasticity in excess of unity in countries with low spending on pharmaceuticals and countries with large economic freedom. However, the outcomes of the second step show that public pharmaceutical spending has a negative effect on GDP per capita particularly in countries with limited economic freedom; when the quantitatively large reverse effect of GDP is accounted for.
Muratoglu (2017) pointed out that there are only a few studies which have analyzed the relationship between growth and pharmaceutical industry from a trade-related perspective. He investigate the relationship between pharmaceutical industry exports and GDP with panel data models in order to test the relationship between pharmaceutical industry exports and GDP & GDP per capita in 27 countries between the period 2000 and 2014. The results revealed that pharmaceutical exports of the specialized countries affect both GDP and GDP per capita positively. High levels of export competitiveness in the pharmaceutical industry which heavily relies on the discovery and production of new drugs/medical products also contribute to the advancement of economy.
Kazzai, et al., (2017) investigate the impact of the Brexit on the UK pharmaceutical industry. In this research, there were five main zones which are contribution, legislative processes, regulatory processes, research outcomes and commercial risk. Mainly, study looked over the economy and pharmaceutical industry of Switzerland and Norway by comparing the models that they have been used and the results refer that negotiation of associated county status, bilaterally favorable trade agreements, minimal interruption to regulatory bodies and special protection for the movement of workforce needs to be prioritized.
Research Methodology
Theoretical Framework of Model
The framework used in this study follows a public choice approach similar to that used by Hewitt (1991, 1992, 1993); Davoodi, et al., (2001); Nyamongo (2007); Akanbi & Schoeman (2010). The model analyses the relationship between the effects of pharmacies expenditure and economic growth towards customer satisfaction in the Turkish Republic of Northern Cyprus (TRNC).
In an effort to study the effect of pharmacies in the Turkish Republic of Northern Cyprus (TRNC) on the economy based on customer satisfaction, it becomes important to develop a model to justify the relationship that exists between each of the variables. There will be two models to be drawn for the variables.
Assuming the function is given as follows:
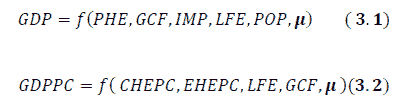
Econometric Model;
Model 1:

Model 2:

Relevant variables are defined as follows:

GDP= Gross Domestic Product
GDPPC=Gross Domestic Product per capita
PHE=Pharmaceutical Expenditures
GCF=Gross Capital Formation
IMP=Imports of Goods and Services
LFE=Life Expectancy
POP=Population
CHEPC=Current Health Expenditure per capita
EHEPC=External Health Expenditure per capita
μ= Error term, White noise, Stochastic term
Economic A-Priori Expectation
It is expected that current and external health expenditure per capita should have a positive relationship/effect to the gross domestic product per capita in TRNC. It is also expected that there is a positive relationship between Gross Domestic Product and the population in the Turkish Republic of Northern Cyprus (TRNC).
Description (Identification of Variables)
Dependent Variable
Since there are two models in this research work, therefore there will be two dependent variables to be explained. One of the variables looks at the North Cyprus economy at large while the other looks at per head.
GDP= Gross Domestic Product
GDPPC=Gross Domestic Product per capita
Independent Variables
There are seven different independent variables in this study, they are:
PHE=Pharmaceutical Expenditures
GCF=Gross Capital Formation
IMP=Imports of Goods and Services
LFE=Life Expectancy
POP=Population
CHEPC=Current Health Expenditure per capita
EHEPC=External Health Expenditure per capita
Estimation Techniques
Unit Root
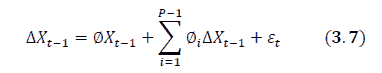
Given that, the initial step in carrying out a time series analysis is to test for stationarity of the variables. According to Gujarati (2003), the Augmented Dickey Fuller (ADF) test entails running a regression of the form:

Where Δ= the change operator; Zt=variable series (Gross Domestic Product (GDP), Gross Domestic Product Per Capita (GDPPC), Pharmaceutical Expenditure (PHE), Gross Capital Formation (GCF), Import (IMP), Life Expectancy (LFE), Population (POP), Current Health Expenditure Per Capita (CHEPC), and External Health Expenditure Per Capita (EHEPC) are being investigated for stationarity);
Zt-1=lagged values of variables; t=time variable and ?tis the white noise error.
The null hypothesis that δ=0 means existence of a unit root in Ztor that the time series is non-stationary.
The decision rule is that if the computed ADF statistics is greater than the critical at the specified level of significance, then the hull hypothesis of unit root is accepted otherwise it is rejected. In other words, if the value of the ADF statistics is less than the critical values, it is concluded that Zt is stationary i.e. Zt~ I(0). When a series is found to be non-stationary, it is first-differenced (i.e. the series: ΔZt=Zt - Zt-1is obtained and the ADF test is repeated on the first-differenced series. If the null hypothesis of the ADF test can be rejected for the first differenced series, it is concluded that Zt ~ I(1).
Co-integration
Johansen’s Co Integration Test
The Johansen’s co-integration tests are very sensitive to the choice of lag length. Firstly, a VAR model is fitted to the time series data in order to find an appropriate lag structure. The Akaike Information Criterion (AIC) was used to select the number of lags required in the co-integration test. The lagged terms are included to ensure that the errors are uncorrelated. The number of lagged difference terms to be included can be chosen based on t-test.
F-test or the Akaike’s Information Criterion (AIC) (Greene, 1993). The null hypothesis is that the variable yt is a non-stationary series (H0: β=0) and is rejected when â is significantly negative (Ha: β<0). The null hypothesis is that the variable yt is a non-stationary series
(H0: β=0) and is rejected when β is significantly negative (Ha: β<0). If the calculated ADF statistic is higher than McKinnon’s critical values, then the null hypothesis (H0) is not rejected and the series is non-stationary or not integrated of order zero I(0).
In line with the Johansen (1988) cointegration estimation technique, as set out in Enders (2004:348), Cholesky decomposition is used for orthogonalisation, which means that the Cholesky factor is lower triangular. Therefore, each variable in the vector is allowed to react contemporaneously to all variables above it. A vector error correction model (VECM) of the following form is estimated to reveal the short-run dynamics:
Augmented OLS ‘‘Lending Variables’’
The estimation procedure is as follows: Firstly, the reduced-form VAR is estimated and all the diagnostic tests are performed. Secondly, the Johansen co-integration test is performed and the co-integrating vectors and loading matrices are identified. Thirdly, a VECM is estimated and the entire range of diagnostic tests is performed.
Engle-Granger Error Correction Procedure
This study employed the Engle and Granger (1987) approach to ECM which consist of three steps: the first step is the estimation of the co-integrating regression
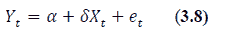
from these estimate, the residual term was generated.
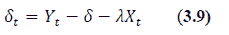
and the residual term was included in the short term equation as shown in equation (8):

Where
Yt=dependent variable; Xt= explanatory variables; et= residual error term; δt=estimated residual term; error correction term.
Sources of Data
For arriving at dependable and unbiased analysis, secondary data for Turkish Republic of Northern Cyprus (TRNC) were employed. Many of the dataset adopted were obtained from the TRNC State Planning Organization (DPÖ). The variables gotten from the DPÖ includes; gross domestic product (GDP), gross domestic product per capita (GDPPC), gross capital formation (GCF), imports of goods and services (IMP), population (POP), current health expenditure per capita (CHEPC), external health expenditure per capita (EHEPC), and life expectancy (LFE). While pharmaceutical expenditures (PHE), and population (POP), were gotten were gotten for a period of 10 years.
Methodology and Empirical Results
This chapter empirically analysis the model specified in chapter three, the presentation of result and the discussions of the results. This chapter attempts to provide answers to the objectives of the study; we start by presentation of the descriptive and correlation analysis then proceed to the result of the diagnostic test and the main estimation.
Empirical Results
| Table 1 Descriptive Statistics and Summary of Variables |
|||||||||
|---|---|---|---|---|---|---|---|---|---|
| CHEPC | EHEPC | LGDP | LGDPPC | LFE | LIMP | PHE | LGCF | LPOP | |
| Mean | 1858.352 | 14.07294 | 10.28823 | 4.353564 | 80.24337 | 10.10230 | 28145.50 | 9.524111 | 6.063117 |
| Median | 1886.632 | 18.23281 | 10.28837 | 4.359545 | 80.26400 | 10.06925 | 28235.00 | 9.546231 | 6.063193 |
| Maximum | 2114.669 | 21.57973 | 10.34805 | 4.395953 | 81.03072 | 10.21102 | 74300.00 | 9.668697 | 6.078665 |
| Minimum | 1616.549 | 3.428116 | 10.24130 | 4.310066 | 79.43000 | 10.03171 | -27360 | 9.366587 | 6.046344 |
| Std. Dev. | 161.8225 | 7.233817 | 0.034029 | 0.028841 | 0.530041 | 0.067664 | 25351.37 | 0.114230 | 0.010595 |
| Skewness | 0.014009 | -0.40946 | 0.328069 | -0.16083 | -0.06831 | 0.632932 | -0.48524 | -0.30134 | -0.07458 |
| Kurtosis | 1.922526 | 1.356786 | 2.203558 | 1.818752 | 1.824130 | 1.756366 | 4.227407 | 1.605981 | 1.876185 |
| Jarque-Bera | 0.484056 | 1.404498 | 0.443683 | 0.624504 | 0.583889 | 1.312098 | 1.020154 | 0.961046 | 0.535504 |
| Probability | 0.785034 | 0.495470 | 0.801043 | 0.731797 | 0.746810 | 0.518898 | 0.600449 | 0.618460 | 0.765098 |
| Sum | 18583.52 | 140.7294 | 102.8823 | 43.53564 | 802.4337 | 101.0230 | 281455.0 | 95.24111 | 60.63117 |
| Sum Sq. Dev. | 235678.6 | 470.9529 | 0.010422 | 0.007486 | 2.528495 | 0.041205 | 5.78E+09 | 0.117437 | 0.001010 |
| Observations | 10 | 10 | 10 | 10 | 10 | 10 | 10 | 10 | 10 |
Table 1 above, presents the summary of the descriptive statistics for the variables employed. Descriptive statistics are brief descriptive coefficients that summarize a given data set, which can be either a representation of the entire population or a sample of it. Descriptive statistics are broken down into measures of central tendency and measures of variability, or spread.
From the table, the averages of the variables are; 1,858.352, 14.073, 10.288, 4.354, 80.243, 10.102, 28,145.50, 9.524, and 6.063 for (CHEPC) Current Health Expenditure Per Capita, (EHEPC) External Health Expenditure Per Capita, (GDP) Gross Domestic Product, (GDPPC) Gross Domestic Product Per Capita, (LFE) Life Expectancy, (IMP) Import, (PHE) Pharmaceutical Expenditure, (GCF) Gross Capital Formation, and (POP) Population Respectively. The maximum values of the variables are; 2,114.669, 21.57973, 10.34805, 4.3960, 81.03072, 10.21102, 74,300, 9.668697, and 6.078665 for (CHEPC) Current Health Expenditure Per Capita, (EHEPC) External Health Expenditure Per Capita, (GDP) Gross Domestic Product, (GDPPC) Gross Domestic Product Per Capita, (LFE) Life Expectancy, (IMP) Import, (PHE) Pharmaceutical Expenditure, (GCF) Gross Capital Formation, and (POP) Population respectively. While the minimum values of the variables are; 1,616.8225, 3.428116, 10.24130, 4.31, 79.43, 10.03171, -27,360, 9.366587, 6.046344 (CHEPC) Current Health Expenditure Per Capita, (EHEPC) External Health Expenditure Per Capita, (GDP) Gross Domestic Product, (GDPPC) Gross Domestic Product Per Capita, (LFE) Life Expectancy, (IMP) Import, (PHE) Pharmaceutical Expenditure, (GCF) Gross Capital Formation, and (POP) Population Respectively.
The standard deviation showed that Pharmaceutical Health Expenditure (PHE) was the most volatile variable in the time series. This is followed by Current Health Expenditure Per Capita (CHEPC), External Health Expenditure Per Capita (EHEPC), Life Expectancy (LFE), Gross Capital Formation (GCF), Import (IMP), Gross Domestic Product (GDP), Gross Domestic Product Per Capita (GDPPC) and Population (POP). The skewness statistic from the table above revealed that all the variables were negatively skewed except Current Health Expenditure Per Capita (CHEPC), Gross Domestic Product (GDP), and Import (IMP) were positively skewed.
The kurtosis statistics showed Current Health Expenditure Per Capita (CHEPC), External Health Expenditure Per Capita (EHEPC), Gross Domestic Product (GDP), Gross Domestic Product Per Capita (GDPPC), Life Expectancy (LFE), Import (IMP), Gross Capita Formation (GCF), and population (POP) that were platykurtic because they are less than three(3) suggesting that the distribution is flat relative to normal distribution while pharmaceutical expenditure was leptokurtic, suggesting that the distribution was peaked relative to normal distribution.
The Jarque-Bera statistic rejected the null hypothesis of normal distribution for all the variables at five per cent critical value (5%) with exception to (INF) Inflation Rate and (REXT) Real Exchange Rate. For inflation rate and exchange rate, the Jarque-Bera statistic could not reject the null hypothesis of normal distribution for the variables at five per cent critical value.
The term Multicollinearity is due to Ragnar Frisch. Originally it meant the existence of a “perfect” or exact, linear relationship among some or all explanatory variables of a regression model. The tests were carried out using correlation matrix. According to Barry & Feldman (1985) criteria; “Multicollinearity is not a problem if no correlation exceeds 0.80”.
| Table 2 Correlation and Covariance Analysis |
|||||||||
|---|---|---|---|---|---|---|---|---|---|
| Covariance Analysis: Ordinary | |||||||||
| Sample: 2010 2019 | |||||||||
| Included observations: 10 | |||||||||
| Covariance Correlation | CHEPC | EHEPC | LGDP | LGDPPC | LFE | LIMP | PHE | LGCF | LPOP |
| CHEPC | 23567.86 | ||||||||
| 1 | |||||||||
| EHEPC | 516.1244 | 47.09529 | |||||||
| 0.489898 | 1 | ||||||||
| LGDP | 0.360685 | -0.14514 | 0.001042 | ||||||
| 0.072777 | -0.65513 | 1 | |||||||
| LGDPPC | 0.776098 | -0.11201 | 0.000858 | 0.000749 | |||||
| 0.184766 | -0.59653 | 0.971222 | 1 | ||||||
| LFE | -51.917 | -2.74578 | 0.007776 | 0.004334 | 0.252849 | ||||
| -0.67254 | -0.79569 | 0.478992 | 0.315027 | 1 | |||||
| LIMP | -3.83416 | -0.3841 | 0.001644 | 0.001239 | 0.028388 | 0.004121 | |||
| -0.38908 | -0.87192 | -0.79328 | 0.705281 | 0.879495 | 1 | ||||
| PHE | -1216919 | -108407 | 615.4655 | 481.5037 | 6967.779 | 1116.734 | 5.78E+08 | ||
| -0.32959 | -0.65682 | 0.792693 | 0.731717 | 0.576157 | 0.723354 | 1 | |||
| LGCF | 4.228781 | -0.39873 | 0.002937 | 0.00278 | 0.007088 | 0.003983 | 1462.23 | 0.011744 | |
| 0.254187 | -0.53615 | 0.839593 | 0.937654 | 0.130067 | 0.572621 | 0.561036 | 1 | ||
| LPOP | -1.0127 | -0.05484 | 0.000159 | 8.92E-05 | 0.005051 | 0.000569 | 140.3753 | 0.000144 | 0.000101 |
| -0.65627 | -0.79502 | 0.490983 | 0.324452 | 0.999358 | 0.881442 | 0.580669 | 0.132356 | 1 | |
Correlation is a statistical measure that expresses the extent to which two variables are linearly related. The table 2 summarizes the correlation analysis of the variables in the model. There is a perfect correlation between a variable to itself. Using the first model, Pharmaceutical Expenditure (PHE), Gross Capital Formation (GCF), Import (IMP), Life Expectancy (LFE), and Population (POP) had a positive correlation with Gross Domestic Product (GDP). While for the second model, Current Health Expenditure Per Capital (CHEPC), Life Expectancy (LFE), and Gross Capital Formation (GCF) had a positive correlation with the dependent variable of model 2. Only external health expenditure per capita had a negative correlation.
For model 1, the dependent variable is the Gross Domestic Product (GDP). Therefore, this part will be explaining the relationships of each of the independent variables to the dependent variable. The Pharmaceutical Expenditure (PHE) is seen to have a positive correlation with the Gross Domestic Product (GDP), meaning that as the pharmaceutical expenditure increases by 1%, then the gross domestic product also increases by proportional 79.33% as evident in the table above. Not only was the pharmaceutical expenditure had a positive relationship with gross domestic product but the gross capital formation had a positive correlation with the dependent variable of 83.96%. From this research study, it was seen that import had a negative correlation with gross domestic product, such that when import increases by 1%, the gross domestic product will reduce by 79.33%. Lastly, the population of Turkish Republic of Northern Cyprus has a positive correlation with the gross domestic product of the country.
In model 2, it could be deduced that the dependent variable is Gross Domestic Product Per Capita (GDPPC) amongst all other variables. The Current Health Expenditure Per Capita (CHEPC) has a positive correlation with the dependent variable such that a 18.48% increase in Gross Domestic Product (GDP) was a result of a percent increase in the Current Health Expenditure Per Capita (CHEPC). Also, the External Health Expenditure Per Capita (EHEPC) had a positive correlation alongside the Current Health Expenditure Per Capita (CHEPC). The life expectancy is obvious to be relatively stable in the Turkish Republic of Northern Cyprus (TRNC) such that this independent variable had a positive correlation with Gross Domestic Product Per Capita (GDPPC).
| Table 3 Unit Root Test Results |
|||||
|---|---|---|---|---|---|
| Variable | T Stat | P-value | T Stat | P-value | Order of Integration |
| LGDP | -2.3351 | 0.184 | -3.5493 | 0.0329* | I(1) |
| LGDPPC | -3.011 | 0.0755 | -3.9078 | 0.0311* | I(1) |
| CHEPC | -3.674 | 0.410* | -4.0004 | 0.0365 | I(0) |
| EHEPC | -0.8482 | 0.754 | -4.2097 | 0.0479* | I(1) |
| LFE | -3.5074 | 0.0314* | -4.0812 | 0.0292 | I(0) |
| LGCF | -1.4446 | 0.5076 | -3.5129 | 0.0476* | I(0) |
| LIMP | -0.8415 | 0.7494 | -4.3992 | 0.0384* | I(0) |
| LPOP | 1.3674 | 0.9953 | -5.9249 | 0.0033* | I(0) |
| PHE | -1.4011 | 0.5337 | -3.9702 | 0.0215* | I(0) |
From above, the test for Stationarity shows that only three of the variables were stationary at their first difference while the remaining six variables were stationary at levels. Amongst the variables that were stationary at levels are Current Health Expenditure Per Capita (CHEPC), Life Expectancy (LFE), Gross Capital Formation (GCF), and Import (IMP), Population (POP), and Pharmaceutical Expenditure (PHE). Also, the only three variables to be stationary at their first difference were; Gross Domestic Product (GDP), Gross Domestic Product Per Capita (GDPPC), and External Health Expenditure Per Capita (EHEPC). Because of this, the regression analysis or the estimated techniques that will be used is the Auto Regressive Distributed Lag Model (ARDL). In addition, for the purpose of this study, we will be considering the Error Correction Model (ECM) as well.
| Table 4 Ordinary Least Square (OLS) For Model 1 |
||||
|---|---|---|---|---|
| Variable | Coefficient | Std. Error | t-Statistic | Prob. |
| C | -96.8491 | 47.12684 | -2.05507 | 0.1091 |
| PHE | 3.36E-07 | 2.27E-07 | 1.479368 | 0.2131 |
| LGCF | 0.172185 | 0.151837 | 1.134016 | 0.3201 |
| LIMP | -0.07713 | 0.515151 | 0.14973 | 0.0482 |
| LFE | -0.4581 | 0.195022 | -2.34897 | 0.0786 |
| LPOP | 23.33258 | 10.49446 | 2.223324 | 0.0903 |
| R-squared | 0.954325 | Mean dependent var | 10.28823 | |
| Adjusted R-squared | 0.897231 | S.D. dependent var | 0.034029 | |
| S.E. of regression | 0.010909 | Akaike info criterion | -5.91475 | |
| Sum squared resid | 0.000476 | Schwarz criterion | -5.7332 | |
| Log likelihood | 35.57375 | Hannan-Quinn criter. | -6.11391 | |
| F-statistic | 16.71507 | Durbin-Watson stat | 1.216599 | |
| Prob(F-statistic) | 0.008714 | |||
| Dependent Variable: LGDP | ||||
| Method: Least Squares | ||||
| Sample: 2010 2019 | ||||
| Included observations: 10 | ||||
Bringing the model from equation 1 (from chapter 3), and substituting it with the table above, we would have something of this nature.

From the result in the table, it is only the coefficient of the constant intercept and the slope of the life expectancy and import that is seen to be negative. Reporting the adjusted, R-squared that has adjusted to various variations in the model shows that the goodness of fit is seen to be good at 89.72% (close to 1). In addition, the Durbin-Watson statistics is 1.22, which shows that the result is good. The probability value of import is <5% meaning that from the model, it was import (IMP) that was strictly a determinant of the gross domestic product (GDP). The prob value of the import is 0.0482, which is seen to be statistically significant at 5%.
| Table 5 Ordinary Least Square (OLS) For Model 2 |
||||
|---|---|---|---|---|
| Variable | Coefficient | Std. Error | t-Statistic | Prob. |
| C | 0.096707 | 1.253984 | 0.07712 | 0.9415 |
| CHEPC | 2.72E-05 | 3.25E-05 | 0.837784 | 0.4403 |
| EHEPC | 0.000739 | 0.001133 | 0.652384 | 0.543 |
| LFE | 0.024101 | 0.012475 | 1.931928 | 0.1112 |
| LGCF | 0.237495 | 0.049282 | 4.819137 | 0.0048 |
| R-squared | 0.939137 | Mean dependent var | 4.353564 | |
| Adjusted R-squared | 0.890447 | S.D. dependent var | 0.028841 | |
| S.E. of regression | 0.009546 | Akaike info criterion | -6.15853 | |
| Sum squared resid | 0.000456 | Schwarz criterion | -6.00723 | |
| Log likelihood | 35.79263 | Hannan-Quinn criter. | -6.32449 | |
| F-statistic | 19.28809 | Durbin-Watson stat | 1.886009 | |
| Prob(F-statistic) | 0.003059 | |||
| Dependent Variable: LGDPPC | ||||
| Method: Least Squares | ||||
| Sample: 2010 2019 | ||||
| Included observations: 10 | ||||

In model 2, the independent variables that formed up the equation were Current Health Expenditure Per Capita (CHEPC), External Health Expenditure Per Capita (EHEPC), Life Expectancy (LFE), and the logged value of the Gross Capital Formation (GCF). None of the coefficients for model 2 was negative. All of them were positive including the constant intercept (C). The adjusted R-squared is 89.04%, this shows the goodness of fit (very good because it is close to a 100%). Also the Durbin Watson test showed validated (were looking towards 2.00), and 1.89 is close to the 2.00. Only the Gross Capital Formation (GCF) was seen to have a probability value below or equal to 5%. It had a prob value of 0.0048. Therefore, according to the model, the Gross Capital Formation (GCF) is seen to play a major role in the model 2.
| Table 6 Granger Causality Tests |
||
|---|---|---|
| Variables | F-Statistics | Prob Value |
| PHE does not Granger Cause LGDP | 0.34571 | 0.7326 |
| LGDP does not Granger Cause PHE | 8.21804 | 0.0606 |
| LIMP does not Granger Cause LGDP | 5.34532 | 0.0026 |
| LGDP does not Granger Cause LIMP | 2.57463 | 0.2234 |
| LPOP does not Granger Cause LGDP | 161.71 | 0.0009 |
| LGDP does not Granger Cause LPOP | 153.562 | 0.001 |
| CHEPC does not Granger Cause LGDPPC | 2.76912 | 0.0023 |
| LGDPPC does not Granger Cause CHEPC | 1.20778 | 0.4123 |
| LGCF does not Granger Cause LGDPPC | 0.07514 | 0.9293 |
| LGDPPC does not Granger Cause LGCF | 2.90857 | 0.0198 |
This test helps us to know how each of the specified independent variables (regardless of the model) affects or granger causes the dependent variable(s). From the table above, Import (IMP) is seen to granger cause the Gross Domestic Product (GDP) at 1% level of significance (0.0026), but the gross domestic product do not granger cause import because its prob value is >5% and the makes the effect to be a uni-directional. In addition, the Population (POP) of people in the Turkish Republic of Northern Cyprus (TRNC) granger causes its Gross Domestic Product (GDP) at >1% sig. level (0.0009), In return, the logged value of the Gross Domestic Product (GDP), granger causes the population at 1% (0.0010) and this makes it a two-way causation. Furthermore, the Current Health Expenditure Per Capita (CHEPC) at 1% level of significance granger causes the Gross Domestic Product Per Capita (GDPPC). Lastly, the logged value of the gross domestic product per capita (GDPPC) granger causes the logged value of the Gross Capital Formation (GCF) just at 2% significant level.
The existence of co-integration among the dependent variable and their fundamentals necessitated the specification of ECM for this study. The residual of the model was stationary (probability value 0.0346) at 5% using the absolute critical value of Trace Statistic north (49.51953). As a result, the estimated model is not spurious. This implies that the variables are co-integrated and there exist a long run relationship. Thus, the model is long run model.
| Table 7 Error Correction Model for Model 1 |
||||
|---|---|---|---|---|
| Variable | Coefficient | Std. Error | t-Statistic | Prob. |
| C | -267.327 | 115.5173 | -2.31417 | 0.1467 |
| PHE | -1.69E-07 | 3.33E-07 | -0.50917 | 0.6612 |
| LGCF | 0.227464 | 0.134023 | 1.697207 | 0.2318 |
| LIMP | -0.06563 | 0.486564 | 0.134884 | 0.0451 |
| LFE | 1.166132 | 0.472024 | -2.4705 | 0.1321 |
| LPOP | 60.75503 | 25.4733 | 2.385048 | 0.0139 |
| ECM(-1) | -0.34568 | 1.522847 | 1.86866 | 0.0202 |
| R-squared | 0.983367 | Mean dependent var | 10.28825 | |
| Adjusted R-squared | 0.933468 | S.D. dependent var | 0.036094 | |
| S.E. of regression | 0.00931 | Akaike info criterion | -6.464 | |
| Sum squared resid | 0.000173 | Schwarz criterion | -6.3106 | |
| Log likelihood | 36.08799 | Hannan-Quinn criter. | -6.79503 | |
| F-statistic | 19.70712 | Durbin-Watson stat | 2.152003 | |
| Prob(F-statistic) | 0.049074 | |||
| Dependent Variable: LGDP | ||||
| Method: Least Squares | ||||
| Sample (adjusted): 2011 2019 | ||||
| Included observations: 9 after adjustments | ||||
Reporting from the table above, we could deduce that the constant intercept (C) had a negative coefficient (-267.32), this means that when the graph is been plotted, it will start below the point of origin (0) then tends towards the positive side upwards. Also, the coefficient of Import (IMP), Pharmaceutical Health Expenditure (PHE), and the lagged coefficient of the Error Correction Model (ECM(-1)) is seen to be negative. This implies that the multiplier effect of import is seen to have a negative impact on the Gross Domestic Product (GDP). In economic parlance, the more the import (i.e. import>export), there will be balance of payment deficit in such country. This is because payments will be made for the goods and services imported. For a country like the Turkish Republic of Northern Cyprus (TRNC) to have a favorable or stable balance of payment, the export (be it pharmaceutical products or any goods and services) must be greater than its imports. The probability value could only tell us that Import (IMP), and the population out of all the independent variables had a statistically significant prob. value.
The adjusted R-squared and the Durbin-Watson stat tell a lot about this result as well. The adjusted R-squared has put into consideration all other forces that could have affected the model, and it came out to be 93.35% which shows an acceptable goodness of fit for the model. Also, the Durbin-Watson stat shows its value at 2.15 (which is statistically accepted too).
| Table 8 Error Correction Model for Model 2 |
||||
|---|---|---|---|---|
| Variable | Coefficient | Std. Error | t-Statistic | Prob. |
| C | 0.318029 | 1.376234 | 0.231086 | 0.8321 |
| CHEPC | 1.03E-05 | 3.64E-05 | 0.28194 | 0.7963 |
| EHEPC | 0.001063 | 0.001249 | 0.850609 | 0.4575 |
| LFE | 0.015825 | 0.014773 | 1.071216 | 0.3626 |
| LGCF | 0.287047 | 0.066763 | 4.299469 | 0.0231 |
| ECM(-1) | -0.05187 | 0.515041 | 0.100715 | 0.0426 |
| R-squared | 0.959165 | Mean dependent var | 4.351822 | |
| Adjusted R-squared | 0.891108 | S.D. dependent var | 0.030028 | |
| S.E. of regression | 0.009909 | Akaike info criterion | -6.15606 | |
| Sum squared resid | 0.000295 | Schwarz criterion | -6.02458 | |
| Log likelihood | 33.70227 | Hannan-Quinn criter. | -6.4398 | |
| F-statistic | 14.09342 | Durbin-Watson stat | 1.867585 | |
| Prob(F-statistic) | 0.026995 | |||
| Dependent Variable: LGDPPC | ||||
| Method: Least Squares | ||||
| Sample (adjusted): 2011 2019 | ||||
| Included observations: 9 after adjustments | ||||
This table reports the error correction model result for model 2. In the table above, it was evident that the constant intercept (C) has a positive value meaning that when plotting the graph, it will start above the origin region (0). Also, considering the other coefficients in the model, we could see that it was only the lagged value of the Error Correction Model (ECM(-1)) that had a negative coefficient. In results as such, there are three things we should always look out for; first is the size, then the sign, and lastly, the significance. The probability values helped us to know which of the independent variables was statistically significant in the model. It was conspicuous that it was only Gross Capital Formation (GCF) that was statistically significant at 5%. The adjusted R-squared reported to be 89.11% perfect, and the Durbin-Watson stat showed 1.87. As said earlier, the Gross Capital Formation (GCF) holds a significant role to play in model 2 because of its probability value.
The results that will be obtained in the Auto regressive distributed lag model will show the relationship of the dependent variable on its lag periods. So the independent variables with their lags will also be explained on the dependent variable with its lags.
An Auto regressive distributed lag (p,q) model assumes that a time series Yt can be represented by a linear function of p of its lagged values and q lags of another times series Xt:

Is an autoregressive distributed lag model with p lags of Yt and q lags of Xt, where

| Table 9 ARDL for model 1 |
||||
|---|---|---|---|---|
| Variable | Coefficient | Std. Error | t-Statistic | Prob.* |
| LGDP(-1) | 0.416886 | 0.155459 | 2.681655 | 0.1155 |
| PHE | 1.65E-07 | 1.63E-07 | 1.012072 | 0.418 |
| LGCF | 0.094736 | 0.105139 | 0.901059 | 0.4627 |
| LIMP | 0.349161 | 0.389831 | 0.895674 | 0.0449 |
| LFE | -0.05047 | 0.26768 | -0.18855 | 0.8678 |
| LPOP | 1.206566 | 14.82568 | 0.081384 | 0.0225 |
| C | -1.69602 | 65.82333 | -0.02577 | 0.9818 |
| R-squared | 0.990062 | Mean dependent var | 10.28825 | |
| Adjusted R-squared | 0.960246 | S.D. dependent var | 0.036094 | |
| S.E. of regression | 0.007196 | Akaike info criterion | -6.97898 | |
| Sum squared resid | 0.000104 | Schwarz criterion | -6.82558 | |
| Log likelihood | 38.40541 | Hannan-Quinn criter. | -7.31001 | |
| F-statistic | 33.20655 | Durbin-Watson stat | 2.875078 | |
| Prob(F-statistic) | 0.02952 | |||
| Dependent Variable: LGDP | ||||
| Method: ARDL | ||||
| Sample (adjusted): 2011 2019 | ||||
| Included observations: 9 after adjustments | ||||
| Maximum dependent lags: 1 (Automatic selection) | ||||
| Model selection method: Akaike info criterion (AIC) | ||||
| Dynamic regressors (0 lag, automatic): PHE LGCF LIMP LFE LPOP | ||||
| Fixed regressors: C | ||||
*Note: p-values and any subsequent tests do not account for model section
It is evident from the table above that it was only the immediate lag value of the dependent variable (LGDP) that was evaluated for the lags. Now, we are to consider the effect(s) of the independent variables on the lagged value of the dependent variable (LGDP (-1)). From the coefficient column, it could be seen that it was only the life expectancy and the constant intercept that had a negative coefficient. Meaning, the life expectancy had a negative relative with the last year (lag) value of the log of gross domestic product. Considering the probability values, only the log of import and the population of the Turkish Republic of Northern Cyprus was statistically significant at 5% each. Other independent variables were not statistically significant to the lagged value of the dependent variable. The adjusted R-squared is at 96.02%, meaning that the goodness of fit is acceptable.
| Table 10 ARDL For Model 2 |
||||
|---|---|---|---|---|
| Variable | Coefficient | Std. Error | t-Statistic | Prob.* |
| LGDPPC(-1) | 0.3114 | 0.167159 | 1.862903 | 0.1594 |
| CHEPC | -4.64E-06 | 2.60E-05 | -0.17867 | 0.8696 |
| EHEPC | 0.000348 | 0.000895 | 0.388722 | 0.0234 |
| LFE | 0.010379 | 0.010321 | 1.005599 | 0.3887 |
| LGCF | 0.213113 | 0.057811 | 3.686374 | 0.0346 |
| C | 0.141337 | 0.906212 | 0.155965 | 0.886 |
| R-squared | 0.981003 | Mean dependent var | 4.351822 | |
| Adjusted R-squared | 0.949341 | S.D. dependent var | 0.030028 | |
| S.E. of regression | 0.006758 | Akaike info criterion | -6.92131 | |
| Sum squared resid | 0.000137 | Schwarz criterion | -6.78983 | |
| Log likelihood | 37.1459 | Hannan-Quinn criter. | -7.20505 | |
| F-statistic | 30.98402 | Durbin-Watson stat | 2.934337 | |
| Prob(F-statistic) | 0.008739 | |||
| Dependent Variable: LGDPPC | ||||
| Method: ARDL | ||||
| Sample (adjusted): 2011 2019 | ||||
| Included observations: 9 after adjustments | ||||
| Maximum dependent lags: 1 (Automatic selection) | ||||
| Model selection method: Akaike info criterion (AIC) | ||||
| Dynamic regressors (0 lag, automatic): CHEPC EHEPC LFE LGCF | ||||
| Fixed regressors: C | ||||
It was only the current health expenditure per capita in the model 2 that had a negative coefficient with the lagged value of the dependent variable (LGDPPC(-1)). Meaning that when spelt in the model, CHEPC will be a subtraction from the gross domestic product per capita in lagged form. And the probability values revealed that the External Health Expenditure Per Capita (EHEPC) and the Log value of the Gross Capital Formation (LGCF) had prob. value of <5%. Which means that only these two variables (EHEPC and LGCF) had significant impact on the log value of the gross domestic product per capita (LGDPPC(-1)). The adjusted goodness of fit was also seen to be close to being perfect at 94.93% while the Durbin-Watson stat reported 2.93.
| Table 11 Bound Test |
||||
|---|---|---|---|---|
| F-Bounds Test | Null Hypothesis: No levels relationship | |||
| Test Statistic | Value | Signif. | I(0) | I(1) |
| F-statistics | 10.3256 | 10% | 2.2 | 3.09 |
| K | 4 | 5% | 2.56 | 3.49 |
| 2.50% | 2.88 | 3.87 | ||
| 1% | 3.29 | 4.37 | ||
The bound test is the cointegration test for an autoregressive distributed lag model. From the table above, the value of F-statistics (10.32558) is greater than the values of both I(0) and I(1) at 1%, 2.5%, 5%, and 10% respectively. Because the value of the F-statistics did not fall in between I(0) and I(1), we therefore reject the null hypothesis and accept the alternative hypothesis, which means that there is relationship between the variables.
Conclusion
This paper investigates the effect of pharmaceutical spending on gross domestic product (GDP) in North Cyprus economy over the period 2008 and 2018. There is an extensive studies regarding the modeling and empirical investigation on the pharmaceutical industry by considering their performance or developments. This study is going to be the first in the literature by considering the impact of the pharmaceutical industry on GDP. Therefore this study is very important for two reasons; there is almost no such empirical study in the literature and based on this sector no study has been done on North Cyprus. Some popular techniques have been applied as ADF, Cointegration test, OLS, ECM and ARDL to determine the importances of this sector in North Cyprus Economy. The results refers that the external health expenditure per capita and gross capital formation was statistically significant to the gross domestic product per head (GDDPC) in North Cyprus and there is unidirectional causality from import (IMP) through the gross domestic product (GDP). The ECM implies that the variables are co-integrated and there exist a long run relationship between each other’s. It shows that the impact of the pharmaceutical industry on economic growth is important for Cyprus, which has a developing island economy.
The policy implications of the results obtained in this study presented that a long-run relationship exist between the variables, there is a big impact on economic growth therefore government must be carefull to take a monetary and fiscal policy on this sector.
Considering the importance of pharmaceutical industry on economic developments, value added of the further and detailed research on the economic growth in North Cyprus case were found to be very high. Further researches are needed to determine other factors that might leads to changes on this sector.
References
- Michael, G.A.G., Fry, S., & Vaterlaus, S. (2017). The importance of the pharmaceutical industry for Switzerland. Basel.
- Boboia, A., Oros, G.C., Polinicencu, C., & Mirel, S. (2014). Researches concerning: The profitability of the community pharmacy within the context of world economic and financial crises. Farmacia, 62(5), 1025–1036.
- Cheraghali, A. (2017). Trends in Iran pharmaceutical market. Trends in Iran Pharmaceutical Market, 16(1), 1–7.
- Grajauskas, R. (2014). The impact of the financial crisis on current account sustainability in Lithuania. Ekonomika, 93(2), 24–44.
- Hewitt, D. (1991). Military expenditure. International Comparison of Trends.
- Ilhani, Ö. (2019). Technological transformations: The case of industry 4.0 in Turkish pharmaceutical industry. The Graduate School of Social Sciences of Middle East Technical University, 1–89.
- Kazi, N. (2017). How propaganda works. By Jason Stanley, Princeton, Princeton University Press, 2015, 376.
- Kisa, A. (2006). Analysis of the pharmaceuticals market and its technological development in Turkey. International Journal of Technology Assessment in Health Care, 22(4), 537–542.
- Khoury, G., El-Far, M.T., Khoury, E.N., & Tovstiga, G. (2020). Internationalization of developing economy small and medium-sized enterprises: Social capital and learning in Palestinian pharmaceutical firms. Journal of Small Business and Enterprise Development, 28(2), 298–316.
- Mingazov, M.V., Tufetulov, A.M., & Khadiullina, G.N. (2019). Development features of pharmaceutical industry and its role in securing the future development of Russian economy. International Transaction Journal of Engineering, Management, & Applied Sciences & Technologies, 1–8.
- Murat, O.R.A.L., & Özçelikay, G. (2017). Ethical overview of pharmaceutical industry policies in Turkey from various perspectives. Turkish Journal of Pharmaceutical Sciences, 14(3), 264.
- Muratoglu, G. (2017). Does pharmaceutical industry boost economic growth? A Competitiveness-related approach. Journal of Yasar University, 12(48), 296-314.
- Nunes, A.M., Cunha, F.D.C., & Fernandes, A.C. (2019). Financial crisis in Portugal: Effects in the health care sector. International Journal of Health Services, 49(2), 237–259.
- Shaikh, M., & Gandjour, A. (2019). Pharmaceutical expenditure and gross domestic product: Evidence of simultaneous effects using a two-step instrumental variables strategy. Health economics, 28(1), 101-122.
- Uvey, G., & Basagaoglu D.A.I. (2004). Pharmacautical industry in Turkey. Journal of the International society for the history of Islamic medicine, 46–49.