Research Article: 2021 Vol: 20 Issue: 2S
Prediction of Sales Based on an Effective Advertising Media Sale Data: A Python Implementation Approach
Ahmad M. A. Zamil, Prince Sattam bin Abdulaziz University
Nawras M. Nusairat, Applied Science Private University
T. G. Vasista, International School of Technology and Sciences Women’s Engineering College
Marwan M. Shammot, King Saud University
Ahmad Yousef Areiqat, Al-Ahliyya Amman University
Keywords
Analyzing Sales Data, Linear Regression Model, Predictive Modeling, Predictive analytics, Python implementation, Sales Prediction.
Abstract
Sales forecasting is an essential task in the retail management field. Intelligent forecasting using machine learning techniques can help discover the selection of feature variables that influence prediction of sales growth. A Python program implementation is adopted to compute; develop and visualizing forecasting model of historical sales data based on advertising media opted to do the effective sales promotion. Python supports working on predictive algorithms through accessing from Python libraries. For this purpose, it relies on the past observations based transaction data set file as an input to produce output without worrying about the underlying mechanism. The results indicated that TV media is the feature variable that influences the prediction of sales of linear regression model. Regression results of OLS model type are displayed with coefficient values to substitute in the linear regression equation. Seaborne library of Python is used to generate the visualization of charts and graphs.
Introduction
Rapid development in the retail industry both in structure and growth in online-business is becoming the current marketing trends (Robert, Shaohui & Stephan, 2019). Sales forecasting is an important aspect of many business organizations today (Nguyen, Kedia, Snyder, Pasteur & Wooster, 2013). Sales forecasting is an essential task for the management of a store (Martin & Lopez, 2020). Sales prediction is used to predict sales of products at various stores and outlets of a big retail mart companies in different cities (Chandel, Dubey, Dhawale & Ghuge, 2019). Forecasting store sales can be categorized into: (i) forecasting existing store sales for distribution, setting target sales and its viability and controlling the finance and (ii) forecasting potential sales for the analysis of new store site selection (Robert, Shaohui & Stephan, 2019).. Predictive analytics is concerned with the prediction of future probabilities and trends. With predictive analytics, retailers are trying to enhance their product offerings, pricing models and service levels to create and enhance sustainable competitive advantage (Puri Seghal & Sharma, 2013). Intelligent forecasting can play significant role in the world of sales management. Intelligent forecasting uses the information of publicity of retail sales to forecast the effective media of advertising and thus predicting the growth of sales in terms of sales prediction. Though the process of forecasting tends to be a complex, it is a straight forward technique to determine its accuracy (Pinki & Gupta, 2018). Machine learning can help us discover the factors that influence sales and estimate the number of sales that it will have in the near future (Martin & Lopez, 2020).
Many forecasting models use historical sales to predict future sales (Nguyen, Kedia, Snyder, Pasteur & Wooster, 2013; Lertuthai, Baramichai & Laptaned, 2009).
During the promotion period, purchasing behavior of the consumer partially influenced by the incentives offered through each promotion event. Consumers make their final purchase decisions based on their perceived values for these promotion events. The efficacy of promotion events depends on the duration of the advertisement medium and degree of advertisement medium. Every promotional event may have a different effect on the consumer’s decision to increase their purchase (Lertuthai, Baramichai & Laptaned, 2009). Managers use analytical reports from sales to find market opportunities and processes where they could increase volume and profit. By comparing the result of positive and negative evaluations of comments of consumers, retailers can better understand the outcomes from competitors’ analysis (Pantano, Giglio & Dennis, 2018).
Research Objective
In this research, we developed an innovative realistic predictive method that could take the advantage of the historical demand data from the previous promotional events to forecast future sales. For example, a customer can exhibit a history of increased sales over certain periods (leading India, undated).
A Python program implementation is adopted to compute develop and visualizing forecasting model of historical sales data based on advertising media opted to do the sales promotion. Further Literature review on forecasting method has been studied in Lertuthai, Baramichai & Laptaned (2009) in passing.
We measure the causal effects of offline advertising on sales using Python programming with corresponding transaction data file. We wanted to find out statistically significant impacts of the advertising on sales (Lewis & Reiley, 2011). TV advertising is still huge and growing, despite the severe competition from online advertising. As an example, by the end of the year 2016 it was estimated by the e-Marketer that TV spending will be 71.29 Billion USD in USA (Deng & Mela, 2018). So as per the transaction data file figures that is considered for data processing, thus TV based sales prediction is targeted to be computed. This paper describes and assesses the effects of promotions of three media such as TV, NEWS PAPER and RADIO.
Research Methodology
A case study approach is adopted for research investigation, when realization of theoretical aspects becomes narrowed and complex with operational understanding and its synergies (Zamil & Vasista, 2020). In this paper, case study methodology and advertising media sales data processing with linear regression model are adopted. A case study is an empirical investigation that examines a current trend based phenomenon within its real-life context, especially when the boundaries between the research objects and contexts are not readily visible (Dul & Hak, 2008) as cited in Yin (2003); Ebneyamini, Reza & Moghadam (2018). The essence of case study is that it tries to illuminate decision or set of decisions, why they were taken, how they were implemented and with what results (Schramm, 1971) as cited in (Yin, 1984; Ebneyamini, Reza & Moghadam (2018).
Regression is an important machine learning model for these predicting sales kinds of problems, where we can fit a line of high sale and low sale product. It required significant amount of data for training and testing of the model (Leading India, undated). We intended to use the historical sales data file from kaggle.com web site as a secondary data that captured the data of selected media and corresponding sales figures of store items purchased.
Today’s advertisers are allocating budgets on different advertising platforms including TV, social media, online web display, catalogs, e-mail and many others (Zantedeschi, Feit & Bradlow, 2016).
Either product manufacturers or retail stores or both opt for various on-line and off-line promotional Medias such as Company Website, Television, Radio, News Paper, Brochure etc.
Each of the Medias is optimal in its own way facilitating the goods and service provides in promoting their sales. Electronic Word of Mouth communication such as social media often attracts new customers and is one of the contemporary practices to attract customers and to enhance customer decision making through E-word of mouth spread (AlSudairi, Vasista, Zamil & Algharabat, 2012). While newspaper media based sales in promotion items show growth steadily, radio retailers with vocal promotions and television retailers with visual effects attempt to promote selected stock keeping units with high discounts for shorter period (Lertuthai, Baramichai & Laptaned, 2009).
Predictive Modeling
As mentioned in Pattnaik & Behera (2016), predictive analytics is defined as generating predictive scores or probabilities of dependent variable(s) for individual organizational element and predicting at a more detailed level of granularity. Predictive analytics uses data mining techniques, which use analytical models to extract data and use it to predict trends and behavioral patterns of the unknown event of future interest. The basic process of creating analytical models involves use of one or more algorithms against a transactional data set having facts data by computationally determining the values of dependent variable, also called predicting variable. During this process, the data set get subjected to split into two where one data set is used to train the model and other data set to test the model. Predictive models may fail when business users ignore their results or when the model itself is found wrong. Further according to Pattnaik & Behera (2016), Sales and demand forecasting drives and number of merchandising, operational and financial processes such as replenishment, promotions, real estate, and budgeting and human resource related decision.
Linear Regression Model
Models are a way to summarize data. Ainscough & Aroson (1999) cited that development of linear regression models are considered as primary tool for making data analysis. Linear regression models are a family of models that impose a linear function between predictor and response variables. There are two primary goals for using regression analysis: (i) inference about parameters (ii) Prediction. Examples of inference about parameters include: (a) how does advertising media (budget) affect sales? (b) Estimate effect of x or y, controlling for other explanatory factors. Examples of prediction include: (a) how accurately can sales be predicted given a certain sales media (budget) for promotion (b) what and how to use transformations or techniques to get better predictions (UoA, 2017).
The linear regression model is built to allow the prediction of value of new data, when given the training data used to train the model (Marwardi, 2017). It is a data modeling technique. In this the predicted value is determined using a straight line. The mathematical model of linear regression take the form as shown below:
Yi=ß0+ß1Xi +?i
Where: Yi=Dependent variable
ß0=Population Y intercept where X=0 and the line meets the Y-axis
ß1=Population Slope Coefficient? it is the amount of impact X has on Y
Xi=Independent variable? it is the feature variable
?i= Random Error term
ß0+ß1Xi →this term is called the linear component.
Yi= It is considered as response or dependent variable i.e., we are predicting the sales
Prediction is determined by the value of the variable. Accuracy and fitness is measured by loss, R square, adjusted R square etc. Linear regression is a type of supervised machine learning algorithm (intellipat.com).
The best fit line for the data points is nothing but the line that best expresses the data point relationship. Residual Sum of Squares (RSS) is computed to find the best-fit line, such line will have the lowest value of RSS.

In simple linear regression, if the coefficient of x is positive, it can be concluded that the relationship between independent variable and dependent variables is positive.
i.e., in Yi=ß0+ß1Xi +?i
if ß1>0 the relationship is positive.
if ß1<0 the relationship is negative.
Python Implementation of Sales Prediction
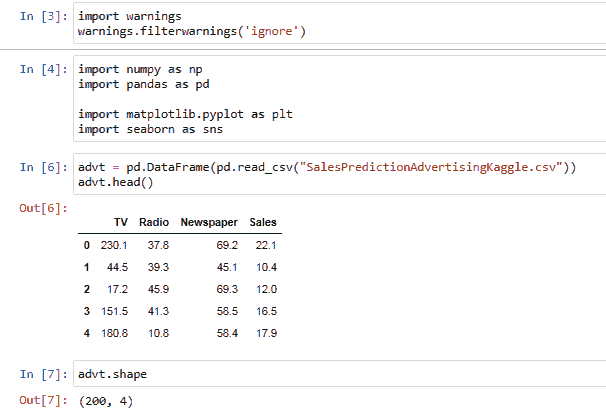
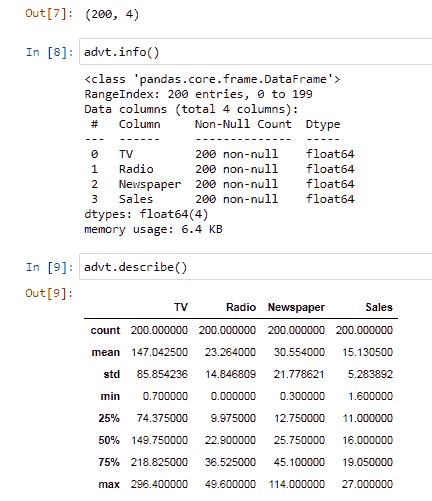
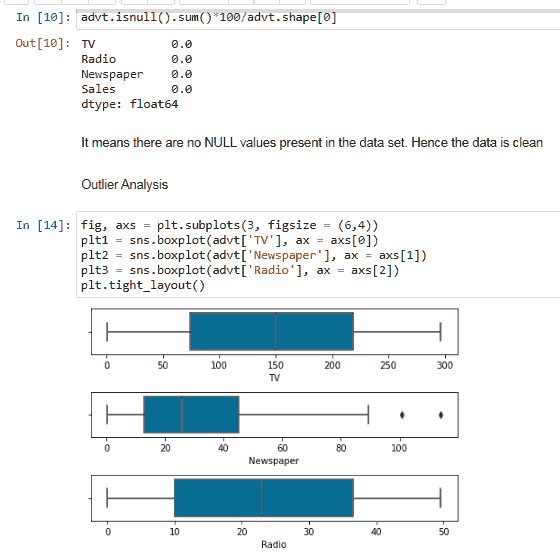
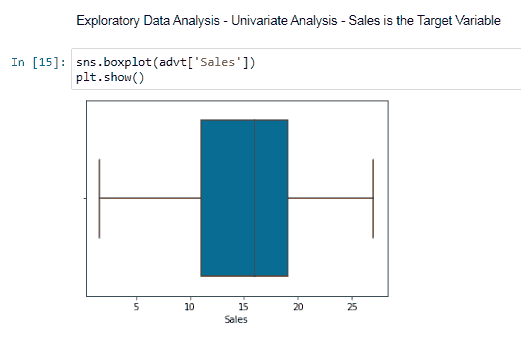
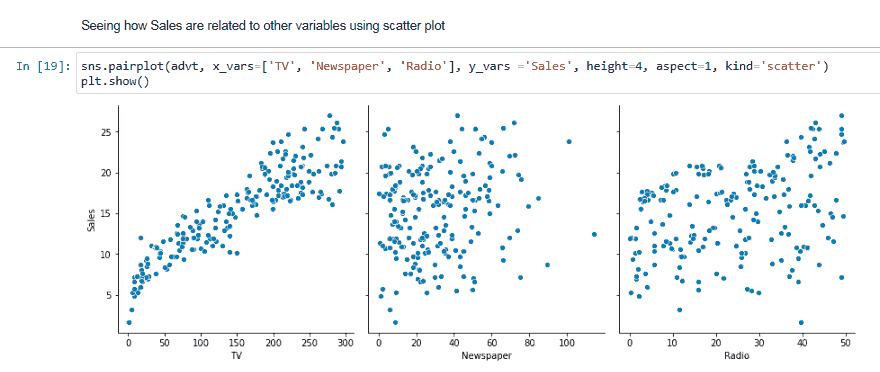
Python supports working on predictive algorithms through accessing from Python libraries by relying on the past observations based transaction data set file as an input to produce outputs without worrying about the underlying mechanism (Bradlow, Gangwar, Kopalle & Voleti, 2017) shows in figure 1-4.
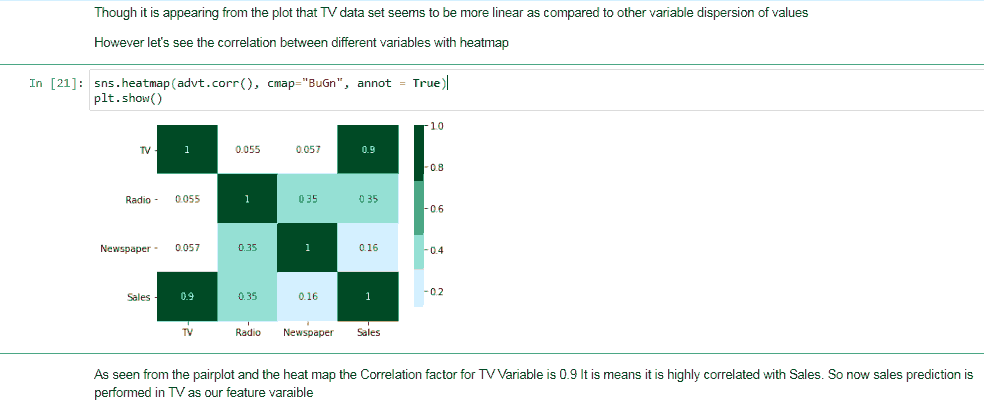
Though from the figure 5, it is appearing that TV data set seems to be more linear as compared to other variable dispersion of values, let us confirm it through observing correlation values by generating a heat map.
Here Figure 6 shows Heatmap Showing Correlation Between Different Variables.
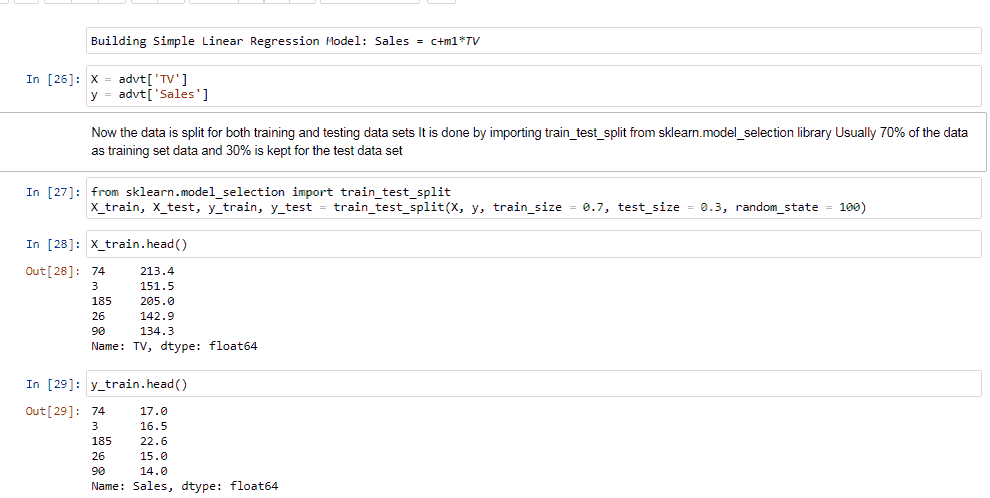
Building Simple Linear Regression Model for the TV as a feature variable
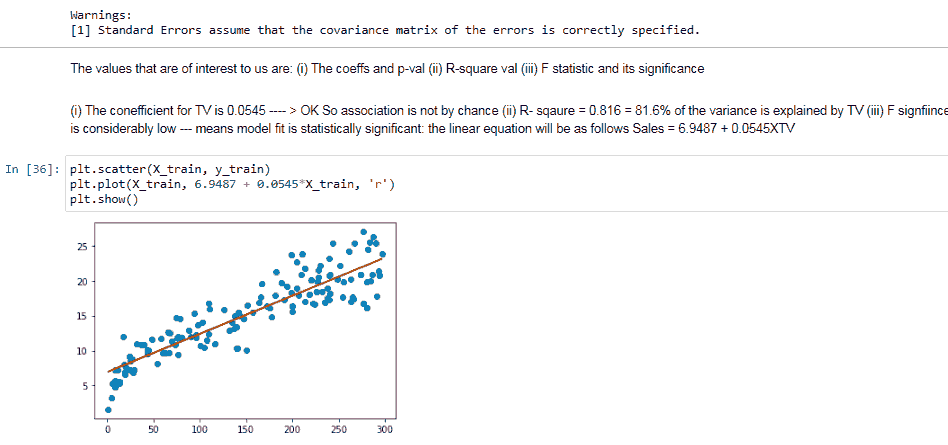
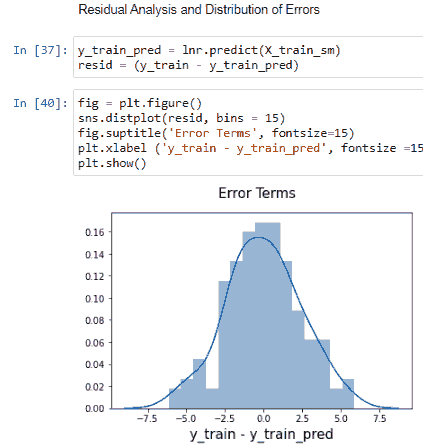
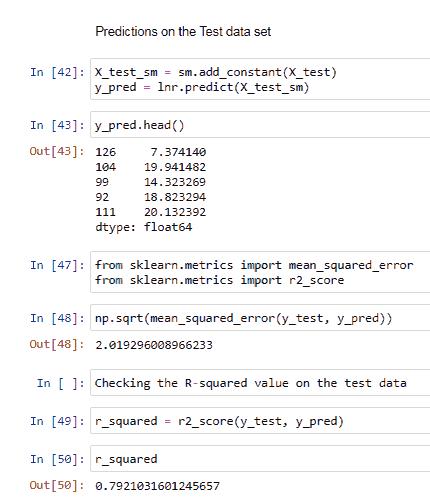
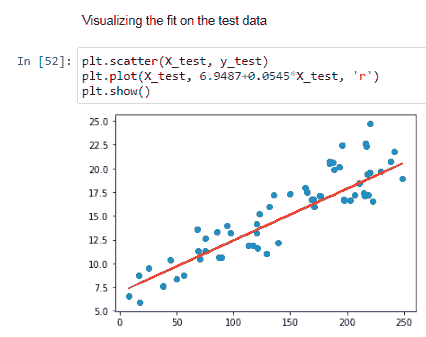
Observe from Figure 7-12.
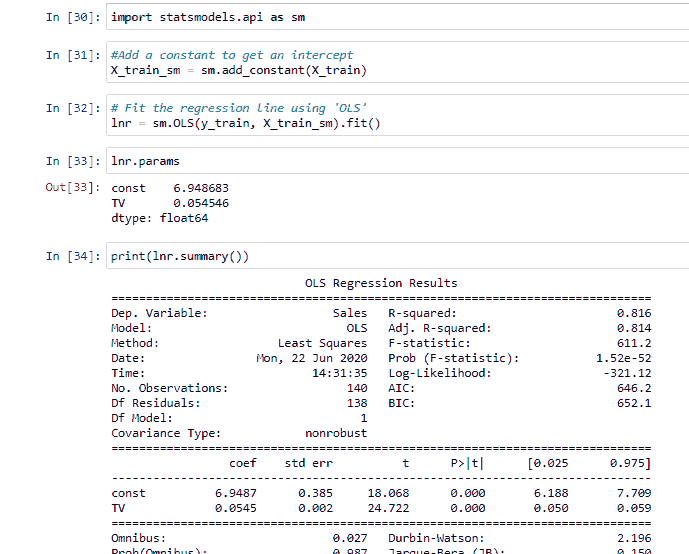
Figure 8: Building Linear Model: Importing statsmodels. API Library and Displaying Regression Results of OLS Model
Figure 9: Linear Regression Equation is: Sales=6.9847+0.0545*TV And Visualizing Fit on the Training Data
Conclusion
Even though many technical advances are happening in Information Technology fields such as Artificial Intelligence, Machine Learning and Predictive Algorithms, Decision-Making-process of a retail manager will be far away from fully automated outcomes. Predictive analytics in retail management is only a part of business intelligence. It deals with forecasting what lies ahead through exploration processes. So, as a standalone it does not contribute to the firms in understanding integrated semantic insights that they need (Bradlow, Gangwar, Kopalle & Voleti, 2017). Companies should be able to evaluate the costs and benefits of each model with appropriate forecasting tool (Alon, Qi & Sadowski, 2001; Morgan & Chintagunta 1997) suggested that ordinary linear regression equation ignores self-selectivity. It produces inferior forecasting results, instead truncated regression model provides the most accurate and parsimonious fit to the data. From the perspective of selecting media of advertisement to improve sales, Mulcahy & Riedel (2020) indicated that touch senses mobiles can strengthen more purchase intention.
References
- Ainscough, T.L. & Aronson, J.E. (1999). An empirical investigation and comparison of neural networks and regression for scanner data analysis. Journal of Retailing and Consumer services, 6, 205-217.
- Alon, I., Qi, M., & Sadowski, R.J. (2001). Forecasting aggregate retail sales: A comparison of artificial neural networks and traditional methods. Journal of Retailing and Consumer Services 8, 147-156.
- AlSudairi, M., Vasista, T.G., Zamil, A.M., & Algharabat, R.S. (2012). Mitigating the bullwhip effect with eWord of Mouth: eBusiness intelligence prespective. International Journal of Managing value and supply chains, 3(4), 27-41.
- Bradlow, E.T., Gangwar, M., Kopalle, P., & Voleti, S. (2020). The role of big data and predictive analytics in retailing. Journal of Retailing, 93(1), 79-95.
- Chandel, A., Dubey, A., Dhawale, S., & Ghuge, M. (2019). Sales prediction system using machine learning. International Journal of scientific research and engineering development, 2(2), 667-670.
- Deng, Y., & Mela, C.F. (2018). TV viewing and advertising targeting. Journal of Marketing Research, 55 (1), 99-118, American Marketing Association.
- Dul., J., & Hak, T. (2008). Case study methodology in business research. Abingdon, England: Routledge.
- Ebneyamini, S., Reza, M., & Moghadam, S. (2018). Toward developing a framework for conducting case study research. International Journal of Qualitative methods, 17(1), 1-11.
- Intellipat.com, (2017). Linear regression in Python – Simple and multiple linear regressions. Leading India (2nd edition). Sales prediction using regression analysis.
- Lertuthai, B., & Laptaned. (2009). Development of the adaptive forecasting model for retail commodities by sing leading indicator: Retailing Rule Based Forecasting Model (RRBF). In Proceedings of the World Congress on Engineering and Computer Science, 2, 20-22, San Francisco, USA.
- Lewis, R.A., & Reiley, D.H. (2011). Does retail advertising work? Measuring the effects of advertising on sales via a controlled experiment on Yahoo! CCP Working Paper, 11-9, ISSN-1745-9648.
- Martin, P., & Lopez, R. (2018). Building a sales prediction model for a retail store.
- Marwardi, D. (2017). Linear regression in Python.
- Morgan, M.S., & Chintagunta, P.K. (1997). Forecasting restaurant sales using self-selectivity models. Journal of Retailing and Consumer Services, 4(2), 117-128.
- Mulcahy, R.F., & Riedel, A. (2020). ‘Touch it, swipe it, shake it’: Does the emergence of haptic touch in mobile retailing advertising improve its effectiveness? Journal of Retailing and Consumer Services, 54, 1-8
- Nguyenm G.H., Kedia, J., Snyder, R., Pasteur, R.D., & Wooster III, R. (2013). Sales forecasting using regression and artificial Neural Networks. Midstates Conference for undergraduate research in computer science and mathematics, Ohio, USA.
- Pattnaik, M., & Behera, M.K. (2016). How predictive analytics in changing the retail industry. International Conference on Management and Information Systems, 23-24, Chitkara University, Bangkok.
- Pentano, E., Giglo, S., & Dennis, C. (2018). Making sense of consumers’ tweets: Sentiment outcomes for fast fashion retailers through big data analytics. International Journal of Retail & Distribution Management.
- Pinki, & Gupta, S. (2018). Sales forecasting using linear regress and support vector machine. International Journal of Innovative Research in Computer and Communication Engineering, 6(4), 3749-3755.
- Puri, S., Seghal, V., & Sharma, V. (2013). Customer centricity with predictive analytics in Indian retailing. International Journal of Intercultural information management, 3(3), 207-218.
- Robert, F., Shaohui, M., & Stephan, K. (2019). Retail forecasting: Research and practice. Management Science Working Paper 2018, 04, MPRA Paper No. 89356.
- Schramm, W. (1971). Notes on case studies of instructional media projects. Washington. D.C. Academy for Educational Development. Schumann.
- UoA. (2017). Linear Regression, 16.
- Yin, R. (1984). Case study Research. Beverly Hills, California: Sage Publications.
- Yin, R.K. (2003). Case study research: Design and methods. London: Sage.
- Zamil, A.M.A., & Vasista, T.G. (2020). Customer segmentation using RFM analysis: Realizing through Python implementation. Prabandhan: Indian Journal of Marketing (Submitted during July 2020).
- Zantedeschi, D., Feit, E.M., & Bradlow, E.T. (2016). Measuring multi-channel advertising effectiveness using consumer-level advertising response data. Management Science, 63(8), 2706-2728.
