Research Article: 2020 Vol: 24 Issue: 1
Price Elasticity of Demand for Mississippi Universities: 2000-14
Chad Denson, Delta State University
Abstract
The responsiveness of consumers to a change in the price of a product is measured by the price elasticity of demand. The percentage change in the price is measured as (ending price € beginning price) / beginning price. The University of Mississippi (UM € Ole Miss) raised tuition (price) by 122% over 15 years through 2014 € from $3,153 in the year 2000 to $6,996, or by $3,843 - (6,996 €3,153) / 3,153 = 3,843 / 3,153 = 122%. Increase/decrease in the quantity demanded (student enrollment) is measured as (ending enrollment € beginning enrollment) / beginning enrollment. Total student enrollment was 11,405 in the year 2000 and 23,711 in the year 2014. This was a 108% increase € (23,711 € 11,405) / 11,405 = 12,306 / 11,405 = 1.08 = 108%. In spite of a 122% price increase, there was a 108% rise in students (quantity demanded) for UM. The price elasticity of demand for UM was calculated as 0.93, inelastic. The results imply that UM should raise tuition again to increase revenue.
Keywords
Price, Elasticity, Demand, Tuition, Enrollment, Revenue.
Introduction
The law of demand in Economics states that consumers will respond to a price decline by buying more of a product. However, the degree of consumer responsiveness to a price change may vary considerably from product to product and between different price ranges for the same product (Campbell et al., 1996).
The responsiveness of consumers to a change in the price of a product is measured by the price elasticity of demand. Demand for some products is such that consumers are very responsive to price changes; small price changes lead to very large changes in the quantity purchased. The demand for such products is said to be elastic. For other products, consumers are quite unresponsive to price changes; substantial price changes result only in relatively small changes in the amount purchased. In such cases, demand in inelastic (Campbell et al., 1996)
The Price Elasticity Formula
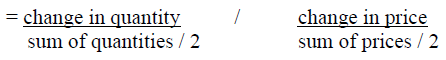
Economists measure the degree of price elasticity of demand by the following formulas:
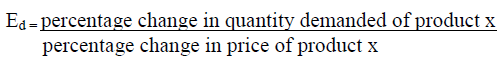
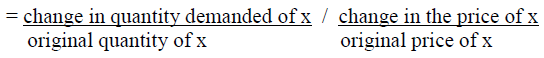
Interpretation
Demand is elastic if a given percentage change in price results in a larger change in quantity demanded. If a given percentage change is accompanied by a smaller change in quantity demanded, demand is inelastic. If the coefficient of price elasticity of demand, Ed, is greater than one, demand is elastic; if Ed is less than one, demand is inelastic (Campbell et al., 1996).
If demand is elastic, a decrease in price will increase total revenue. Even though a lower price is received per unit, enough additional units are sold to more than make up for the lessor price. Also, the reverse is true; an increase in price will decrease total revenue.
If demand is inelastic, a price decrease will reduce total revenue. The relatively small increase in sales will not offset the decline in revenue per unit. The analysis is reversible; if demand is inelastic, a price increase will increase total revenue (Campbell et al., 1996).
Application
The price elasticities of demand for several major four-year Mississippi universities including Delta State University, The University of Mississippi, Mississippi State University, and The University of Southern Mississippi were calculated for 15 years from 2000 through 2014.
Delta State University
The percentage change in the price is measured as (ending price – beginning price) / beginning price. Delta State University (DSU) raised tuition (price) by 123% over 15 years from $2,696 in the year 2000 to $6,012 in 2014, or by $3,316 -- (6,012 – 2,696) / 2,696 = 3,316 / 2,696 = 123%.
Increase/decrease in the quantity demanded (student enrollment) is measured as (ending enrollment – beginning enrollment) / beginning enrollment. Total student enrollment was 3,782 in the year 2000 and 3,662 by the year 2014. This was a 3% decrease – (3,662 – 3,782) / 3,782 = -120 / 3,782 = -0.03 = -3%.
In spite of a 123% price increase from 2000 through 2014, there was only a 3% drop in students (quantity demanded) for DSU.
The price elasticity of demand for DSU is calculated as (using the third equation shown previously):
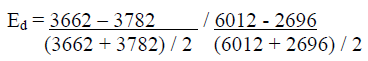
= (-120 / 3722) / (3316 / 4354)
= 0.0322407 / 0.7615985
= 0.04
This 0.04 is very inelastic. The perfectly inelastic demand coefficient (used primarily in hypothetical examples in Economic theory) equals zero and refers to the extreme situation where a price change results in no change whatsoever in the quantity demanded.
These results imply that DSU could increase revenue by raising its price. The following table shows estimated revenue for DSU from students:
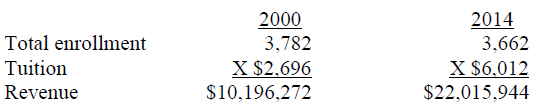
From 2000 to 2009, estimated student revenue increased from $10,196,272 to $22,015,944, or by $11,819,672.
The University of Southern Mississippi
The percentage change in the price is measured as (ending price – beginning price) / beginning price. The University of Southern Mississippi (USM) raised tuition (price) by 135% over 15 years from $2,970 in the year 2000 to $6,980 in 2014, or by $4,010 -- (6,980 – 2,970) / 2,970 = 4,010 / 2,970 = 135%.
Increase/decrease in the quantity demanded (student enrollment) is measured as (ending enrollment – beginning enrollment) / beginning enrollment. Total student enrollment was 12,818 in the year 2000 and 16,144 by the year 2014. This was a 26% increase – (16,144 – 12,818) / 12,818 = 3,326 / 12,818 = .26 = 26%.
In spite of a 135% price increase from 2000 through 2014, there was a 26% rise in students (quantity demanded) for USM.
The price elasticity of demand for USM is calculated as (using the third equation shown previously):
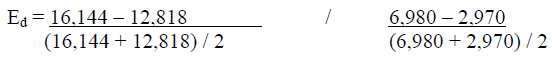
= (3,326 / 13,806) / (4,010 / 4,033)
= 0.240909749 / .527151004
= 0.46
This 0.46 is inelastic. The perfectly inelastic demand coefficient (used primarily in hypothetical examples in Economic theory) equals zero and refers to the extreme situation where a price change results in no change whatsoever in the quantity demanded.
These results imply that USM could increase revenue by raising its price. The following table shows estimated revenue for USM from students:
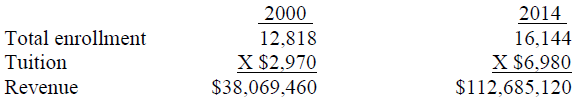
From 2000 to 2014, estimated student revenue increased from $38,069,460 to $112,685,120, or by $74,615,660.
University of Mississippi
The percentage change in the price is measured as (ending price – beginning price) / beginning price. The University of Mississippi (UM – Ole Miss) raised tuition (price) by 122% over 15 years through 2014 – from $3,153 in the year 2000 to $6,996, or by $3,843 -- (6,996 – 3,153) / 3,153 = 3,843 / 3,153 = 122%.
Increase/decrease in the quantity demanded (student enrollment) is measured as (ending enrollment – beginning enrollment) / beginning enrollment. Total student enrollment was 11,405 in the year 2000 and 23,711 in the year 2014. This was a 108% increase – (23,711 – 11,405) / 11,405 = 12,306 / 11,405 = 1.08 = 108%.
In spite of a 122% price increase, there was a 108% rise in students (quantity demanded) for UM.
The price elasticity of demand for UM is calculated as (using the third equation shown previously):

= (12,306 / 17,558) / (3,843 / 5075)
= 0.700877 / .7572413
= 0.93
This 0.93 is inelastic. Of course, both price and quantities were going up – the best of both worlds. The perfectly inelastic demand coefficient (used primarily in hypothetical examples in Economic theory) equals zero and refers to the extreme situation where a price change results in no change whatsoever in the quantity demanded.
These results imply that UM could increase revenue by raising its price. The following table shows estimated revenue for UM from students:
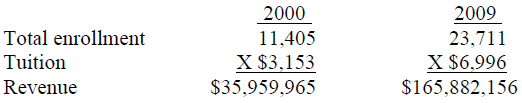
From 2000 to 2014, estimated student revenue increased from $35,959,965 to $165,882,156, or by $129,922,191.
Mississippi State University
The percentage change in the price is measured as (ending price – beginning price) / beginning price. Mississippi State University (MSU) raised tuition (price) by 126% over 15 years from $3,117 in the year 2000 to $7,040 in 2014, or by $3,923 -- (7,040 – 3,117) / 3,117 = 3,923 / 3,117 = 126%.
Increase/decrease in the quantity demanded (student enrollment) is measured as (ending enrollment – beginning enrollment) / beginning enrollment. Total student enrollment was 15,764 in the year 2000 and 20,219 by the year 2014. This was a 28% increase – (20,219 – 15,764) / 15,764 = 4,455 / 15,764 = 0.28 = 28%.
In spite of a 126% price increase, there was a 28% rise in students (quantity demanded) for MSU.
The price elasticity of demand for MSU is calculated as (using the third equation shown previously):
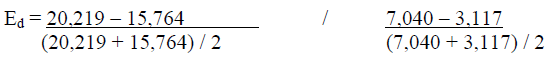
= (4,455 / 17992) / (3,923 / 5079)
= 0.24761 / 0.7723961
= 0.32
This 0.32 is inelastic. The perfectly inelastic demand coefficient (used primarily in hypothetical examples in Economic theory) equals zero and refers to the extreme situation where a price change results in no change whatsoever in the quantity demanded.
These results imply that MSU could increase revenue by raising its price. The following table shows estimated revenue for MSU from students:
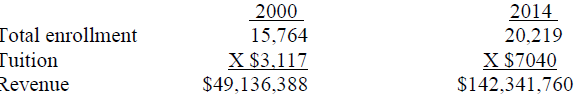
From 2000 to 2014, estimated student revenue increased from $49,136,388 to $142,341,760, or by $93,205,372.
Conclusion
All the four-year universities in Mississippi in the study, including Delta State University, The University of Mississippi, Mississippi State University, and The University of Southern Mississippi, were found to have inelastic price coefficients. All experienced student enrollment increases, in spite of the tuition hikes. The results imply that all should raise tuition again to increase revenue. However, some qualifications are in order. All senior colleges in Mississippi have raised tuition in most of the 15 years from 2000-14. If all senior colleges raised tuition again, there would probably be a negligible decline in student enrollment for all Mississippi colleges. On the other hand, if UM raised tuition and other colleges in Mississippi did not follow, the results would probably be different. Also, there may be some price range where the student consumer response would be different. Other considerations, such as colleges are financially supported by the legislature who are voted on by the general public, should be factored into any tuition increase decision. Nevertheless, since the average college graduate makes $1.63 for every dollar earned by the high-school graduate, Davis (1997) tuition could be increased substantially before college costs would be higher than the benefits.
References
- Economics, by Campbell R. McConnell and Stanley L. Brue, thirteenth edition, McGraw Hill, New York, 1996, pages 400-2.
- Absolute values are computed, since the price elasticity coefficient of demand will always be a negative number, since price and quantity demanded are inversely related. Economics, by Campbell R. McConnell and Stanley L. Brue, thirteenth edition, McGraw Hill, New York, 1996.
- Delta State University Bulletin 2000-2014, various pages 28-33.
- Undergraduate and graduate tuition for Mississippi residents was only considered, other factors such as out-of-state tuition, special fees, residence hall fees, scholarships, alumni donations, state of Mississippi financial support, etc. were not included.
- Delta State University Institutional Research and Planning Memorandums, 2000-14.
- Of course, other factors could have contributed to the enrollment increase.
- Delta State University Institutional Research and Planning Memorandums, 2000-14.
- Davis, B. (1997). At the Heart of the Trade Debate: Inequity, Wall Street Journal, October 31, 1997.