Research Article: 2021 Vol: 24 Issue: 6S
Pricing and Performance of Indian IPOs in the Free-Pricing Era: An Empirical Study
Iqbal Thonse Hawaldar, College of Business Administration, Kingdom University
Naveen Kumar K.R., Poornaprajna Institute of Management
Mallikarjunappa T., Central University of Kerala
Abstract
After the scrapping of Capital Issues (Control) Act, 1947 putting an end to the regime of Controller of Capital Issue (CCI) and allowing free pricing of public issues, capital market in India witnessed IPO activities from different sectors of the economy which was hitherto restricted by the CCI. The present paper tries to study two of the widely researched IPO anomalies in India during the free-pricing era: initial underpricing and long run underperformance. Consistent with the extant work, we find that IPOs in India belonging to the period 1992-2011 are also significantly underpriced. However, contrary to most of the international findings, the long run performance of these IPOs is also found to be positive and significant.
Keywords
Controller of Capital Issue, Free-Pricing, Initial Public Offerings, Underpricing, Underperformance
Introduction
The IPOs that usually offer substantial positive return on listing day tend to underperform their benchmark indices in the long run. Such underperformance was first observed for US IPOs by Ibbotson (1975). It was further documented by Ritter (1991); Loughran (1993); Loughran & Ritter (1995). As far as Indian capital market is concerned, there are a lot of changes took place since 1991 (Kumar et al.,, 2020; Pinto et al.,, 2020; Bolar et al.,, 2017; Hawaldar, 2018; Iqbal, 2014) and the efficiency of Indian stock market has been tested by many researchers (Iqbal & Mallikarjunappa, 2011;2010;2009;2007; Mallikarjunappa & Iqbal, 2003). Following the liberalization process initiated and the announcement of famous Industrial Policy, 1991, several changes took place in the capital market as well. Firstly, the Capital Issues (Control) Act, 1947 was scrapped in 1992 putting an end to the regime of CCI and allowing free pricing of public issues. In the place of CCI, Securities and Exchange Board of India (SEBI) was set up and entrusted with the responsibility of regulating the capital market activities. Secondly, the pricing of IPOs in India was based on fixed-price mechanism for almost the entire decade of nineties.
Review of Literature
Listing Day Performance
One of the first and widely tested theories of IPO underpricing was ‘information asymmetry theory’ developed by Baron (1982); Rock (1986). According to Baron, there is information asymmetry between investment banker to an IPO, being better informed, and the issuer. As a means to reward his superior information, investment banker gets the power to set the issue price. Using this power, he sets the issue price below its true worth for his personal benefits. However, contradicting this, both Muscarella & Vetsuypens (1989); Cheung & Krinsky (1994) could not establish lower underpricing for IPOs of investment bankers where issuers themselves market their IPOs.
Findings of Hameed & Lim (1998) support signaling theory; Bessler & Thies (2006) also find that IPO firms with greater underpricing (price run-up in months following IPOs) are more likely to return to the market with SEOs to raise additional equity. However, Garfinkel (1993) could not establish any relationship between underpricing and quality of the issuing firms.
Affleck-Graves, et al., (1993) report that NYSE-listed IPOs are more underpriced than AMEX-listed IPOs in the US. Dewenter & Malatesta (1997) report that state enterprise IPOs are significantly more underpriced than the private sector IPOs in the UK though they find contrary to this in the case of Canada and Malaysia. Aggarwal, et al., (2002) find that significantly more recommendations from research analysts towards the expiration of lock-up period for firms with larger underpricing as the reason why managers (insiders) do not sell their IPO shares until the end of lock-up period. Ljungqvist & Wilhelm (2002) report direct relationship between underpricing and information production; while inverse relationship between underpricing and institutional allocation of IPO shares. Demers & Lewellen (2003) find that underpricing of internet companies’ IPOs is positively related to the increase in the web-traffic for the IPO firms after the issue.
Cheung, et al., (2004) report that in Hong Kong underpricing is found only in the pre-listing market; it disappears in the post-listing market and, therefore, the market is efficient. Cook, et al., (2006) report positive relationship between underpricing and IPOs’ pre-issue publicity. Hill (2006) report that underpricing has no role to play in deciding the proportion of block-holding in the share ownership pattern of the IPO firm, either at the time of issue or in the long run. Lowry & Murphy (2007) did not find evidence that US IPO firms with stock options are more underpriced thus providing evidence against the argument that executives of IPO firms with IPO options intentionally set the issue price below its true worth for their personal gain. Though Rathnayake, et al., (2019) report that IPOs in Sri Lanka are underpriced, 32 of 148 IPOs are found to be overpriced.
As regards Indian studies, apart from reporting significant underpricing of IPOs, Narasimhan & Ramana find that premium issues in India are more underpriced than par issues. However, Krishnamurti & Kumar (2002) find that the magnitude of underpricing is more for par-value (risky) issues. Findings of Ghosh (2005) provide Indian evidence for signaling model: IPOs from business groups with bigger issue size are more underpriced than their stand-alone counterparts; subsequently, such firms raise more funds through SEOs. However, Garg, et al., (2008) report that magnitude of underpricing does not change much in the cold and hot IPO market. Bora, et al., (2012) report only marginal difference between the market-adjusted underpricing for book-built and fixed-price IPOs. However, Hawaldar, et al., (2018) report that book-built IPOs are underpriced by lesser magnitude compared to fixed-price IPOs.
Long-run Performance
Studying post-listing performance of US IPOs, while Aggarwal & Rivoli (1990) report significantly negative market-adjusted return up to one year, Ritter (1991) reports long-run underperformance compared to matching firms’ sample. Considering six calendar years since going public, Loughran (1993) also reports underperformance for US IPOs. Though McGuinness (1993) reports positive performance during the initial few months after listing for Hong Kong IPOs, study documents reversal of trend subsequently resulting in significantly negative returns on 400th and 500th days post-listing. Levis (1993) reports three-year benchmark-adjusted underperformance for UK IPOs; continuing beyond three years, study documents negative performance even during fourth and fifth year after listing. Studying long-run performance of IPOs for three Latin American countries–Brazil, Chile and Mexico, Aggarwal, et al., (1993) report negative performance for all three countries. Loughran & Ritter (1995) report that IPO as well as SEO investors in the US suffer negative returns in the long run when computed using a sample of non-issuers. Steib & Mohan (1997) report poor post-listing long-run performance for the post-reunification German IPOs. Comparing long-run performance of South African IPOs with a sample of firms having similar size and P/E ratio, Page & Reyneke (1997) report significant negative performance. Though, using buy and hold abnormal returns up to five years, Gompers & Lerner (2003) found that US IPOs underperform, they found no underperformance using cumulative abnormal returns. Cai & Liu (2008) report post-listing underperformance for Chinese IPOs listed on Shanghai Stock Exchange.
Researchers have also tried to establish relationship between different variables and the post-listing performance of IPOs. Rajan & Servaes (1997) report that firms having superior growth projections in the initial stage underperform in the long run. Cheng (2015) finds that though IPOs in China do not underperform their market or industry benchmarks in the long run, they significantly underperform their size-matched industry peers; study also reports positive correlation between long-run performance and the volume of initial reserves of IPO firms. Carter, et al., (1998) report less severe long-run underperformance for IPOs that are associated with more prestigious underwriters. In their study Brav, et al., (2000) find that long-run underperformance was mainly concentrated among smaller firms having low book-to-market ratio. Jaskiewicz, et al., (2005) find that IPOs by family run businesses in Germany and Spain underperform the market in the long run while non-family business IPOs perform insignificantly better. Though Alvarez & Gonzalez (2005) report negative post-listing performance for Spanish IPOs, they find that underpricing and the number of SEOs between 2nd and 5th year of IPO are positively related to the long-run performance up to five years. Guo, et al., (2006) report that IPO firms in US with no R&D activities underperform in the long run; IPO firms with high R&D activities outperform IPO firms with low R&D activities which, in turn, outperform IPO firms with no R&D activities.
Findings on Malaysian IPOs by Ahmad-Zaluki, et al., (2007) contradict most of the studies; study reports significantly positive long-run performance using both cumulative abnormal return and buy and hold return with two market indices though the positive performance using matched companies and value-weighted scheme was not significant. Similar finding was reported by Komenkul & Kiranand (2017) also; of the various ASEAN countries, samples from Malaysia and Thailand are found to be better performers in the long run, even though Singaporean IPOs register worse post-listing performance.
As far as post-listing IPO performance in India is concerned, contrary to most of international findings, Madhusoodanan & Thiripalraju (1997) report long-run positive performance. However, findings of Sehgal & Singh (2007) support international evidences; study reports negative performance between 18 and 40 months using BHAR while using CAAR study reports underperformance in second and third years. Hawaldar, et al., (2018) also report significantly negative performance post-listing; while fixed-price IPOs underperform during the first one and half years and then onwards turn significantly positive, book-built IPOs consistently register negative performance. Sakharkar & Ramesh (2019) report that IPO underpricing is found to be present up to nine months; however, between one and three-years post-listing, returns decline. Finally, studying whether SEOs are underpriced i.e., issued at a price lower than the prevailing market price and whether companies time their issues, Kumar, et al., (2018) find that SEOs in India are underpriced and there exists ‘windows of opportunity’ for SEOs which means issuers in India time their SEOs.
Objectives and Hypotheses
Objectives of the Study
The present study has the following objectives:
1. To see whether IPOs in India are underpriced, especially after the abolition of CCI and the introduction
of free-pricing of public issues.
2. To test the post-listing aftermarket performance of IPOs in India.
3. To study the sector-wise initial and long-run performance of IPOs in India.
4. To compare the initial and long-run performance of Indian IPOs based on method of pricing the issue.
Hypotheses of the Study
The present study examines initial as well as long-run performance of IPOs belonging to the period 1992-2011. The hypotheses being tested in the present study are:
1. IPOs in India are not underpriced.
2. Investors cannot earn abnormal returns in the long term from IPOs.
Research Methodology
Sample
The study period covers 20 years. The initial sample for the computation of underpricing of IPOs consists of 2,934 IPOs that came to the market between 1992 and 20111. However, the sample for the study of post-listing performance was reduced to 2,925 IPOs as price data beyond listing day was not available for 9 IPOs.
Methodology
Returns from IPOs are computed for two intervals: the initial return, known as either underpricing or overpricing of IPOs, and the aftermarket return, known as long-run performance of IPOs.
Following Kumar and Mallikarjunappa (2013); Hawaldar et al., (2018); Kumar et al., (2018) the methodology discussed below have been used in the present work in computing underpricing, long-run performance and parametric significance test.
Initial Return or Underpricing
IPO initial return is computed from the offer price to the first trading day/listing day price. Vast majority of researchers have computed initial return from IPOs, commonly known as underpricing in IPO literature, using the offer price and the closing price on the first trading day as under:
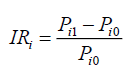
Where IRi is the IPO subscriber’s initial raw return from security i, Pi1 is the closing price of the IPO share on the first trading day, and Pi0 is the offer/issue price. Benchmark-adjusted underpricing or abnormal initial return is computed as the initial raw return from the IPO minus the return on the market benchmark over the same period which is computed as under:
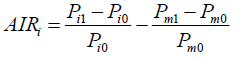
Where AIRi is the benchmark-adjusted abnormal initial return from IPO stock i. Pm1 denotes the closing benchmark index on the listing day of the IPO scrip and Pm0 is the closing benchmark index on the IPO offering day. The average underpricing, both raw and market-adjusted, for the whole sample is computed as under:
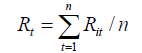
Where, Rt is the average raw/benchmark-adjusted underpricing for the sample of IPO firms, Rit is the raw/benchmark-adjusted underpricing of stock i, and n is the sample size. To test the significance of average underpricing of the sample, following parametric t-test is used:
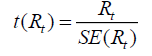
Where, Rt=The average benchmark-adjusted underpricing for the sample,
SE(Rt)=Standard Error of average benchmark-adjusted underpricing which is calculated as under:
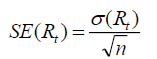
Where, σ(Rt)=Standard Deviation of average benchmark-adjusted underpricing, and
n=Number of observations in the sample or sample size.
Long-run Performance
Barber & Lyon (1997) note that the convention in much of the research that analyses abnormal returns has been to sum either daily or monthly abnormal returns over time. Therefore, in the present study we use Cumulative Average Abnormal Return (CAAR) to measure the long-run performance of IPOs. Cumulative Average Return (CAR) is computed with daily IPO portfolio rebalancing and the CAAR is computed after adjusting for the contemporaneous benchmark return. The daily raw return for security i, is computed as under:
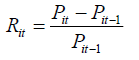
Where, Rit is the raw return on security i for day t, Pit is the adjusted closing price of security i on day t, and Pit-1 is the adjusted closing price of security i on day t-1.
The market return for the same period is computed as under:
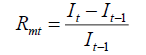
Where, Rmt is the market return on day t, It is the closing index level on day t, and It-1 is the closing index level on day t-1.
Daily benchmark-adjusted returns are calculated as daily raw return on the security minus the daily benchmark return for the corresponding day. Using return on BSE 200 as the market return, the benchmark-adjusted return (abnormal return) for stock i on day t is defined as:
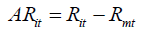
Where, ARit is the benchmark-adjusted return for stock i on day t, Rit is the raw return for stock i on day t, and Rmt is the return on BSE 200 used as the benchmark return for the same period. The average benchmark-adjusted return (average abnormal return) on a portfolio of n stocks for day t is the equally-weighted arithmetic average of the benchmark-adjusted returns:
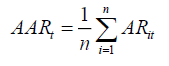
Where, AARt is the average abnormal return (benchmark-adjusted) on a portfolio of n stocks for day t, n is the number of stocks in the portfolio on day t, and ARit is the benchmark-adjusted abnormal return for stock i on day t. The cumulative benchmark-adjusted aftermarket performance (cumulative average abnormal return) from day q to day s is the summation of the average benchmark-adjusted returns or AARs:
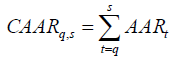
Where CAARq,s is the cumulative average abnormal return or the cumulative benchmark-adjusted aftermarket performance from day q to day s, and AARt is the average abnormal return on a portfolio of n stocks for day t. When a firm in portfolio p is delisted from the BSE, the portfolio return for the next day is an equally-weighted average of the remaining firms in the portfolio. The cumulative market-adjusted return for various days, thus, involves daily rebalancing of the portfolio with the proceeds of a delisted firm equally allocated among the surviving members of the portfolio p for each subsequent day.
Parametric Significance Test
In testing the long-run performance of IPOs in the aftermarket, the CAAR provides information about the average price behaviour of securities during the post-listing period. If markets are efficient, the AARs and CAARs should be close to zero. Parametric ‘t-test’ is used to assess significance of AARs and CAARs. The 5 percent level of significance with appropriate degree of freedom is used to test the null hypothesis of no significant abnormal returns post-listing. The conclusions are based on the results of t-values on AARs and CAARs for the post-listing period. The t-test statistics for AAR for each day during the post-listing period is calculated as under:
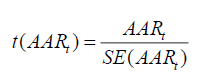
Where AARt is the AAR on day t, and SE(AARt) is the standard error of AAR on day t which is computed as under:
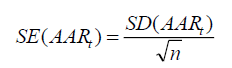
Where, SD(AARt) is the standard deviation of AAR on day t, and n is the number of stocks in portfolio p on day t.
The t-test statistics for CAAR for each day during the post-listing period is calculated by using the following formula:
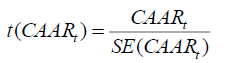
Where, CAARt is the CAAR on day t, and SE (CAARt) is the standard error of CAAR on day t which is computed as under:
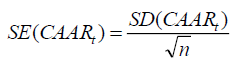
SD(CAARt) is the standard deviation of CAAR on day t which is computed as under:
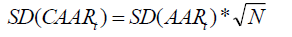
Where, N is the total number of days for which AAR is cumulated.
Findings and Analysis
Listing Day Performance
It has been widely documented by researchers worldwide that investors who purchase IPO shares at the offer price and sell them on the listing day or first trading day of the IPO shares, make huge gains. Such a phenomenon is referred to as ‘underpricing’ of IPO shares indicating that these IPO shares are priced well below their intrinsic worth or true value. The present study tests whether the IPOs issued in India during the last two decades are in line with the global empirical findings. The average underpricing is found to be 60.21 percent (raw return) using the closing price on the listing day and without adjusting for market movement. The benchmark-adjusted returns using various market indices are between 54 and 55 percent. Apart from closing price, we also compute underpricing using opening, high, and low prices on the listing day and adjust them for various market returns wherever the data on market indices are available for the same period. The following table shows listing day performance for the sample of 2,934 IPOs that went public during the period 1992-2011 using different prices on the listing day and using different benchmarks (Table 1):
| Table 1 Listing Day Performance of 2,934 IPOS for the Period: 1992-2011 |
||||
|---|---|---|---|---|
| Listing Day Price/Type of Return | Opening Price | High Price | Low Price | Closing Price |
| Average Raw Return (%) | 57.28* | 74.88* | 46.74* | 60.21* |
| -23.28 | -23.72 | ((19.69) | -23.04 | |
| BSE 200-Adjusted Return (%) | - | - | - | 54.97* |
| -21.5 | ||||
| BSE 100-Adjusted Return (%) | 51.14* | 68.72* | 40.64* | 54.09* |
| -20.9 | -22.51 | -17.28 | -21.16 | |
| BSE Sensex-Adjusted Return (%) | 51.88* | 69.43* | 41.31* | 54.74* |
| -21.24 | -22.65 | -17.59 | -21.39 | |
| Nifty-Adjusted Return (%) | - | - | - | 54.16* |
| -21.14 | ||||
* Significant at 1% level
Parametric t-test values are shown in parenthesis
Further analysis of the above table reveals that the successful subscribers of IPO shares who sell their shares at the opening price on the first trading day can make a gain of 57.28 percent, unadjusted for the market returns; corresponding figures when adjusted for BSE 100 and BSE Sensex movement for the same period are 51.14 percent and 51.88 percent, respectively. The corresponding figures for the fortunate investors who could sell their IPO shares at the high price on the listing day are 74.88, 68.72 and 69.43, respectively. Investors who sell their allotted IPO shares even at the low price on the listing day make handsome gains of 46.74 percent when not adjusted for benchmark return, and 40.64 percent and 41.31 percent when adjusted for BSE 100 and BSE Sensex market returns, respectively. All these measures of underpricing for the sample belonging to the study period, which are highly significant, lead us to reject the first hypothesis which states that IPOs are not underpriced based on the listing day performance. Such a finding becomes particularly interesting when we consider the fact that all these IPOs have come to the market after the abolition of CCI or where issuers are free to decide the issue price meaning that even after allowing free-pricing, IPOs in India are underpriced.
Long-Run Performance
Majority of literature on post-listing long-run performance of IPOs from different capital markets has shown that IPOs underperform their benchmark in the long run. Such aftermarket negative performance of IPO shares documented is in contrast to the finding that these same IPOs give substantial positive returns to the IPO subscribers in the form of heavy underpricing on the listing day. Therefore, after having documented that IPOs in India belonging to the free-pricing era are heavily underpriced for the period of 1992-2011, we intend to test whether these same IPOs underperform post-listing, in line with international evidence. Though the underpricing sample was 2,934 IPOs, for nine IPOs post-listing returns cannot be computed as price data beyond listing day are not available, thus reducing long-run performance sample to 2,925. Following table reports the BSE 200 market-adjusted returns (AARt) and the CAARt, both without percentage and excluding initial day return, for the first 60 days from listing day for 2,925 IPOs during the period 1992-2011 (Table 2).
| Table 2 60-Days Post-Listing Performance of 2,925 IPOS for the Period 1992-2011 |
|||||||||||
|---|---|---|---|---|---|---|---|---|---|---|---|
| Day | nt | AARt | t-stat | CAARt | t-stat | Day | nt | AARt | t-stat | CAAR | t-stat |
| 1 | 2925 | 0.01992 | 2.610736 | 0.01992 | 2.610736 | 31 | 2837 | 0.000177 | 0.062775 | 0.11947 | 7.605305 |
| 2 | 2919 | 0.002084 | 0.614856 | 0.022005 | 4.589736 | 32 | 2837 | 0.005608 | 2.464674 | 0.125078 | 9.718318 |
| 3 | 2916 | 0.004696 | 1.554253 | 0.026701 | 5.101942 | 33 | 2835 | 0.003499 | 1.729361 | 0.128577 | 11.06211 |
| 4 | 2912 | 0.000226 | 0.080059 | 0.026927 | 4.760821 | 34 | 2833 | 0.001823 | 0.966891 | 0.130399 | 11.86238 |
| 5 | 2910 | -0.00265 | -0.96704 | 0.024278 | 3.962999 | 35 | 2829 | 0.003826 | 1.060981 | 0.134225 | 6.2919 |
| 6 | 2909 | 0.018669 | 1.541495 | 0.042947 | 1.447714 | 36 | 2827 | 0.00392 | 1.968034 | 0.138145 | 11.55954 |
| 7 | 2907 | 0.001829 | 0.650581 | 0.044775 | 6.019872 | 37 | 2826 | 0.005145 | 1.993591 | 0.14329 | 9.127589 |
| 8 | 2902 | 0.004927 | 1.499553 | 0.049702 | 5.348608 | 38 | 2825 | 0.001585 | 0.863316 | 0.144875 | 12.80273 |
| 9 | 2899 | 0.008348 | 3.410038 | 0.05805 | 7.904341 | 39 | 2821 | 0.002825 | 1.483419 | 0.1477 | 12.41967 |
| 10 | 2897 | 0.004297 | 1.963831 | 0.062347 | 9.010154 | 40 | 2821 | 0.00035 | 0.182306 | 0.14805 | 12.18571 |
| 11 | 2894 | 0.001948 | 0.845805 | 0.064296 | 8.415546 | 41 | 2819 | -0.00203 | -0.75065 | 0.146025 | 8.452651 |
| 12 | 2891 | 0.002712 | 0.831151 | 0.067008 | 5.927867 | 42 | 2819 | 0.016303 | 1.398636 | 0.162328 | 2.148878 |
| 13 | 2891 | 0.007619 | 3.636681 | 0.074626 | 9.879909 | 43 | 2816 | -0.00036 | -0.19961 | 0.16197 | 13.78726 |
| 14 | 2890 | 0.00418 | 1.904745 | 0.078806 | 9.597348 | 44 | 2813 | 0.000909 | 0.473751 | 0.162879 | 12.79514 |
| 15 | 2886 | 0.004418 | 1.930519 | 0.083224 | 9.39044 | 45 | 2812 | 0.000445 | 0.213699 | 0.163324 | 11.69442 |
| 16 | 2883 | 0.002092 | 0.773442 | 0.085316 | 7.883869 | 46 | 2810 | 0.001685 | 0.796185 | 0.165009 | 11.49732 |
| 17 | 2876 | 0.003977 | 1.889414 | 0.089293 | 10.28927 | 47 | 2805 | 0.000934 | 0.389377 | 0.165943 | 10.0899 |
| 18 | 2873 | 0.002218 | 1.059537 | 0.091512 | 10.30152 | 48 | 2805 | -0.0021 | -0.73996 | 0.163842 | 8.328324 |
| 19 | 2869 | 0.002198 | 0.835503 | 0.09371 | 8.172932 | 49 | 2801 | 0.002011 | 1.00554 | 0.165853 | 11.84551 |
| 20 | 2867 | 0.003203 | 1.572729 | 0.096912 | 10.64076 | 50 | 2799 | 0.003753 | 1.043311 | 0.169606 | 6.668481 |
| 21 | 2862 | 0.002943 | 1.476961 | 0.099856 | 10.93453 | 51 | 2794 | 0.007518 | 3.246718 | 0.177124 | 10.71129 |
| 22 | 2860 | 0.00518 | 2.520312 | 0.105036 | 10.89596 | 52 | 2791 | 0.018761 | 1.621943 | 0.195885 | 2.348401 |
| 23 | 2858 | 0.003772 | 1.878721 | 0.108808 | 11.30018 | 53 | 2791 | 0.00026 | 0.101232 | 0.196145 | 10.48572 |
| 24 | 2855 | 0.000904 | 0.380255 | 0.109711 | 9.422488 | 54 | 2789 | 0.003281 | 1.740039 | 0.199426 | 14.39305 |
| 25 | 2851 | 0.002146 | 1.005159 | 0.111857 | 10.47879 | 55 | 2786 | 0.001988 | 1.026197 | 0.201414 | 14.02251 |
| 26 | 2848 | 0.000303 | 0.12855 | 0.11216 | 9.333532 | 56 | 2779 | 0.002277 | 0.689893 | 0.20369 | 8.248446 |
| 27 | 2846 | 0.001688 | 0.845631 | 0.113848 | 10.97745 | 57 | 2777 | 0.004156 | 1.319425 | 0.207846 | 8.740849 |
| 28 | 2845 | 0.000108 | 0.052385 | 0.113956 | 10.48859 | 58 | 2775 | 0.000849 | 0.474652 | 0.208695 | 15.31769 |
| 29 | 2842 | -0.00103 | -0.35383 | 0.112927 | 7.215256 | 59 | 2768 | 0.00257 | 1.401607 | 0.211265 | 14.99739 |
| 30 | 2838 | 0.006366 | 3.178908 | 0.119293 | 10.87645 | 60 | 2767 | 0.006646 | 0.870002 | 0.217912 | 3.682436 |
Analysis of the table reveals that only five of the sixty AARs are negative; however, none of them having t-statistics lower than -1.00 indicating that these negative AARs are not significant even at ten percent level. Among the remaining fifty-five days with positive AARs, the highest t-statistic associated with any day is 3.64 (for day 13). These positive AARs for majority of the days studied is reflected in a steady increase in the CAARs, which begins with 0.02 on the first trading day post-listing and goes up to 0.22 by the end of trading day sixty (three months post-listing), with an associated t-statistic of 3.68. Further, of all the sixty positive CAARs, fifty-nine are found to be significant at five percent level and, of these, fifty-seven are found to be significant at one percent level. These observations indicate that, for the sample of 2,925 IPOs that went public after the abolition of CCI for the period 1992-2011, the post-listing performance up to three months from listing, excluding initial return, has been positive. Such positive performance of IPOs is both economically and statistically significant. Continuing further, five years after listing (trading day 1,250 from listing), the CAAR has been 4.92 with a t-statistic value of 72.85. Such statistically significant post-listing performance of IPOs in the long run for the sample of 2,925 IPOs lead us to reject hypothesis two in our study that investors cannot earn abnormal returns from IPOs in the post-listing period. Further, the finding that IPOs in India yield significant positive return to investors is in contrast to the international findings that, post-listing, IPOs underperform in the long run (for example, Aggarwal & Rivoli, 1990; Ritter, 1991; Aggarwal et al., 1993; Loughran & Ritter, 1995; to mention a few). However, the finding is partially consistent with some of the Indian studies. Table 3 below also shows CAAR and the corresponding t-statistic at intervals of one-year, three-years and five-years, post-listing.
| Table 3 1-Year, 3-Years, and 5-Years Post-Listing Performance of IPOS for the Sample |
||||||
|---|---|---|---|---|---|---|
| 1 Year Post-Listing (250 Days Post-Listing) | 3 Years Post-Listing (750 Days Post-Listing) | 5 Years Post-Listing (1,250 Days Post-Listing) | ||||
| CAAR | t-statistic | CAAR | t-statistic | CAAR | t-statistic | |
| (N=2,925) | 0.6904 | 18.5165 | 3.2191 | 33.8072 | 4.9193 | 72.8534 |
Cross Sectional Analysis
In this section, study analyses the initial as well as post-listing performance of the whole sample using two important criteria: method of pricing the issue and sector-wise break-up of the whole sample.
Fixed Price vs. Book Building IPOs
Book building method of pricing IPOs is expected to lead to better price discovery in an IPO and, therefore, lower underpricing on the listing day (Benveniste & Spindt, 1989 for example). Table 4 exhibits listing day performance of book-built and fixed-price IPOs.
| Table 4 Listing Day Performance Using Closing Price on the Listing Day Based on Issue Pricing Method, Both Raw And Market-Adjusted Using BSE 200, BSE 100, BSE Sensex, and Nifty |
|||||
|---|---|---|---|---|---|
| Type of Return/Issue Method | Raw Return (%) | BSE 200 Adjusted Return (%) | BSE 100 Adjusted Return (%) | BSE Sensex Adjusted Return (%) | Nifty Adjusted Return (%) |
| Fixed Price Issues (2567) | 65.56*(22.23) | 59.63*(20.64) | 58.63* (20.29) | 59.37*(20.53) | 58.7*(20.3) |
| Book Built Issues (367) | 22.79*(8.92) | 22.40*(9.08) | 22.37*(9.07) | 22.30*(9.00) | 22.33*(9.00) |
| Total Sample(2934) | 60.21*(23.04) | 54.97*(21.5) | 54.09*(21.16) | 54.74*(21.39) | 54.16*(21.14) |
* Significant at 1% level
Parametric t-test values are shown in parenthesis
From Table 4, it is evident that book building has reduced the magnitude of underpricing in India to a great extent. Such a finding is in line with the international finding that book building leads to better price discovery and reduces the magnitude of ‘money left on the table’ in an IPO. Study next analyses long-run performance of fixed-price and book-built IPOs up to five years i.e., 1,250 trading days.
| Table 5 1-Year, 3-Years, and 5-Years Post-Listing Performance of Book-Built and Fixed-Priced IPOS |
||||||
|---|---|---|---|---|---|---|
| Type of Return/Issue Method | 1 Year Post-Listing(250 Days Post-Listing) | 3 Years Post-Listing(750 Days Post-Listing) | 5 Years Post-Listing(1,250 Days Post-Listing) | |||
| CAAR | t-statistic | CAAR | t-statistic | CAAR | t-statistic | |
| Fixed Price Issues(2558) | 0.8287 | 19.1424 | 3.8377 | 34.4297 | 5.8804 | 77.2121 |
| Book Built Issues(367) | -0.194 | -7.5681 | -0.4201 | -6.6272 | -0.5686 | -6.3728 |
| Total Sample (2925) | 0.6904 | 18.5165 | 3.2191 | 33.8072 | 4.9193 | 72.8534 |
Table 5 reveals that, consistent with the performance of whole sample, the long-run performance of fixed-price issues has been positive and significant up to five years and beyond. However, the long-run performance of book-built issues has been negative and significant which is consistent with Hawaldar, et al., that book-built IPOs underperform in the long run. The finding that book-built IPOs underperform in the long run is in line with most of the international findings that IPOs underperform in the long run.
Sector-wise Performance
In this sub-section, study analyses listing day as well as long-run performance of IPOs, sector-wise. Following Hawaldar et al., the present study divides the whole sample into nine major sectors. Following table exhibits the listing day performance, both raw and market-adjusted, sector-wise (Table 6).
| Table 6 Sector-Wise Listing Day Performance, Both Raw and Market-Adjusted Using BSE 200, BSE 100, BSE Sensex And Nifty Using Closing Price on the Listing Day |
|||||
|---|---|---|---|---|---|
| Type of Return/Sector | Raw Return (%) | BSE 200 Adjusted Return (%) | BSE 100 Adjusted Return (%) | BSE Sensex Adjusted Return (%) | Nifty Adjusted Return (%) |
| Banking and Finance (331) | 63.55*(5.11) | 63.31*(5.06) | 62.61*(5.01) | 62.50*(5.00) | 62.30*(4.98) |
| Chemical and Engineering(621) | 58.73*(13.32) | 52.50*(12.37) | 51.49*(12.13) | 52.28*(12.31) | 51.66*(12.13) |
| Software and IT(172) | 66.86*(7.18) | 64.48*(6.90) | 64.34*(6.93) | 64.55*(6.93) | 64.36*(6.90) |
| Infrastructure(541) | 56.92*(8.93) | 48.68*(8.18) | 48.14*(8.08) | 49.18*(8.21) | 48.43*(8.08) |
| Pharma and Healthcare(234) | 83.98*(7.02) | 81.25*(7.17) | 80.46*(7.04) | 80.71*(6.99) | 80.23*(6.99) |
| Media and Entertainment(181) | 57.82*(5.62) | 56.49*(5.72) | 55.14*(5.57) | 56.28*(5.64) | 55.72*(5.58) |
| FMCG(545) | 53,51*(12.80) | 46.25*(10.76) | 45.20*(10.62) | 45.91*(10.94) | 45.18*(10.68) |
| Mining and Minerals(75) | 38.80*(4.19) | 33.80*(3.63) | 32.37*(3.51) | 33.38*(3.61) | 32.25*(3.48) |
| Agriculture and Allied Activities(234) | 62.16*(8.64) | 56.61*(7.82) | 55.33*(7.67) | 55.76*(7.74) | 55.35*(7.67) |
| Total Sample(2934) | 60.21*(23.04) | 54.97*(21.50) | 54.09*(21.16) | 54.74*(21.39) | 54.16*(21.14) |
* Significant at 1% level
Parametric t-test values are shown in parenthesis
Of the nine sectors, pharma and healthcare registers highest underpricing of over 80%, both raw and market-adjusted. Such a finding is in line with Komenkul & Kiranand (2017) who report that healthcare and biopharmaceutical IPOs from ASEAN countries over perform in the long run up to three years. Further, in our study IPOs belonging to mining and minerals have registered the lowest underpricing among all sectors with less than 40%. Overall, all the nine sectors have documented statistically significant underpricing on the listing day which is consistent with the performance of whole sample of the study and most of the international findings on underpricing. Finally, the study analyses sector-wise long-run performance of IPOs (Table 7).
| Table 7 1-Year, 3-Years, and 5-Years Post-Listing Performance of IPOS, Sector Wise |
||||||
|---|---|---|---|---|---|---|
| Type of Return/Sector | 1 Year Post-Listing(250 Days Post-Listing) | 3 Years Post-Listing(750 Days Post-Listing) | 5 Years Post-Listing(1,250 Days Post-Listing) | |||
| CAAR | t-statistic | CAAR | t-statistic | CAAR | t-statistic | |
| Banking and Finance(330) | -0.5554 | -6.5918 | -3.0949 | -11.6956 | -4.1224 | -26.575 |
| Chemical and Engineering(621) | 0.6225 | 7.5531 | 3.2441 | 9.6837 | 5.3867 | 29.1465 |
| Software and IT(172) | 0.7089 | 7.3791 | 2.5972 | 9.8423 | 3.8439 | 21.8421 |
| Infrastructure(540) | 0.7746 | 35.7335 | 2.7539 | 47.9045 | 4.3545 | 61.0571 |
| Pharma and Healthcare(231) | 0.7483 | 7.7338 | 4.0087 | 16.9708 | 5.7249 | 26.414 |
| Media and Entertainment(181) | 0.3509 | 3.082 | 2.6193 | 7.9675 | 3.6826 | 14.1866 |
| FMCG(542) | 0.7854 | 5.9574 | 3.2897 | 16.8147 | 5.2519 | 30.9077 |
| Mining and Minerals(75) | 0.9285 | 5.3618 | 3.3597 | 5.5826 | 5.3428 | 12.545 |
| Agricultural and Allied Activities(233) | 0.7712 | 6.0877 | 4.8667 | 10.4316 | 7.5057 | 26.2764 |
| Total Sample (2925) | 0.6904 | 18.5165 | 3.2191 | 33.8072 | 4.9193 | 72.8534 |
Among all the nine sectors, banking and finance is the only sector to register negative performance post-listing up to five years and beyond. Such a finding is of special interest for us considering the fact that, during its regime, CCI was very restrictive in allowing IPOs from ‘unproductive’ areas like finance and leasing. After the abolition of CCI and the introduction of free-pricing, the share of public issues belonging to finance sector rose from 6 percent in 1992-93 to 33 percent in 1994-95 (Karmakar, 2002). All the remaining eight sectors have documented highly significant positive performance in the long run consistent with the long-run performance of the whole sample; but contradicting most of the international findings that IPOs underperform in the long run.
Conclusion
Taking a sample of 2,934 IPOs that came to the market during the free-pricing era between 1992 and 2011, study documents an average raw underpricing (not adjusted for market movement) of 60.21 percent when computed from the offering price to the closing price on the listing day. Such economically and statistically significant underpricing persists when computed from the offering price to the opening, high, and low price on the listing day and also when adjusted for market movement using different market indices. Such a finding on the listing day performance of IPOs for the sample of 2,934 IPOs lead us to reject the first hypothesis that IPOs are not underpriced based on the listing day performance.
Evaluating the long-run performance of IPOs in India, we find that IPOs that went public between 1992 and 2011 offer positive return to the investors who purchase these IPO shares at the closing price on the listing day. Using CAAR measure, study reports positive returns significant at 1 percent level, for one-year, three-years, and five-years intervals. The findings on long-run performance of IPOs in the aftermarket lead us to reject the second hypothesis that investors cannot earn abnormal returns from IPOs in the post-listing period performance. The initial and post-listing performance documented in the present study is in line with Kamaludin & Zakaria (2019) who find that IPOs in Saudi Arabia are underpriced; while, in the long run up to eighteen months from the date of listing, these same IPOs offer positive and significant market-adjusted returns to the investors. The cross-sectional analysis of the whole sample in our study highlights that introduction of book building has reduced the magnitude of underpricing in India which is why book building method of pricing the public issues is becoming increasingly popular in India.
Overall, in line with the international evidence on IPO underpricing, the present study finds that IPOs in India are also underpriced. Such a finding is consistent with findings of other studies on Indian IPOs. To mention a few, Narasimhan & Ramana, Madhusoodanan & Thiripalraju, Karmakar, Chaturvedi, et al.,, Sehgal & Singh, Garg et al.,; Hawaldar et al. As regards long-run performance of IPOs, study documents major departure from internationally observed phenomenon. While vast majority of researchers have found long-run underperformance of IPOs, we document that IPOs in India offer positive return to the investors in the long run as well.
Research Implications
After the abolition of CCI and the introduction of free-pricing of public issues, capital market in India witnessed hectic activities. We have found in our study that as many as 524 IPO companies got delisted within one year of listing and 111 IPOs had a listing delay of more than one year from issue closing date (not reported in the present study). It was a clear indication that many fly-by-night companies took unfair advantage of free-pricing of public issues allowed by the market regulator. Of course, the market regulator SEBI stepped in tightening the guidelines for the IPO companies. Further, during the post-2000 decade, a large number of IPO companies cashed the positive market sentiment by raising huge amount of capital. During the 13-month short period from January 2007 to January 2008 as many as 34 IPOs got their issues oversubscribed by more than 25 times; the highest one being 160 times. However, the long-run performance, up to five years, of the sub-sample of 464 IPOs belonging to the period 2001-2011 has been negative and significant (again, not reported in the present study). Therefore, considering the existence of ‘windows of opportunity’ for the issuers, policy makers must ensure that IPO investors do not end up on the losing side in the long run. Likewise, prospective IPO investors also should consider the fundamentals of IPO companies more than the prevailing market sentiment at the time of making their investment decision.
References
- Affleck-Graves, J., Hegde, S.P., Miller, R.E., & Reilly, F.K. (1993). The effect of the trading system on the underpricing of initial public offerings. Financial Management, 22(1), 99-108.
- Aggarwal, R., & Rivoli, P. (1990). Fads in the initial public offering market? Financial Management, 19(4), 45-57.
- Aggarwal, R.K., Krigman, L., & Womack, K.L. (2002). Strategic IPO underpricing, information momentum and lockup expiration selling. Journal of Financial Economics, 66(1), 105-137.
- Aggarwal, R., Leal, R., & Hernandez, L. (1993). The after-market performance of initial public offerings in Latin America. Financial Management, 22(1), 42-53.
- Ahmad-Zaluki, N.A., Campbell, K., & Goodacre, A. (2007). The long run share price performance of Malaysian Initial Public Offerings (IPOs). Journal of Business Finance & Accounting, 34(1-2), 78-110.
- Allen, F., & Faulhaber, G. (1989). Signalling by underpricing in the IPO market. Journal of Financial Economics, 23(2), 303-323.
- Alvarez, S., & Gonzalez, V.M. (2005). Signalling and the long-run performance of Spanish Initial Public Offerings (IPOs). Journal of Business, Finance & Accounting, 32(1-2), 325-350.
- Amihud, Y., Hauser, S., & Kirsh, A. (2003). Allocations, adverse selection, and cascades in IPOs: Evidence from the Tel Aviv stock exchange. Journal of Financial Economics, 68(1), 137-158.
- Barber, B.M., & Lyon, J. (1997). Detecting long-run abnormal stock return: The empirical power and specification of test statistics. Journal of Financial Economics, 43(3), 341-372.
- Baron, D.P. (1982). A model of the demand for investment banking advising and distribution services for new issues. The Journal of Finance, 37(4), 955-976.
- Bessler, W., & Thies, S. (2006). Initial public offerings, subsequent seasoned equity offerings, and long run performance: Evidence from IPOs in Germany. Journal of Entrepreneurial Finance, 11(3), 1-37.
- Bolar, S., Pinto, P., & Hawaldar, I.T. (2017). Semi-monthly effect in stock returns: New evidence from Bombay stock exchange. Investment Management and Financial Innovations, 14(3), 160-172.
- Bora, B., Adhikary, A., & Jha, A. (2012). Book building process: A mechanism for efficient pricing in India. International Journal of Trade, Economics and Finance, 3(2), 109-113.
- Brav, A., Gecy, C., & Gompers, P.A. (2000). Is the abnormal return following equity issuances anomalous? Journal of Financial Economics, 56(2), 209-249.
- Cai, X., & Liu, G. (2008). The long-run performance of initial public offerings and its determinants: The case of China. Review of Quantitative Finance & Accounting, 30(4), 419-432.
- Carter, R.B., Dark, F.H., & Singh, A.K. (1998). Underwriter reputation, initial returns, and the long-run performance of IPO Stocks. The Journal of Finance, 53(1), 285-311.
- Chaturvedi, A., Pandey, A., & Ghosh, S.K. (2006). Firm financing through IPOs: A study of causal variables responsible for under-pricing. Vision, 10(3), 23-33.
- Cheng, P. (2015). Do initial reserves signal long-term IPO stock performance. Cogent Economics and Finance, 3, 1018697
- Cheng, W.Y., Cheung, Y.L., & Po, K.K. (2004). A note on the intraday patterns of initial public offerings: Evidence from Hong Kong. Journal of Business Finance & Accounting, 31(5-6), 837-860.
- Cheung, C.S., & Krinsky, I. (1994). Information asymmetry and the underpricing of initial public offerings: further empirical evidence. Journal of Business, Finance & Accounting, 21(5), 739-747.
- Cook, D.O., Kieschnick, R., & Ness, R.A.V. (2006). On the marketing of IPOs. Journal of Financial Economics, 82(1), 35-61.
- Demers, E., & Lewellen, K. (2003). The marketing role of IPOs: Evidence from internet stocks. Journal of Financial Economics, 68(3), 413-437.
- Dewenter, K.L., & Malatesta, P.H. (1997). Public offerings of state-owned and privately-owned enterprises: An international comparison. The Journal of Finance, 52(4), 1659-1679.
- Drake, P.D., & Vetsuypens, M.R. (1993). IPO underpricing and insurance against legal liability. Financial Management, 22(1), 64-73.
- Garfinkel, J.A. (1993). IPO underpricing, insider selling and subsequent equity offerings: Is underpricing a signal of quality? Financial Management, 22(1), 74-83.
- Garg, A., Arora, P., & Singla, R. (2008). IPO underpricing in India. The ICFAI Journal of Applied Finance, 14(3), 33-42
- Ghosh, S. (2005). Underpricing of initial public offerings: The Indian experience. Emerging Markets Finance and Trade, 41(6), 45-57.
- Gompers, P.A., & Lerner, J. (2003). The really long-run performance of initial public offerings: The pre-nasdaq evidence. The Journal of Finance, 58(4), 1355-1392.
- Grinblatt, M., & Hwang, C.Y. (1989). Signalling and the pricing of new issues. The Journal of Finance, 44(2), 393-420
- Guo, R.J., Lev, B., & Shi, C. (2006). Explaining the short- and long-term IPO anomalies in the US by R&D. Journal of Business, Finance & Accounting, 33(3-4), 550-579.
- Hameed, A., & Lim, G.H. (1998). Underpricing and firm quality in initial public offerings: Evidence from Singapore. Journal of Business, Finance & Accounting, 25(3-4), 455-468.
- Hawaldar, I.T., Kumar, K.R.N., & Mallikarjunappa, T. (2018). Pricing and performance of IPOs: Evidence from Indian stock market. Cogent Economics & Finance, 6(1), 1-20.
- Hawaldar, I.T. (2018). The reaction of stock prices to earnings announcements. Asian Journal of Multidimensional Research, 7(9), 282-293.
- Hill, P. (2006). Ownership structure and IPO underpricing. Journal of Business Finance & Accounting, 33(1-2), 102-126.
- Ibbotson, R.G. (1975). Price performance of common stock new issues. Journal of Financial Economics, 2(3), 235-272
- Iqbal, T.H., & Mallikarjunappa, T. (2011). Efficiency of stock market: A study of stock price responses to earnings announcements. Germany: LAP Lambert Academic Publishing Company.
- Iqbal, T.H., & Mallikarjunappa, T. (2009). Indian stock market reaction to the quarterly earnings information. Indian Journal of Finance, 3(7), 43-50.
- Iqbal, T.H., & Mallikarjunappa, T. (2010). A Study of Efficiency of the Indian Stock Market. Indian Journal of Finance, 4(5), 32-38.
- Iqbal, T.H. (2014). Seasonal analysis of abnormal returns after quarterly earnings announcements. International Journal of Accounting and Financial Reporting, 4(2), 501-519.
- Iqbal, T.H., & Mallikarjunappa, T. (2007). Market reaction to earnings information: An empirical study. AIMS International Journal of Management, 1(2), 153-167.
- Jaskiewicz, P., Gonzalez, V.M., Menendez, S., & Schiereck, D. (2005). Long-run IPO performance analysis of German and Spanish family-owned business. Family Business Review, 18(3), 179-202.
- Kamaludin, K., & Zakaria, N. (2019). The short and long-run performance of Sharia-compliant Initial Public Offerings (IPOs) in the emerging market: evidence from the Saudi Arabia Market. Journal of Reviews on Global Economics, 8, 706-716.
- Karmakar, M. (2002). Initial public offerings: Underpriced or fads? A penny in whose pocket? The ICFAI Journal of Applied Finance, 8(6), 5-18.
- Komenkul, K., & Kiranand, S. (2017). Aftermarket performance of health care and biopharmaceutical IPOs: Evidence from ASEAN countries. The Journal of Health Care Organisation, Provision, and Financing, 54, 1-11.
- Krishnamurti, C., & Kumar, P. (2002). The initial listing performance of Indian IPOs. Managerial Finance, 28(2), 39-51
- Kumar, A., Soni, R., Hawaldar, I.T., Vyas, M., & Yadav, V. (2020). The testing of efficient market hypotheses: A study of Indian pharmaceutical industry. International Journal of Economics and Financial Issues, 10(3), 208- 216.
- Kumar, K.R.N., & Mallikarjunappa, T. (2013). A study of pricing and performance of public issues in Indian capital market. Ph.D. Thesis submitted to Mangalore University in September
- Kumar, K.R.N., Hawaldar, I.T., & Mallikarjunappa, T. (2018). Windows of opportunity and seasoned equity offerings: An empirical study. Cogent Economics & Finance, 6(1), 1-18.
- Lee, P.J., Taylor, S.L., & Walter, T.S. (1999). IPO underpricing explanations: Implications from investor application and allocation schedules. Journal of Financial and Quantitative Analysis, 34(4), 425-444.
- Levis, M. (1993). The long-run performance of initial public offerings: The UK Experience 1980-1988. Financial Management, 22(1), 28-41.
- Ljungqvist, A.P., & Wilhelm Jr., W.J. (2002). “IPO allocations: Discriminatory or discretionary? Journal of Financial Economics, 65(2), 167-201.
- Loughran, T., & Ritter, J.R. (1995). The new issue puzzle. The Journal of Finance, 50(1), 23-51.
- Loughran, T., & Ritter, J.R. (2002). Why don’t issuers get upset about leaving money on the table in IPOs? The Review of Financial Studies, 15(2), 413-443.
- Loughran, T. (1993). NYSE vs. NASDAQ returns: Market microstructure or the poor performance of initial public offerings? Journal of Financial Economics, 33(2), 241-260.
- Lowry, M., & Murphy, K.J. (2007). Executive stock options and IPO underpricing. Journal of Financial Economics, 85(1), 39-65.
- Lowry, M., & Shu, S. (2002). Litigation risk and IPO underpricing. Journal of Financial Economics, 65(3), 309-335.
- Madhusoodanan, T.P., & Thiripalraju, M. (1997). Under-pricing in initial public offerings: The Indian evidence. Vikalpa, 22(4), 17-30.
- Mallikarjunappa, T., & Iqbal, T.H. (2003). Stock price reactions to earnings announcement. Journal of IAMD and IUCBER, 26(1), 53-60.
- McGuinness, P. (1993). The post-listing return performance of unseasoned issues of common stock in Hong Kong. Journal of Business Finance & Accounting, 20(2), 167-194.
- Michaely, R., & Shaw, W.H. (1994). The pricing of initial public offerings: Tests of adverse-selection and signaling theories. The Review of Financial Studies, 7(2), 279-319.
- Muscarella, C., & Vetsuypens, M.R. (1989). A simple test of Baron's model of IPO underpricing. Journal of Financial Economics, 24(1), 125-135.
- Narasimhan, M.S., & Ramana, L.V. (1995). Pricing of initial public offerings: Indian experience with equity issues. The ICFAI Journal of Applied Finance, 1(1), 26-39.
- Page, M.J., & Reyneke, I. (1997). The timing and subsequent performance of Initial Public Offerings (IPOs) on the Johannesburg stock exchange. Journal of Business Finance & Accounting, 24(9-10), 1401-1420.
- Pinto, P., Hawaldar, I.T, Guruprasad, K., Rohit, B., Spulbar, C., Birau, R., & Stanciu, C.V. (2020). The impact of risk anomalies on the pharmaceutical sector of the Indian stock market: A comparative analysis between pharmaceutical, FMCG and IT Companies. Revista de Chimie Journal, 71(2), 58–63.
- Rajan, R., & Servaes, H. (1997). Analyst following of initial public offerings. Journal of Finance, 52(2), 507-529.
- Rathnayake, D.N., Louembe, P.A., & Kassi, D.F. (2019). Are IPOs underpriced or overpriced? Evidence from an emerging market. Research in International Business and Finance, 50, 171-190.
- Ritter, J.R. (1984). The “Hot Issue” market of 1980. The Journal of Business, 57(2), 215-240.
- Ritter, J.R. (1987). The costs of going public. Journal of Financial Economics, 19(2), 269-281.
- Ritter, J.R. (1991). The long-run performance of initial public offerings. The Journal of Finance, 46(1), 3-27.
- Rock, K. (1986). Why new issues are underpriced. Journal of Financial Economics, 15(1-2), 187-212.
- Sakharkar, A., & Ramesh, B. (2019). Pricing and performance of Initial Public Offerings (IPOs): Evidence from Indian Stock Markets. International Journal of Research and Analytical Reviews, 6(1), 675-683.
- Sehgal, S., & Singh, B. (2007). The initial and after-market performance of Indian IPOs. The ICFAI Journal of Applied Finance, 13(11), 16-36.
- Steib, S., & Mohan, N. (1997). The German reunification, changing capital market conditions, and the performance of german initial public offerings. Quarterly Review of Economics & Finance, 37(1), 115-137.
- Welch, I. (1989). Seasoned offerings, imitation costs, and the underpricing of initial public offerings. The Journal of Finance, 44(2), 421-449.
- Welch, I. (1992). Sequential sales, learning, and cascades. The Journal of Finance, 47(2), 695-732.