Research Article: 2018 Vol: 17 Issue: 5
Productivity for Agro-Based Industrial Sub-Sector in Malaysia using Malmquist Index
Siti Marsila Mhd Ruslan, Universiti Malaysia Terengganu
Abstract
This paper studies about the efficiency and productivity of seven sub-sectors involved in agro-based industry in Malaysia from year 1993-2003 (after 10 years of implementation of First National Agricultural Policy). The study is conducted using Malmquist productivity index to observe the productivity efficiency trend throughout years and sectors. Based on the result, the Malmquist index shows that year 2002 recorded the highest total productivity index at 2.351, contributed by the technical change value at 2.121; while the cocoa industry recorded the highest total productivity index among all sectors with the index of 1.007. Most of the sub-sector of agro-based industry does not show the productivity growth due to the lack of technical factor and weak marketing strategy.
Keywords
Efficiency, Agro-Based Industry, Malmquist Index.
Introduction
Behind the transformation of economic restructuring that Malaysia experienced in the 90’s until 2000’s, the agricultural sector is still being regarded as the most important sector due to its role as the sole food provider and act as the inputs for manufacturing sector. The agricultural sector in Malaysia can be categorized into two categories. The first category is the primary production field, while the second is the agro-based industry. The primary production on the other hand is divided into two; plantation and estate sector, as well as small holder (Hirnissa & Muzafar, 2007). All crop production can be processed into food or used for industrial purpose. Meanwhile, the agro-based industry is made up from food processing activities, support services, logistic marketing and agro-tourism. With that, the agricultural sector and agro-based sector in Malaysia cover a big proportion of economic sector where the operator or sole proprietor in the agricultural field or corporate entity which has upstream and downstream activities are consolidated under one roof. In this case, it refers to the Malaysian agricultural entity (Mat Nasir & Ghazali, 2007). Following to this consequence, the National Agricultural Policy (NAP) was launched by the government in 1984, with an objective to maximize income through intensification in the agricultural sector and efficient use of resources. The core of this policy is to boost up the productivity, efficiency and competitiveness through the process of modernization and commercialization in every agricultural segment (Mahfoor et al., 2007).
Between the years of 1984 to 1991, there has been a rapid development by manufacturing sector due to the pressure from government that wants Malaysia to achieve advanced economic status by 2020. The situation has led to the transition of policies and development programs which have slightly changed the landscape of nation's agricultural sector. Thus, in order to ensure that the interest of agricultural sector is preserved, the NAP has been revised in 1992 and further in 1998, when the world's largest economic crisis hit (Muzafar, 2006).
The role of agricultural sector in strengthening the economic development has been evident even though sometimes it was overshadowed by the manufacturing sector. However, this sector is still relevant because almost all of the products generated require raw material resources, which has to be obtained from the agricultural sector. Hence, monitoring performance of this industry from time to time through sustaining efficiency and productivity should be carried out to find out the potential sub-sectors in the future, as well as to indicate the sub-sectors that need more attention. Sub-sectors with high efficiency and productivity will not only generate income, but also act as catalyse in national economic development.
Although many studies on the agricultural sector have been carried out, most of them were seen as paying more attention towards the field of primary production, with less focus given on agricultural-based processing industries. A study done by David et al. (2011) examines the efficiencies of key crops in the United States while Martin (1997) reviews changes in productivity in agricultural sector in China. In addition, Lilyan & Richard (1994) examines the planting productivity in developing countries. Besides, the use of the Malmquist Index as a source of productivity calculation in agricultural studies in Malaysia was also scarce, if not limited. A few studies done for example, by Yusof et al. (2006) who incorporated input and output model analysis, Ahmad & Rohana (2006) on the other hand had implemented forward and backward analysis, while Muzafar (2006) reviewed the role of the agricultural sector in Malaysian economic growth using location quotient analysis.
On conceptual approach, a quantitative method to measure productivity changes is done by comparing changes in output to changes in inputs. This relationship is based on the set of possible outputs either in the current or in future time. Given a large number of outputs with several lot of inputs however, the concept of production function is not implemented in such comparison. Taking an example, Caves et al. (1982) had proposed the use of ratio of two distance functions to implement the determination of productivity changes. They pointed out that under some circumstances, the Malmquist ratio can be as almost equal as the Tornqvist index, while showing an impression that Tornqvist index was more accurate for technical use because of its “translog nature”, which is more flexible, hence more reliable.
Nonetheless, Malmquist index is seen as more suitable to be used at any time interval (depending on whether the technology referral is at the starting point period or at the consequent period). Fare et al. (1992) has suggested the average use of geometry for two intervals of time. Thus, indicates that the Malmquist index has an added ability to decompose into two other components: changes in relative and technical components; and a mere technical component change. Fare et al. (1992) also explains that under constant return to scale and in order to maximize profits, the input-based Malmquist productivity index can be as equivalent as the ratio of two Fisher indexes. In terms of data requirements, the Malmquist index only requires quantity data, while for Fisher and Tornqvist indexe, more pricing data for both input and output are needed. This situation is quite tough since most of the data obtained are lack of price data, especially for output.
In this study, the approach done by Galdeno (2006) is incorporated, which is based on the Malmquist index output-based technique. Therefore, it can be assumed that for each period of time, production technology is used to model input transformation to output.
The scope of this study focuses on seven sub-sectors of agro-based processing industry, which are coconut oil manufacturing, palm oil manufacturing, chocolate production, coffee production, rubber production, rice production and wheat flour. In addition, this study also uses data from year 1993 to 2003 to look at the trend of efficiency and productivity of the industry after 10 years of implementation of NAP; that also covers the economic crisis happened in 1998 and 2001. Through the findings of the data obtained, the sub-sector's efficiency and productivity trends are built to assess the effectiveness of government strategies in improving the performance of the sector as well as to assess the nation’s economic condition during the economic downturn.
Data
In order to measure the productivity of sub-sectors, a data searching was conducted for both inputs and outputs, before computed into Malmquist Index. The sub-sectors involved are coconut oil manufacturing, palm oil manufacturing, chocolate production, coffee production, rubber production, rice production and wheat flour. All data are taken from the Department of Statistics, Malaysia from the period of 1993 until 2003.
Methodology
The Malmquist Index (MI) is a bilateral index that can be used to compare the production technology of two economies. The MI is based on the concept of the production function. This is a function of maximum possible production, with respect to a set of inputs pertaining to capital and labour. So, if Sa is the set of labour and capital inputs to the production function of Economy A, and Q is the production function of Economy , then the function can be rewritten as Q = fa (Sa).
While the production function would normally apply to an enterprise, it is possible to calculate it for an entire region or nation, which in this case is applied for the agro sub-sectors. This would be called the aggregate production function. To calculate the Malmquist Index of economy A with respect to economy B the labour and capital inputs of economy A must be substituted into the production function of B and vice versa. The formula for MI is given below.
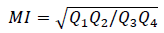 (1)
(1)
Where,


The MI of A with respect to B is the reciprocal of the MI of B with respect to A. If the MI of A with respect to B is greater than 1, the aggregate production technology of economy A is superior to that of economy B
Results
The computational of Malmquist Index is done using DEAP 2.1 software and the following is the result obtained. Based on Table 1, throughout 1993 to 2003, the agro-based processing industry recorded an overall average productivity growth of 7.6%. The source of the growth of this index is influenced by the index of relative efficiency change of 6.3% and the change in technical efficiency by 4.0%. The index also relates the relative efficiency changed into two other sub-efficiencies: Pure Efficiency Change (PEC) and Scale Efficiency Change (SEC) with each contributing to 4.1% and 2.1%.
| Table 1 Malmquist Productivity Index For Year 1993-2003 |
|||||
| Year | Relative Effective Change (REC) | Technical Change (TC) | Pure Efficiency Change (PEC) | Scale Efficiency Change (SEC) | Malmquist Index Total Factor (MITF) |
| 1993 | 0.931 | 0.965 | 0.858 | 1.086 | 0.899 |
| 1994 | 1.592 | 0.301 | 1.515 | 1.051 | 0.479 |
| 1995 | 0.901 | 1.276 | 0.865 | 1.042 | 1.150 |
| 1996 | 1.218 | 0.955 | 1.175 | 1.036 | 1.163 |
| 1997 | 0.953 | 1.187 | 0.941 | 1.013 | 1.132 |
| 1998 | 1.063 | 1.039 | 1.041 | 1.021 | 1.076 |
| 1999 | 1.034 | 1.051 | 1.102 | 0.939 | 1.087 |
| 2000 | 1.003 | 1.457 | 0.944 | 1.063 | 1.462 |
| 2001 | 0.904 | 0.472 | 0.942 | 0.959 | 0.427 |
| 2002 | 1.113 | 2.121 | 1.059 | 1.051 | 2.361 |
| 2003 | 0.977 | 0.621 | 1.008 | 0.969 | 0.598 |
| Average | 1.063 | 1.040 | 1.041 | 1.021 | 1.076 |
Meanwhile, Table 2 shows the productivity index for each component involved. Industries that recorded positive growth for REC were coconut oil manufacturing, cocoa and chocolate manufacturing, coffee production and rubber products; while for overall efficiency change, the industry that recorded with positive growth was cocoa manufacturing.
| Table 2 Malmquist Productivity Index Based On Sub-Sectors |
|||||
| Sub-sectors | Relative Effective Change (REC) | Technical Change (TC) | Pure Efficiency Change (PEC) | Scale Efficiency Change (SEC) | Malmquist Index Total Factor (MITF) |
| Coconut | 1.026 | 0.941 | 1.000 | 1.026 | 0.966 |
| Palm Oil | 1.000 | 0.887 | 1.000 | 1.000 | 0.887 |
| Cocoa | 1.101 | 0.915 | 1.097 | 1.003 | 1.007 |
| Coffee | 1.085 | 0.909 | 1.002 | 1.082 | 0.986 |
| Rubber | 1.132 | 0.878 | 1.096 | 1.033 | 0.994 |
| Rice | 0.993 | 0.924 | 0.996 | 0.997 | 0.917 |
| Wheat | 1.000 | 0.925 | 1.000 | 1.000 | 0.925 |
| Average | 1.048 | 0.911 | 1.028 | 1.020 | 0.955 |
Although the productivity index in most industries has an increasing trend, it is worth noted that the increasing demand for processed agricultural materials was actually been closely linked to the source of raw material itself. The cocoa production industry is part of the major contributors in Malaysia, which recorded with positive MITF growth.
Discussion
The study conducted by Yodfiatfinda et al. (2012) once described that the determining factors for REC are the openness of an enterprise, Research and Development (R&D), training cost and information technology expense, as well as foreign ownership. Of these factors, uncontrollable factors are openness while other factors can be controlled by decision makers in a firm.
Some industries showed an increase in productivity while others posted a further dip in productivity value. Given the seven sub-industries, only one of them gave positive MITF growth while others did not exceed the index growth rate. The sub-industry with high potential for growth is the cocoa manufacturing industry. In contrast, sub-industries such as palm oil industry need to be given better attention as the productivity growth earned by the industry is the lowest among all.
Despite Malaysia is a palm oil producing country and able to produce sufficient output, it was unusual to find that negative MITF growth has been recorded (at 43.3% per year in 1994). This situation is not much different for the cocoa production industry. Although the cocoa industry recorded the highest index growth of 0.7%, but the industry is still importing almost 85% of cocoa beans for domestic consumption. Data obtained from Malaysia Cocoa Board in 2010 also supported the results by revealing that the export value of cocoa has been deteriorating with -0.62% per annum; a significant gap from the registered export value of 20.07% per annum during 1996 to 2006. Nevertheless, the finding has given a general overview of agro-based production industry in terms of MITF growth, technical efficiency and technological efficiency. At least, it shows the direction on specific sub-industries that require transformation and further improvement.
Some industries are already known as major commodity exporters such as: palm oil, rubber and cocoa industry, while some other industries are known as import substitutes for food prices such as sugar. Since the First Agricultural Policy introduced in 1984 to 1991, many infrastructure development and expansion policies have been executed although it is more focusing on specific commodities, such as palm oil and cocoa production. The Second Agricultural Policy continued from 1992 to 1998 was aimed at increasing the added value of agricultural products which further developed the agro-based industry (Muzafar, 2006).
The continuation of these two policies led to the Third Agricultural Policy (1998-2010) which provided strategic emphasis on product-based approach. Through this approach, key products and markets are identified based on demand, market potential and consumer tastes which in turn would create opportunities to increase production and improve marketing capabilities from agricultural production.
The agro-based processing industry is one of the most developed sectors in the country which largely benefiting from foreign investment. As such, foreign ownership is one of the most important factors to strengthen up the sector. On the other hand, it is heavily dependent on the global oil price, which could eventually affect the productivity index. A study conducted by Abbaspour et al. (2008) stated that an increase, though only one per cent of global oil prices, is able to worsen the growth of the MITF index as a whole. Therefore, further research and application of latest technology are needed to overcome any impendence from disrupting the sector, as well as sustaining its growth in the future.
Conclusion
Based on the result, it is shown that Malmquist's productivity index recorded the highest index value in 2002 at 2.36, while the lowest index was in 1994 at 0.479. The index in 2002 could be related to nation’s extraordinary recovery process from the economic crisis which had resulted in almost paralyzed domestic demand in 2001, promulgated by adverse impact of less effective fiscal and monetary policy of the United States. Overall, the Malmquist's total factor index has recorded an increase of 7.6% driven by the growth of relative efficiency change of 6.3% and a change in technical efficiency of 4.0%. Low efficiency changes were closely related with incorporation of agricultural technology applied by each sub-sector and based on the findings, technological advances in agro-based sectors are seen to have improved in 1995, 1997, 1998, 1999, 2000 and 2002. Nonetheless, a significant dip in 1994, 2001, and 2003, had further impacted the overall average index.
Meanwhile, the cocoa sub-sector has shown the most positive growth compared to other sub-sectors, which was at 0.7%. This is followed by rubber sub-sector at -0.6%, coffee production industry -1.4%, coconut oil manufacturing industry -3.4%, wheat industry -7.5%, rice industry -8.3% and lastly palm oil industry which was at -11.3%. Positive index growth by the cocoa sub-sector might have been contributed by the rebranding process, which has indirectly expanded its marketing strategy. As for other sub-sectors, most problems arise from the technical aspects of technological advances in generating products. Thus, to address this problem, the government has injected RM 300 million1 as additional fund for the purpose of technological exchange and business cooperation, as well as intensification of raw supply and agricultural production.
Endnote
1. The Fund For Food Loan Scheme is also known as the 3F Scheme (Fund For Food). It was introduced in 1993. To date, RM 700 million has been allocated by the Government through Central Bank of Malaysia and another RM 300 million through Malaysian Agricultural Bank as an incentive to encourage investment in major food production activities of the country.
Future Research
Through the results of the analysis and findings obtained, some limitations that prompt for further improvements can be extended through several approaches, and these include:
1. Farm transformation: Uneconomical land size requires high productivity and production costs. Programs to enhance better scale benefits such as group projects and land conservation on estate-based need to be done. In addition, good agriculture practices should be encouraged so that agricultural products would come out in good quality and safe to consume.
2. Transformation of labour force into the use of mechanization, automation and technology: Rather than heavily dependent on labour, it is essential to increase the level of production through more capitalintensive, technological and knowledge-based approach. Technology transfer programs and new cropping methods to increase productivity should be implemented so that the dependency on conventional methods can be reduced.
3. Modern farming management: Training and more facilities is important to ensure farmers are provided with technical and technological skills to increase productivity while experts and employees involved in mentoring and training activities need to be equipped with knowledge and expertise to assist farmers.
4. Creating a high level of competitiveness: Low productivity and low quality crops have resulted into uncompetitive products, which unable to compete in global markets. With high prices in the domestic market and strong demand for lower-cost agricultural output, (following the opening of markets under the World Trade Organization and ASEAN Free Trade Area) the nation’s agricultural production is expected to face high competition. With that, it is important for agricultural products to be in high quality and comply with international food safety standards, so that better products can be exported internationally and marketed locally.
5. Incentives for food products: The government can provide special incentives for food production projects. Under these incentives, companies that invest in food or agro-based production should be qualified for special incentives, apart of other incentives such as pioneer program, incentives to export and so on.
References
- Abbaspour, M., Hosseinzadeh Lotfi, F., Karbassi, A. R., Roayaei, E., & Nikoomaram, H. (2009). Development of the group Malmquist productivity index on non-discretionary factors. International Journal of Environmental Research, 3(1), 109-116.
- Ahmad, F. P., & Rohana, A. R. (2006). Key sectors in the Malaysian economy to accelerate economic growth. Universiti Putra Malaysia Press, 70-89.
- Caves, D. W., Christensen, L. R., & Diewert, W. E. (1982). The economic theory of index numbers and the measurement of input, output, and productivity. Econometrica: Journal of the Econometric Society, 50, 1393-1414.
- David, K. L., Elizabeth, Y., & Michael, L. (2011). Agricultural productivity at the national, state and farm. Risk and Profit Conference, 1-21.
- Fare, R. S., Grosskopf, B. L., & Roos, P. (1992). Productivity Changes in Swedish Pharmacies, 1980-1989: A nonparametric Malmquist Approach. Journal of Productivity Analysis 3, 85-101.
- Galdeno, G. (2006). Productivity and efficiency analysis of horticultural co-operatives. Spanish Journal of Agricultural Research 4(3), 191-201.
- Hirnissa, M. T., & Muzafar, S. H. (2007). Regional convergence in Malaysia: The case of the agriculture sector in peninsular Malaysia, Sabah and Sarawak. Universiti Putra Malaysia Press, 104-112.
- Lilyan, E. F., & Richard, K. P. (1994). Productivity in LDC Agriculture: Nonparametric Malmquist Measures. GATT Research Paper, 94(10), 1-32.
- Mat Nasir, S., & Ghazali, M. M. (2007). Agriculture and agribusiness in Malaysia: Performance and strategies for growth. Universiti Putra Malaysia Press, 28-54.
- Mahfoor, H., Mat Nasir, S., & Ismail, A. L. (2007). Agriculture and agro-based industrial challenges in Malaysia. Universiti Putra Malaysia Press, 55-69.
- Martin, S. (1997). Interregional comparison of agricultural productivity growth, technical process and efficiency change in China’s agriculture: A non-parametric index approach. International Institute for Applied System Analysis, 1-27.
- Muzafar, S. H. (2006). Engine growth in the states of Malaysia: Has the role of agriculture sector diminished? Universiti Putra Malaysia Press, 90-103.
- Yodfiatfinda, Mat Nasir, S., Zainalabidin, M., Md Arif, H., Zulkornain, Y., & Alias R. (2012). The empirical evaluation of productivity growth and efficiency of LSEs in the Malaysian food processing industry. International Food Research Journal, 19(1), 287-295.
- Yusof, M. S., Alias, R., & Amin, M. A. (2006). The role of the agricultural sector in the Malaysian economy. Universiti Putra Malaysia Press, 1-27.