Research Article: 2018 Vol: 21 Issue: 3
Special Consumption Tax: Its Evolution and Impact on the Financial Statements of the Automotive Sector
Irene Buele Nugra, Universidad Politécnica Salesiana
Jesica Marca Fajardo, Universidad Politécnica Salesiana
Fabián Cuesta Astudillo, Universidad Politécnica Salesiana
Abstract
Throughout history, governments have imposed taxes to sustain public spending. The special consumption tax (SCT), known as ICE (for its acronym in Spanish) in Ecuador, imposes taxes on national or imported goods and services that are not considered to be basic or essential. This paper presents the evolution of the SCT in Ecuador during the 1993-2016 period, its contribution to the General State Budget between 2001 and 2016 and its impact on the automotive sector between 2000 and 2016. The study includes a quantitative analysis of the tax legislation, statistics of tax collection and financial statements. The results indicate changes in the tax base, an increase in rates over the years; during the study period there were 30 changes in the SCT, 7 changes were made to the law, 6 to the tax base, 5 to exemptions and 12 to the products which are imposed with the SCT. The collection of this tax increased by 3.4 times during the years studied, despite the variations in the national economy. Sales decreased by 4.1% in the automotive sector, despite a decrease in sales, profits have not been greatly affected, which shows an average increase of 23% over time. The paper determines that the modifications to the internal taxation regime law had good results in the collection of the SCT. The collection went according to planned and in some cases it surpassed the goal. However, despite these results, there is a low contribution of earnings for the total General budget. It is necessary to point out that the SCT in 2016 represented a participation of 0.82% of the GDP (97,802 million USD). In contrast, Value-added tax (VAT) represented 5%, income tax 3.2% and oil incomes 2.2%. It means that the general Budget has been financed mainly by other budget headings. The SCT was created to restrict the excessive consumption of harmful products. The acquisition of these goods has not been reduced despite the considerable increase of taxes. For example, the consumption of cigarettes has not been affected despite suffering several changes in its rates; the collection from this good has increased with time. Moreover, nowadays the consumption of luxury goods presents continuous growth despite their high acquisition prices due to its high rates which go from 5% to 300%. The collection of luxury goods went from 6.4 million USD in 2000 to 75.16 million in 2016 presenting an increase of 1071%. In conclusion, this tax has not fulfilled its goal and has become a tax with collection purposes since the consumption of these goods remain constant.
Keywords
Special Consumption Tax, Automotive Sector, Financial Statements, Evolution of Taxes, Tax Collection.
Introduction
Taxes play an important role in a country’s economic development; their aim is to promote wellbeing in society through several actions which are taken by governments.
Muñoz (2014) states that taxes:
“Are the duties that generate the most revenue for public administrations (state, autonomous and local)? Therefore, they have gradually displaced other state revenue and has become the main source of money for public spending, which contributes to economic development and stability, thus improving the economy” (Muñoz, 2014).
Taxes are part of the tax systems implemented in all regions of the world. There are different types of taxes worldwide, such as: a) personal and real; b) objective and subjective; c) direct: d) periodic and immediate; e) State: personal income tax (IRPF for its acronym in Spanish), income tax of non-residents (IRNR for its acronym in Spanish), corporate tax, wealth tax, value added tax, tax on insurance premiums, special taxes; f) Autonomic; g) local and municipal (Muñoz, 2014).
Governments have created a type of tax which imposes taxes on special consumption; according to Ramón (2015), this levy accumulates a series of taxes that are then imposed on the consumption of certain goods, which are regulated by a specific law and which are justified by the special costs that the consumption of these goods create for society. In the words of Moscó (2013) these are "taxes of an indirect nature that befall on specific consumption and impose a tax in a single phase, manufacturing, importation and wherever appropriate, the introduction of certain goods into the domestic territory”. Mendoza & Chavely (2009) defines it as a "tax of an indirect nature that affects certain goods and services considered harmful to health in a specific manner and with varying rates". In Ecuador, this tax is known as Impuesto a los Consumos Especiales (1993) or ICE (Special Consumption Tax) and is applied "to national or imported goods and services" (LORTI, 2016).
The tax on special consumption in the European Union is known as Special Tax, it was established on December 28, 1992 by Law 38 (BOE, 2017), which imposes taxes on products such as alcoholic beverages and beers, tobacco, wine and fermented beverages. In Latin American countries like Mexico, it is known as IEPS or Special Tax on Production and Services, which came into effect in 1980 and whose purpose is to tax the sale and importation of alcoholic beverages and beers, tobacco, gasoline and diesel, energy drinks, drinks with added sugars, among others; its rate varies from 3% to 160%. In Bolivia, the special consumption tax was created along with the new tax reform implemented by Law 843 of May 20, 1986 and its rate ranges from 10% to 50%.
In Ecuador, this type of tax first appeared in 1981 as the Tax on Selective Consumption (Mendoza & Chavely, 2009) and was then replaced by the special consumption tax by Law 56 of the Internal Taxation Regime established in the Official Registry Number 351 on December 22nd, 1989 (Internal Revenue Service). In the late 1980’s, the government of President Borja put forward a tax reform in order to reduce taxes and focus on only three: Income tax, value added tax and the special consumption tax. The aim was to finally settle the partial and inconsistent changes of the system due to adjustments made in the time of military dictatorship, as well as ensure income for the state and its expenditure forecasts (Paez & Miño, 2015). Since the implementation of this levy, the rate of the special consumption tax has varied from 5% to 300% from 1993 to 2016.
The aim of this paper is to learn about the evolution of the special consumption tax between 1993 and 2016 in the face of the application of fiscal-tributary policies, which is basically about the General State Budget and its components such as public expenditure and its funding sources like taxes (Poveda, Pico & Alcivar, 2016) which the Ecuadorian government has introduced in different periods seeking stability and the development of the country’s productive sectors. In 2016, according to the IRS (2016), the special consumption tax was the fourth most important tax which contributed to the total tax collection of the country despite being an indirect tax; therefore this levy has undergone changes in its regulation in order to improve its application and contribution to the country’s fiscal budget. Additionally, the paper presents the evolution of the SCT after several tax reforms, its contribution to the General State Budget and its impact on the financial statements of the automotive sector.
Methodology
This research has been conducted considering four perspectives within a qualitative and quantitative analysis:
? A bibliographical research on the evolution of the special consumption tax in Ecuador was conducted by using the Official Records from the Internal Taxation Regime Law from 1993 to 2016. These records contained information which was used to analyse changes in the norms and then used to create matrices and comparative graphs.
? Based on information obtained from the internal revenue service website and data from the Ministry of Finance, a comparison of the tax collection and the general state budget was conducted in order to carry out a quantitative analysis with respect to the amounts of tax collection obtained from 2001 to 2016, comparative graphs were designed to learn the impact caused on the collection of the special consumption tax before the changes of the Internal Taxation Regime.
? The Financial statements of the automotive sector in the province of Azuay, which were obtained from the Superintendence of Companies website, were also analysed. A quantitative approach was used to analyse the financial statements. The population or universe of this study is made up by the financial statements of limited liability companies of the automotive sector in Azuay from 2000 to 2016 whose activity is selling cars; the population is 51 financial statements. The sample was calculated by considering a confidence level of 95% and an acceptable error of 5%. Hence, the sample size was 46 financial statements.
Once the sample size was obtained, the level of sales in the automotive sector was compared to the tax legislation in order to design comparative graphs.
? Finally, hypotheses were tested using the trend line with polynomial adjustment of Microsoft Excel, together with the correlation statistics function=COEF.DE.CORREL (variable 1, variable 2), where the comparative graphs were prepared.
Results
The results are presented in four sections: a) evolution of the special consumption tax (SCT) from 1993 to 2016, b) the impact of the special consumption tax on tax collection and the General State Budget from 2001-2016, c) the impact of the special consumption tax on the financial statements of the automotive sector in the province from 2000 to 2016, and d) verification of hypothesis.
The Evolution of the SCT
To analyse the evolution of the SCT, there was a thorough revision of the reforms on the Internal Regime Taxation Law from 1993 to 2016; during this period there were 30 changes in the SCT, 7 changes were made to the law, 6 to the tax base, 5 to exemptions and 12 to the products which are imposed with the SCT.
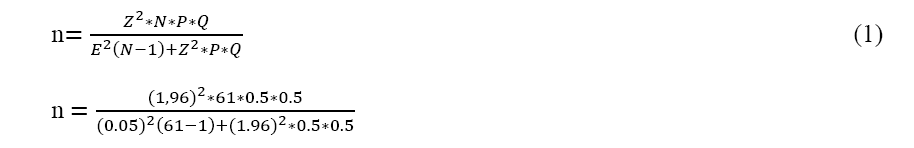
Figure 1 shows how the numbers of products which are levied with the SCT have increased during the period under analysis. Between 1993 and 2007 there was an increase of 18.3% in the number of the products levied with the SCT. However, in 2008 that number increased by 320% and 2009 they decreased by 20%, this remained the same for the next 2 years. In 2016, Ecuadorians paid the SCT for 30 products, 329% more than in 2007.
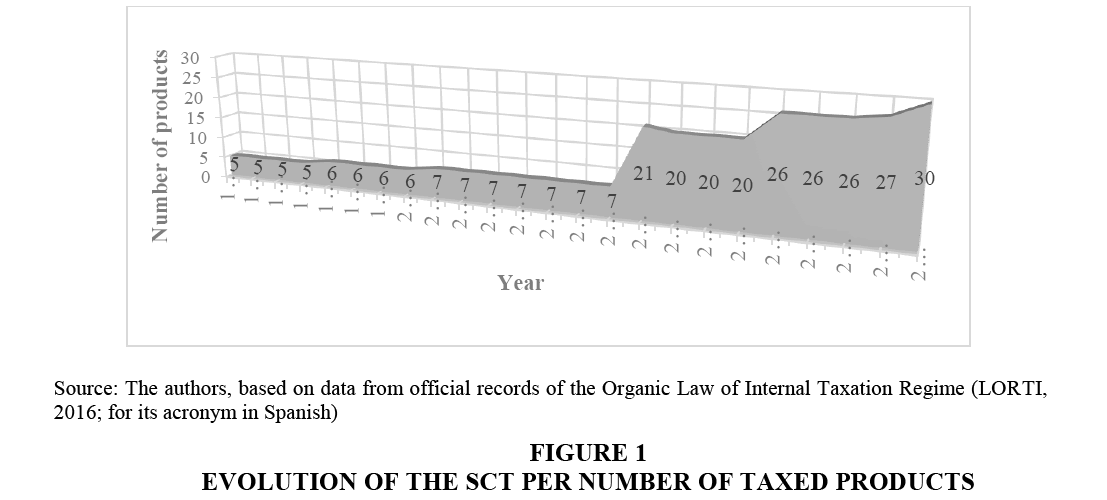
Figure 1: Evolution of the SCT Per Number of Taxed Products
On the other hand, the products that were constant between 1993 and 2016, despite having changes in their tax rates were cigarettes, beer, carbonated beverages, alcohol and alcoholic products; these products greatly contributed to the government’s tax collection in 2016 since they represented a monetary value of 2.101 million USD; 2.045 USD; 659 million USD and 405 million USD, respectively.
When analysing the tax reforms related to the SCT, there were changes in the following aspects:
Aim of the SCT
The reforms implemented to the SCT in the Internal Taxation Regime Law have not had the sole purpose of collecting taxes, the goal is also to reduce the "consumption of products or services that are considered luxurious or harmful to society and the State" (Amador & Arroba, 2017) and try to change the behaviour of the Ecuadorian consumer. Table 1 shows the changes to the SCT.
| Table 1 Changes to the Applicable Law |
||
| Year | Object | Years of Application |
| May 28, 1993 | Applied to national or imported cigarettes, beers, soft drinks, sparkling water, purified water, alcohol and alcoholic drinks. | 3 |
| December 30, 1996 | Luxury Goods were included this year (Vehicles, planes, small planes, etc., glassware and porcelain, perfumes and cosmetics, house hold and office furniture, Works of art, jewellery and gems) national or imported. | 1 |
| July 31, 1997 |
Elimination of sparkling water, purified water and other luxury goods such as glassware and porcelain perfumes and cosmetics, house hold and office furniture, Works of art, jewellery and gems) national or imported. | 4 |
| August 15, 2001 | Addition of telecommunications and radio-electronic services. | 6 |
| December 29 2007 | Elimination of telecommunication services and the addition of perfumes, videogames, weapons, light bulbs, pay television, casinos, gambling, memberships and Clubs. | 4 |
| November 24, 2011 | Addition of hybrid-electric vehicles. | 3 |
| December 29, 2014 | Addition of stoves, boilers and heating systems. | 2 |
| April 29, 2016 | Fixed and mobile telephony services, energy drinks, non-alcoholic drinks. | In force |
Source: Prepared by the author based on Official records from the Organic Law of Internal Taxation Regime 1993-2016
According to the Official Registry Supplement 986 up to 2017 the following products were in force: cigarettes, beer, carbonated drinks, alcohol and alcoholic products, motorized vehicles whose selling price range from 20,000 USD to 70,000 USD and greater than 70,000 USD, hybrid or electric vehicles whose selling price range from 35,000 USD to 70,000 USD and up to 7,000 USD, telephony, energy drinks, non-alcoholic drinks, airplanes, etc., firearms, quotas, memberships, clubs, perfumes, toilet waters, casinos-gambling, incandescent lights, videogames, paid television service, stoves and water heaters.
Rates
According to the Commission of Economic Regime of the National Assembly, “it is important to implement laws that improve people’s health in Ecuador” (Andes, 2016), therefore Ecuador has constantly changed the tax rates in order to improve the population’s standard of living. The result of the analysis of the SCT demonstrates constant growth.
Table 2 represents the evolution of products with SCT from 1993 to 2000. Cigarettes represented a high tax percentage in 1993, regardless of the type of tobacco; 1996 was the year this product was taxed with the lowest rate. It is worth mentioning that in 1994 and 1995 no rate was applied for cigarettes made with blonde tobacco. On the other hand, mineral waters disappeared in 1997, but new products were incorporated, such as vehicles, airplanes, etc., which are considered luxury goods.
| Table 2 Evolution of the SCT Rates from 1993-2000 |
|||||||||
| SCT | 1993 | 1994 | 1995 | 1996 | 1997 | 1998 | 1999 | 2000 | |
| Cigarettes | Tabaco Rubio | 230% | 0% | 0% | 67% | 89% | 77.25% | 77.25% | 77.25% |
| Tabaco Negro | 37% | 100% | 100% | 15% | 33% | 18.54% | 18.54% | 18.54% | |
| Beer | 85% | 30% | 30% | 33% | 43% | 30% | 30.90% | 30.90% | |
| 30% | 30.90% | ||||||||
| Soft drinks | 20% | 12% | 12% | 15% | 15% | 10% | 10.30% | 10.30% | |
| 10% | 10.30% | ||||||||
| Purified and sparkling water | 5% | 5% | 5% | 8% | 8% | N/A | N/A | N/A | |
| Alcohol and alcoholic drinks | 100% | 20% | 20% | 23% | 63% | 26% | 26.78% | 26.78% | |
| 26% | 26.78% | ||||||||
| Motorized Vehicles. Inland Transport <=3.5 | N/A | N/A | N/A | N/A | 10% | 5% | 5.15% | 5.15% | |
| 5% | 5.15% | ||||||||
| Planes, helicopters, jet skis, etc. | N/A | N/A | N/A | N/A | 10% | 10% | 10.30% | 10.30% | |
| 10.30% | |||||||||
Source: Prepared by the author based on Official records from the Organic Law of Internal Taxation Regime
Table 2 shows that during the decade of 2001-2010 the products that were implemented in 1993 were still in force, except for mineral water. It is also worth noting that the rate levied on telecommunications was only in force from 2001-2008. New items were added in 2008, the rate levied on cigarettes was unified and the SCT for vehicles was imposed according to its price range.
Between 2001 and 2010, firearms had the highest tax rate with 300% and 5% was applied to motorized vehicles of $20,000 and pickup trucks of $30,000?
Products imposed with the SCT were levied through an ad-Valorem tax, but for 2012 a specific rate was included for cigarettes, alcohol and alcoholic products and 2016 it was also applied to beer. In the case of carbonated drinks and non-alcoholic beverages only the specific rate was applied per unit.
Tables 2-4 demonstrate that the products that have undergone the most changes in rates between 1993 and 2016 were cigarettes, alcohol and alcoholic products, which have had 10 alterations equal to 42% of changes during the years under study. The products with the least modifications were airplanes which had only 1 change, equal to 4%.
| Table 3 Evolution of the SCT Rates from 2001-2010 |
|||||||||||
| SCT | 2001 | 2002 | 2003 | 2004 | 2005 | 2006 | 2007 | 2008 | 2009 | 2010 | |
| Cigarettes | Blond | 77.25% | 77.25% | 77.25% | 98% | 98% | 98% | 98% | 150% | 150% | 150% |
| Dark | 18.54% | 18.54% | 18.54% | 18.54% | 18.54% | 18.54% | 18.54% | ||||
| Beer | 30.90% | 30.90% | 30.90% | 30.90% | 30.90% | 30.90% | 30.90% | 30% | 30% | 30% | |
| Soft drinks | 10.30% | 10.30% | 10.30% | 10.30% | 10.30% | 10.30% | 10.30% | 10% | 10% | 10% | |
| Alcohol and alcoholic drinks | 26.78% | 26.78% | 26.78% | 32% | 32% | 32% | 32% | 40% | 40% | 40% | |
| Motorized Vehicles. Inland Transport <=3.5 | 5.15% | 5.15% | 5.15% | 5.15% | 5.15% | 5.15% | 5.15% | N/A | N/A | N/A | |
| Motorized Vehicles. Price up to 20.000 USD | N/A | N/A | N/A | N/A | N/A | N/A | N/A | 5% | 5% | 5% | |
| Pick-ups and vans up to 30.000 USD | N/A | N/A | N/A | N/A | N/A | N/A | N/A | 5% | 5% | 5% | |
| Motorized Vehicles. Price up to 40.000 USD | N/A | N/A | N/A | N/A | N/A | N/A | N/A | 35% | N/A | N/A | |
| N/A | |||||||||||
| Motorized Vehicles except pick-ups and vans between 20.000 and 30.000 | N/A | N/A | N/A | N/A | N/A | N/A | N/A | 15% | 10% | 10% | |
| 10% | |||||||||||
| Motorized Vehicles between 30.000 and 40.000 | N/A | N/A | N/A | N/A | N/A | N/A | N/A | 25% | 15% | 15% | |
| 15% | |||||||||||
| Motorized Vehicles between USD 40.000 and USD 50.000 | N/A | N/A | N/A | N/A | N/A | N/A | N/A | 20% | 20% | 20% | |
| Motorized Vehicles between USD 50.000 and USD 60.000 | N/A | N/A | N/A | N/A | N/A | N/A | N/A | 25% | 25% | 25% | |
| Motorized Vehicles between USD 60.000 and USD 70.000 | N/A | N/A | N/A | N/A | N/A | N/A | N/A | 30% | 30% | 30% | |
| Motorized Vehicles. Price up to USD 70.000 | N/A | N/A | N/A | N/A | N/A | N/A | N/A | 35% | 35% | 35% | |
| Telecommunications | 15% | 15% | 15% | 15% | 15% | 15% | 15% | N/A | N/A | N/A | |
| Planes, etc. | 10.30% | 10.30% | 10.30% | 10.30% | 10.30% | 10.30% | 10.30% | 15% | 15% | 15% | |
| Weapons | N/A | N/A | N/A | N/A | N/A | N/A | N/A | 300% | 300% | 300% | |
| Membership, Clubs | N/A | N/A | N/A | N/A | N/A | N/A | N/A | 35% | 35% | 35% | |
| Perfumes | N/A | N/A | N/A | N/A | N/A | N/A | N/A | 20% | 20% | 20% | |
| Casino | N/A | N/A | N/A | N/A | N/A | N/A | N/A | 35% | 35% | 35% | |
| Light Bulbs | N/A | N/A | N/A | N/A | N/A | N/A | N/A | 100% | 100% | 100% | |
| Videogames | N/A | N/A | N/A | N/A | N/A | N/A | N/A | 35% | 35% | 35% | |
| Pay television services | N/A | N/A | N/A | N/A | N/A | N/A | N/A | 15% | 15% | 15% | |
Source: Prepared by the author based on Official records from the Organic Law of Internal Taxation Regime
| Table 4 Evolution of the SCT Rates from 2011-Present |
|||||||
| SCT | 2011 | 2012 | 2013 | 2014 | 2015 | 2016 | 2017 |
| Cigarettes | 150% | Cigarettes 0.08 USD/unit, Tobacco 150% | Cigarettes 0.08 USD/unit, Tobacco 150% | 0.08 USD/unit, Tobacco 150% | Cigarettes 0.1310 USD/unit, 150% Tobacco | Cigarettes 0.16 USD/unit, Tobacco 150% | Cigarettes 0.16 USD/unit, Tobacco 150% |
| Beer | 30% | 30% | 30% | 30% | 30% | Industrial Beer 12 USD/L of pure alcohol 75% | Industrial Beer 12 USD/L of pure alcohol 75% |
| Soft drinks | 10% | 10% | 10% | 10% | 10% | With sugar content less than or equal to 25 g/L | With sugar content less than or equal to 25 g/L |
| Alcohol and alcoholic drinks | 40% | 6.20 USD/L, including craft beer, pure alcohol 75% | 6.20 USD/L, including craft beer, pure alcohol 75% | 6.20 USD/L, including craft beer, pure alcohol 75% | 6.20 USD/L, including craft beer, pure alcohol 75% | 6.20 USD/L, including craft beer, pure alcohol 75% | 6.20 USD/L, including craft beer, pure alcohol 75% |
| Motorized Vehicles. Price up to 20.000 USD | 5% | 5% | 5% | 5% | 5% | 5% | 5% |
| Pick-ups and vans up to 30.000 USD | 5% | 5% | 5% | 5% | 5% | 5% | 5% |
| Motorized Vehicles except pick-ups and vans between 20.000 and 30.000 | 10% | 10% | 10% | 10% | 10% | 10% | 10% |
| Motorized Vehicles between 30.000 and 40.000 | 15% | 15% | 15% | 15% | 15% | 15% | 15% |
| Motorized Vehicles between USD 40.000 and USD 50.000 | 20% | 20% | 20% | 20% | 20% | 20% | 20% |
| Motorized Vehicles between USD 50.000 and USD 60.000 | 25% | 25% | 25% | 25% | 25% | 25% | 25% |
| Motorized Vehicles between USD 60.000 and USD 70.000 | 30% | 30% | 30% | 30% | 30% | 30% | 30% |
| Motorized Vehicles. Price up to USD 70.000 | 35% | 35% | 35% | 35% | 35% | 35% | 35% |
| Hybrids or electric vehicles Price up to USD 35.000 | N/A | 0% | 0% | 0% | 0% | 0% | 0% |
| Hybrids or electric vehicles Price between USD 35.000 and USD 40.000 | N/A | 8% | 8% | 8% | 8% | 8% | 8% |
| Hybrids or electric vehicles Price between USD 40.000 and USD 50.000 | N/A | 14% | 14% | 14% | 14% | 14% | 14% |
| Hybrids or electric vehicles Price between USD 50.000 and USD 60.000 | N/A | 20% | 20% | 20% | 20% | 20% | 20% |
| Hybrids or electric vehicles Price between USD 60.000 and USD 70.000 | N/A | 26% | 26% | 26% | 26% | 26% | 26% |
| Hybrids or electric vehicles Price to USD 70.000 | N/A | 32% | 32% | 32% | 32% | 32% | 32% |
| Telephony | N/A | N/A | N/A | N/A | N/A | 15% | 15% |
| Energy drinks | N/A | N/A | N/A | N/A | N/A | 10% | 10% |
| Non-alcoholic drinks | N/A | N/A | N/A | N/A | N/A | 0.18 USD/100 g of drink | 0.18 USD/ 100 g of drink |
| Planes, etc. | 15% | 15% | 15% | 15% | 15% | 15% | 15% |
| Weapons | 30% | 30% | 30% | 30% | 30% | 30% | 30% |
| Membership, Clubs | 35% | 35% | 35% | 35% | 35% | 35% | 35% |
| Perfumes | 20% | 20% | 20% | 20% | 20% | 20% | 20% |
| Casino | 35% | 35% | 35% | 35% | 35% | 35% | 35% |
| Light bulbs | 100% | 100% | 100% | 100% | 100% | 100% | 100% |
| Videogames | 35% | 35% | 35% | 35% | 35% | 35% | 35% |
| Pay television | 15% | 15% | 15% | 15% | 15% | 15% | 15% |
| Stoves, heating systems | N/A | N/A | N/A | N/A | 100% | 100% | 100% |
Source: Prepared by the author based on Official records from the Organic Law of Internal Taxation Regime
The implementation of the SCT for stoves and gas water heaters in 2015, by means of the reform of Law Number 0 published in Official Registry Supplement 405 on December 29th, 2014, helped strengthen the application of the Incentives for Production and Prevention of Tax Fraud Law, which stated a SCT of 100% on gas stoves and water heaters to discourage people from buying these products and encourage a change in the country’s production model (Economía, 2014).
Additionally, in 2016 the implementation of 15% of the SCT to fixed and mobile telephony service for companies, through the Official Registry Supplement 744 of April 29 2016, was proposed by the Organic Law for the Balance of Public Finances. The reform also included an increase in the SCT on cigarettes, beer and other products.
The Impact of the SCT on Tax Collection and the General State Budget
This section presents the impact the fiscal-tax policies caused on the general state budget. The collection of the SCT in Ecuador increased 340% between 2001 and 2006, as shown in Figure 2. It grew from 181 million to 798 million due to an increase in tax rates and the addition of new products. The national products imposed with the SCT, which provided the highest collection from 2001 to 2006, were cigarettes, beers, telecommunications and vehicles, with 2.101 million USD, 2.045 million USD and 695 million USD, respectively. The SCT on telecommunications and bottled water were eliminated. The last items included in 2016 were fixed telephony with a rate of 15% which meant an income of 23.5 million USD, energy drinks1.6 million USD and non-alcoholic drinks 7.5 million USD.
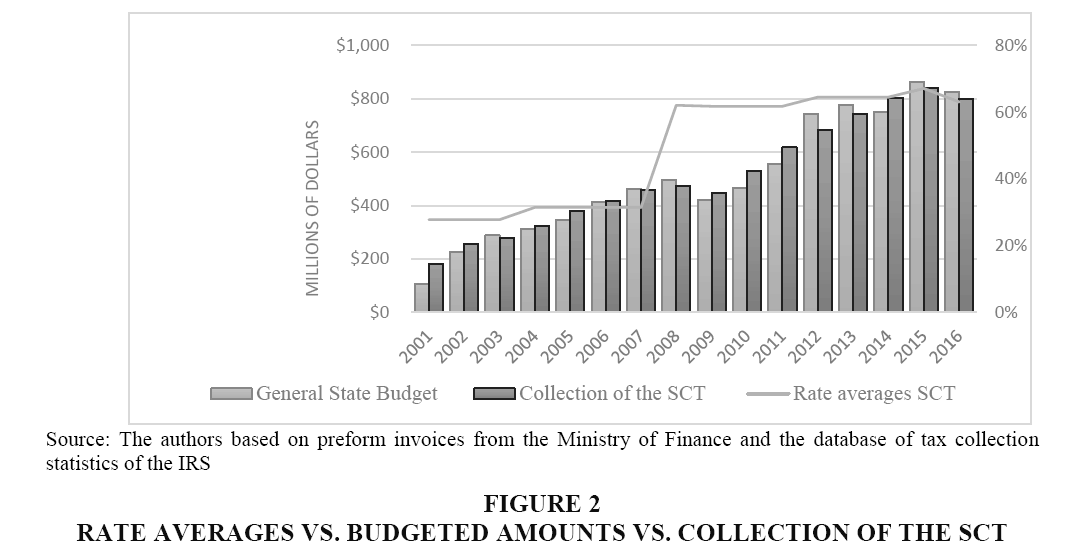
Figure 2: Rate averages vs. Budgeted amounts vs. Collection of the SCT
For almost a decade, between 2001 and 2010, tax collection remained in constant growth, going from 181 million USD to 530 million USD in 2010, which represented an increase of 192%. Despite this growth, in 2009 the collection dropped to 448, 1 million, equivalent to -5% compared to the previous year. The average rate of the products that were taxed at that time went from 31% in 2007 to 62% in 2008 due to the addition of new items, but this did not stop the general state budget and the tax collection from increasing since the Ecuadorian economy was stable, local oil prices had been experiencing a rise until June 2008 when it reached a historical peak of 117.4 USD/barrel on average.
“In 2009, the external environment was not very promising because of the international crisis caused by the instability of the United States financial market, which had worldwide consequences and direct effects on Latin American economies such as Ecuador” (José, 2012).
As a result, in 2009 there was a reduction of 16% in the general state budget and a 5% decrease in tax collection. The main effects of the economic crisis were: a decrease in the number of oil and non-oil exports as well as a fall in remittances. However, in 2010 economic activities began to recover and there was an increase of 18% in the special consumption tax collection, which had a continuous growth up to 2015.
Tax collection in 2016 compared to the previous year fell 41.31 million USD due to a fall in oil prices, appreciation of the dollar, the earthquake on April 16, difficulties in the exports sector because of the legal contingents which affected the performance of economic activity, there was also a decrease of -1, 5% of the Gross Domestic Product (GDP) according to a report published by the Ecuadorian Central Bank (2016). Also in 2016, the rate of products decreased compared to previous years to 63%, despite having included new products such as energy drinks, non-alcoholic drinks, fixed telephony, stoves and gas water heaters, there was also the implementation of the payment of a specific rate for cigarettes, beer and other products that charge the SCT.
The General State Budget and tax collection in Ecuador has had an increasing trend as shown in Figure 3. Between 2001 and 2017, the collection of the SCT provided 4.4% of the average income for the total budget and 9.8% for tax revenue. However, between 2001 and 2016 it started to fall, it went from 4% to 2% regarding the general state budget and from 8% to 6% regarding the total collection of taxes.
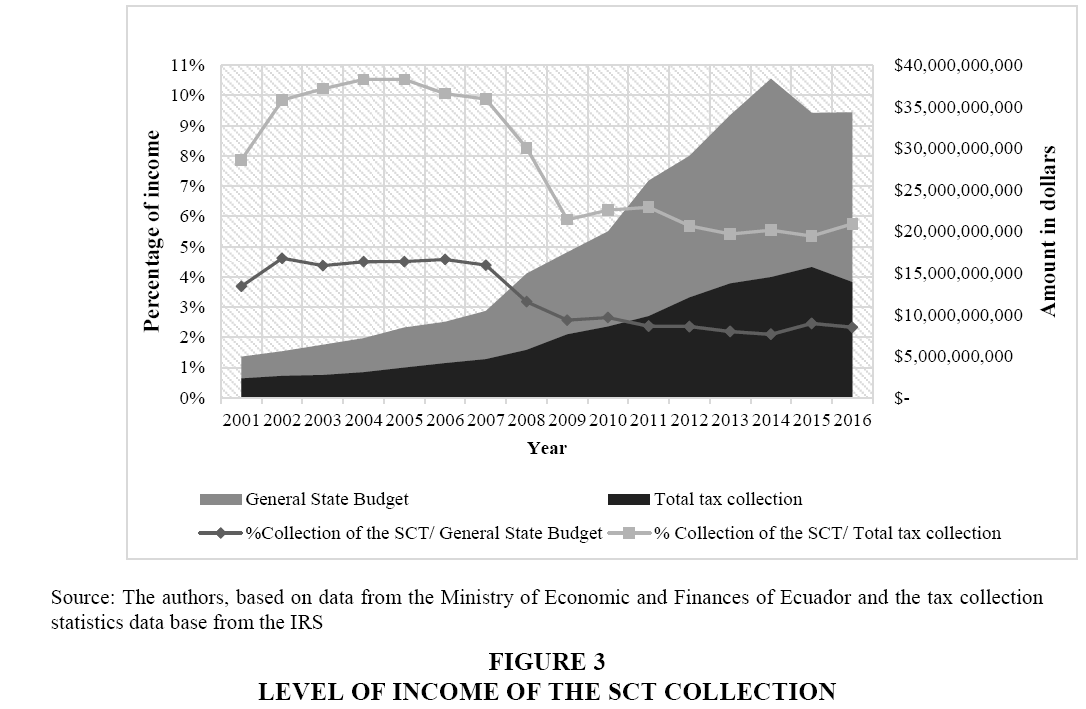
Figure 3: Level of Income of the SCT Collection
Between 2008 and 2016 the collection of the SCT was higher than previous years, as shown in Figure 2, but this does not mean that in terms of revenue contribution for the total general state budget and tax revenue was better, since it only represented 2.5% and 6% of average income, respectively. Despite there being more taxes by the end of 2007 and including even more in the following years, it was not possible to obtain the same level of income as in previous years. Therefore, since 2008 the participation of the SCT in the budget has decreased continuously by 2 percentage points compared to the previous period (2001-2007).
The Impact of the SCT on the Financial Statements of the Automotive Sector
This section discusses the evolution of the SCT rates on vehicles as well as the impact they have caused on sales and profits in the automotive sector.
The first tax rate on vehicles appeared in 1997 and was established by the Tax Regime Law on the automotive sector (Figure 4). It levied vehicles greater than 3.5 tons without specifying any price range; it did not have any major changes until the reforms established by the official registry supplement 242 on December 29th, 2007, which stated that all commercialization of national or imported vehicles pay this tax through established price ranges which go from 20,000 USD up to 70,000 USD.
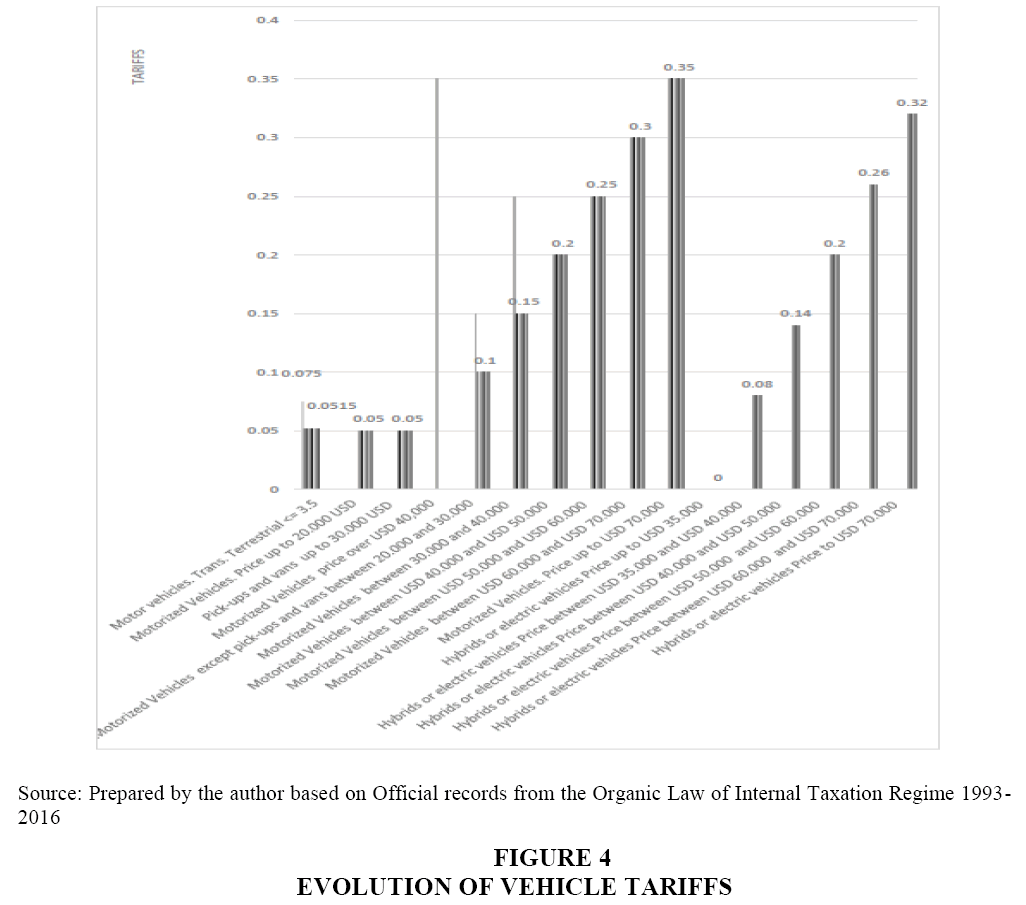
Figure 4: Evolution of Vehicle Tariffs
A new tax on vehicular pollution was created in November 2011; the environmental policy was used as a fiscal instrument under the premise that those who pollute the most, should pay the most (Peña, 2012), this led to a rate for hybrid vehicles. This tax is still in force today.
Figure 5 shows that between 2000 and 2016 the level of sales in this sector increased 30%, an average growth of 1.5 million USD. In 2002 and 2003 sales dropped by 11% and 10%, respectively.
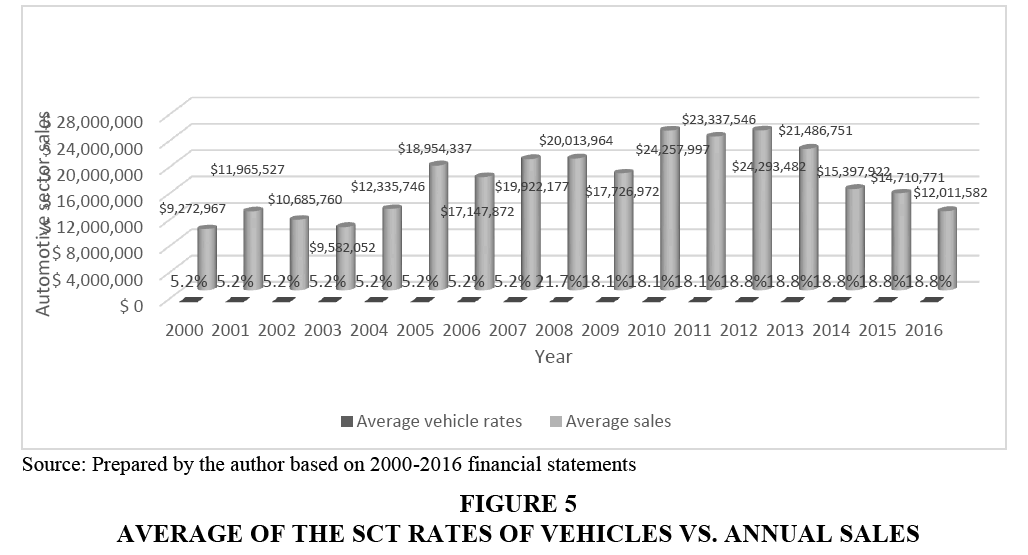
Figure 5: Average of the SCT rates of vehicles vs. Annual sales
In 2011, there was a 4% fall in sales due to government restrictions, such as an increase in the SCT for vehicles, restrictions on imports, green tax and others (Uribe, 2014). Sales in the automotive sector were affected by these taxes, for instance in 2014 sales decreased 27% compared to 2013. In 2015 sales fell 687,150 dollars; in that same year “they implemented a restriction on imports by establishing quotas for the import of vehicles and parts” (Uribe, 2014), which caused a fall in the number of imported vehicles. This in turn affected 2016 when there was an 18% decrease in sales, during this period there was also an economic recession which caused a downturn in the GDP (-1.5%).
As a result, the price of cars increased because of the tariffs on vehicles which range from 35% to 40%, a 5% tax on the currency leaving the country, a special consumption tax from 5 to 35%, a VAT of 14% which took force in 2016. All this implied a tax burden according to the cost of the vehicle and its characteristics (Pico, 2017).
The increase of tariffs and taxes since 2009 which were explained in the previous paragraph and the “establishment of quotas on the import of finished vehicles and parts for the assembly of vehicles (CKD)” (Uribe, 2014) in 2015, caused a decrease in the supply of vehicles and in terms of the demand consumers preferred not to make this type of investment because of people’s expectations on their economic and work situation provided constitutional, tax and legal changes (Jaramillo, 2016). As a result, between 2008 and 2016, with the addition of new rates for the SCT according to the price of the vehicle, sales decreased by 40% (8 million USD).
According to the analysed data, between 2000 and 2016 the level of profitability in the automotive sector went from 3.2 million to 21.6 million, an increase of 766% (Figure 6). The highest increase in profits occurred in 2007 when there was an average SCT rate of 5.15%, an increase of 13,681 million USD equal to 194% compared to the previous year.
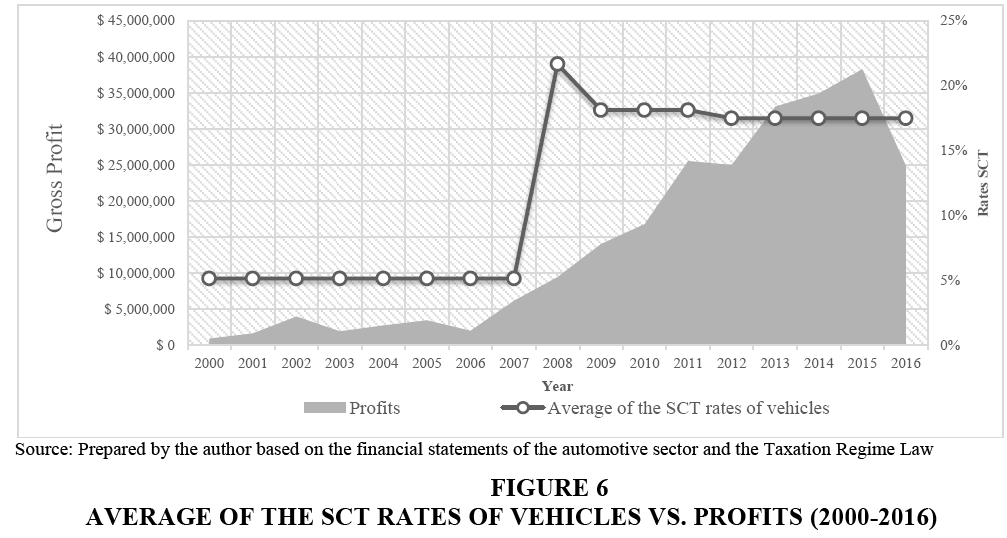
Figure 6: Average of the SCT rates of vehicles vs. Profits (2000-2016)
It should be noted that in 2016 company profits suffered a 40% decrease, the biggest decline recorded of the years under study, which was caused due to an increase in tariffs, quotas on imports, the SCT, the increase in the VAT because of the earthquake of April 16 that year, among other factors, which affected the performance of the economic activity.
Verification of Hypotheses
Here are the hypotheses which were verified with this research:
H1 The level of the SCT collection in the IRS increased as the number of products imposed with this tax also increased.
There is a positive association between the number of products and the collection of the SCT, based on a correlation analysis with 0.91 acceptances, thus this verifies the hypothesis that the collection of the SCT increases as the number of products increase (Figure 7).
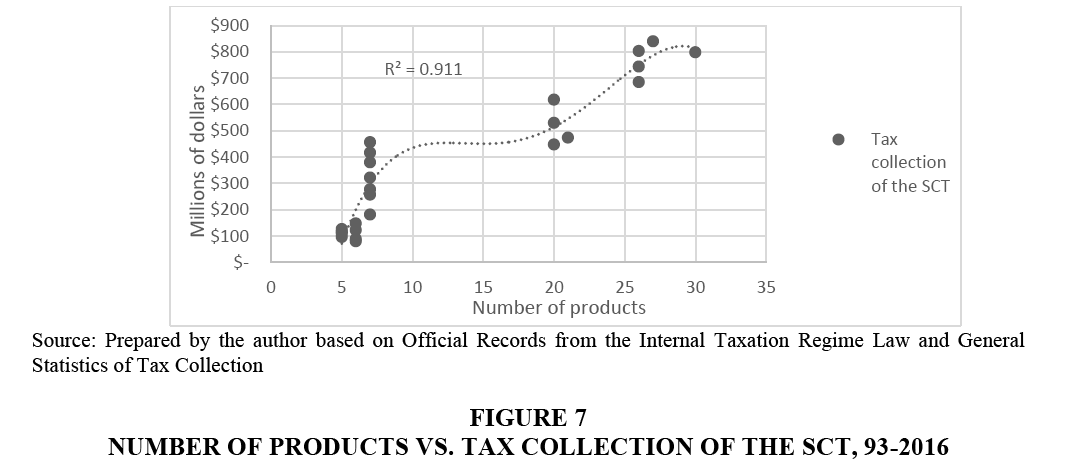
Figure 7: Number of products vs. Tax collection of the SCT, 93-2016
H2 The increase in the rates of the SCT on harmful products and luxury goods decrease the level of collection of this tax.
The following products are considered luxury goods: vehicles, airplanes, casinos, firearms, perfume and others. Harmful products are: cigarettes, beer, carbonated drinks, etc. The aim was to verify if when introducing new taxes and increasing the rate on the SCT on products, the government managed to change people’s buying habits and reduce the consumption of these products, which are considered harmful to health and society.
When calculating a correlation coefficient of 96% and 86%, referring to products that are harmful to health and luxury goods, respectively, the third hypothesis is not accepted, since the increase of the SCT on these products have helped increase tax collection and therefore there is evidence of an increase in consumption levels (Figure 8).
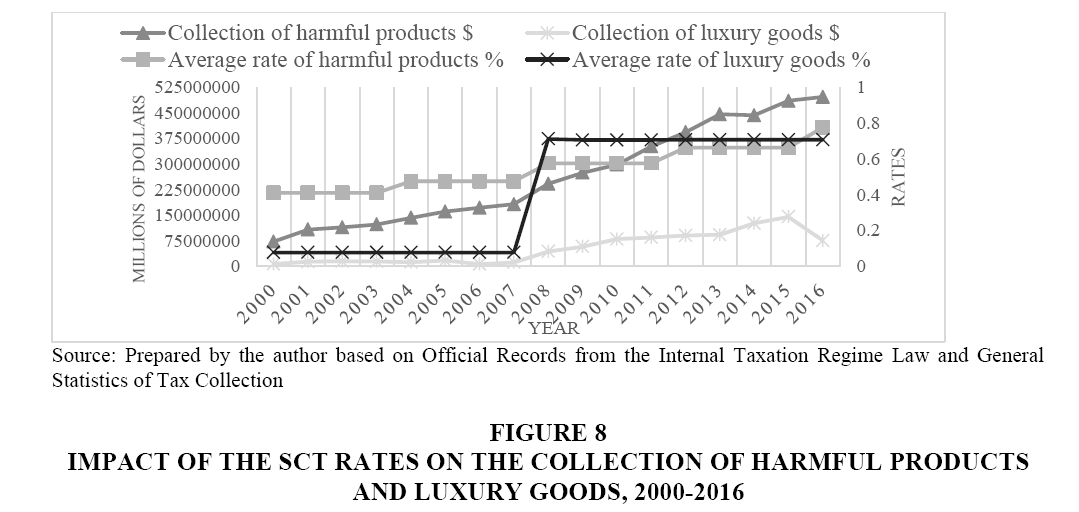
Figure 8: Impact of the SCT Rates on the Collection of Harmful Products and Luxury Goods, 2000-2016
In this regard, despite several changes on the taxes imposed on these products, their consumption has not been affected. They have rather increased constantly by 26 and 4.3 million, equal to 13.4% and 33%, respectively.
H3 The increase of the SCT on vehicles reduces the level of sales in the automotive sector.
When using the correlation coefficient between the two variables, there is a value of 0.54 which indicates a low relation, thus making this hypothesis be turned down (Figure 9). This result is due to the lack of more variables since the SCT on vehicles is not the only factor that affects sales, it is necessary to include new variables such as the ad-valorem rate, exit tax on money, the tariff and the VAT.
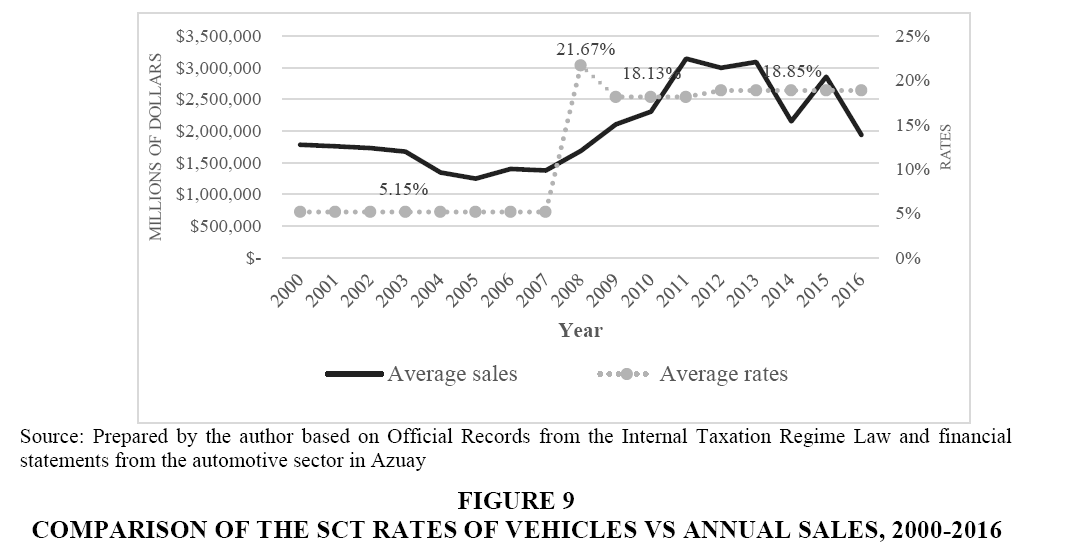
Figure 9: Comparison of the SCT Rates of Vehicles vs Annual Sales, 2000-2016
However, if we have two time periods, one between 2000 and 2007, when the rates were constant and another between 2008 and 2016, when there were changes, in the first time period sales increased from 9 to 18 million, equal to an increase of 115%. While in the second time period sales decreased from 20 to 12 million, a 40% decrease. It is worth noting that during 2000 and 2007, despite there being a few places to buy and sell vehicles, profits were better than 2008-2016. Therefore, the increase in the rates of the SCT on vehicles affected sales in this sector.
An increase in taxes imposed on vehicles, including the SCT, reduced the level of sales in the automotive sector because the price of vehicles increased and affected both sellers and consumers.
Conclusion
There have been 16 reforms to the Special Consumption Tax between 1993 and 2016. The objective of the law was extended, the tax base was restructured, new taxes were created and the tariffs increased. Moreover, taxation was changed to some products such as: cigarettes, beer, soft drinks and alcoholic drinks. Additionally, the SCT was eliminated from telecommunications and purified water. Tax legislation is changing constantly and this forces taxpayer to be updated in order to comply with the new regulations established by the law.
Between 1993 and 2016 it is possible to confirm that the increase in the number of products by 500% in 2016 compared to the number of items imposed in 1993, caused an increase in tax collection of the SCT of 534%; it went from 125,8 million USD in 1993 to 798,3 million USD in 2016. Therefore, the increase of goods imposed with the SCT has proven to be an optimal measure to increase the levels of tax collection taking into account the relationship between the increase of the number of items and the amount collected, this validates hypothesis 1. In percentage terms, the contribution of these products in tax collection fluctuates between 5% and 105% depending on the number of taxed items according to the inter annual rate of change.
The modifications to the internal taxation regime law had good results in the collection of the SCT. Figure 2 shows that the collection went according to planned and in some cases it surpassed the goal. However, despite these results, there is a low contribution of earnings for the total General budget as can be seen in Figure 3. It is necessary to point out that the SCT in 2016 represented a participation of 0.82% of the GDP (97,802 million USD). In contrast, VAT represented 5%, income tax 3.2% and oil incomes 2.2%. It means that the general Budget has been financed mainly by other budget headings.
The SCT was created to restrict the excessive consumption of harmful products; hypothesis 2 confirmed that the acquisition of these goods has not been reduced despite the considerable increase of taxes. For example, the consumption of cigarettes has not been affected despite suffering several changes in its rates; the collection from this good has increased with time. Moreover, nowadays the consumption of luxury goods presents continuous growth despite their high acquisition prices due to its high rates which go from 5% to 300%. The collection of luxury goods went from 6.4 million USD in 2000 to 75.16 million in 2016 presenting an increase of 1071%. In conclusion, this tax has not fulfilled its goal and has become a tax with collection purposes since the consumption of these goods remain constant.
In Ecuador, the automotive sector has been affected by the regulations implemented since 2008, which sought to restrict the importation of vehicles and foster domestic production and sale of national vehicles. However, according to the analysis carried out in the automotive sector, the governmental policy affected this sector by causing an increase regarding the SCT rates.
Hypothesis 3 shows that between 2008 and 2016, when there was an increase of the SCT rates for vehicles, companies had a decrease in sales because the prices of vehicles and the acquisition costs were affected; for example the price of an Audi was between $90.000 and $120.000 in 2007 when the rate was 5.15%, the price ranged from $359.000 to $435.000 in 2016 due to an increase in taxes, because rates varied from 5% to 35% according to the retail price of the vehicle. Despite a decrease in sales, profits have not been greatly affected, as can be seen in Figure 6 which shows an average increase of 23% over time. Finally, it is important to mention that this tax is not paid by public transportation vehicles such as: cabs, school buses, ambulances and others with commercial operation permission.
References
- Amador, C. & Arroba, I. (2017). The tax taxes of the imports of vehicles and their incidence on the profitability of the automotive sector. Observatory of the Latin American Economy.
- Andes. (2016). Gobierno de Ecuador propone incremento mínimo en cigarrillos, cerveza y bebidas azucaradas. Public News Agency of Ecuador and South America.
- LORTI. (2016). Ley orgánica de régimen tributario interno. Ecuador: Asamblea Nacional.
- BOE. (2017). Impuesto a los consumos especiales. Madrid: Boletín Oficial del Estado.
- Economía. (2014). ICE de 100% para cocina y calefón de gas. El Comercio.
- Jaramillo, A.J. (2016). Las expectativas como base económica. Revista Perspectiva Económica, 21(11).
- Mendoza, V. & Chavely C. (2009). Impacto en el sector automotriz y en la recaudación de servicio de rentas internas (SRI), del incremento en las tarifas del impuesto al consumo especial (ICE) a los vehículos, en la ley de equidad. Facultad de Ciencias Sociales y Humanísticas, 15, 1-9.
- José, M.F. (2012). Informe de transparencia y rendición de cuentas del 2009. Ministerio de Economía y Finanzas.
- Moscó, B. (2013). Tratado de aduanas e impuestos especiales. Barcelona.
- Muñoz, R.R. (2014). Impuesto de sociedades. Ministerio de Educación de España.
- Paez, J. & Miño, C. (2015). Historia de los impuestos en Ecuador.
- Pico, V.L. (2017). Análisis de la restricción a las importaciones del sector automotriz en el Ecuador periodo y su impacto en la economía. INNOVA Research Journal, 2(2).
- Poveda, J., Pico, A. & Alcívar, C. (2016). El impuesto a los consumos especiales y su impacto en el consumo del cigarrillo en el Ecuador. Revista Caribeña de Ciencias Sociales.
- Ramón, S. (2015). La progresividad en las reformas tributarias.
- Uribe, F. (2014). Ecuador: Sector automotriz.