Research Article: 2020 Vol: 19 Issue: 1
Strategies to Manage Regional Development Inequality for Economic Recovery during the Covid-19 Period
Zusmelia, STKIP PGRI West Sumatra
Ansofino, STKIP PGRI West Sumatra
Melinda Noer, Andalas University
Iswandi, Padang State University
Momon, Centre for Research and Development, West Sumatra
Lovelly Dwinda Dahen, STKIP PGRI West Sumatra
Nilma Desri Rosya, STKIP PGRI West Sumatra
Abstract
This study analysis the impact of regional development disparities that occurred before and during the Corona Virus Disease (Covid-19) pandemic, and its effects on strategies to improve regional economic development. The research method used is the spatial lag model (SLM), and the spatial error model (SEM). The data used is the inequality of per capita income in the province of West Sumatra, Indonesia from 2003-2019. The results showed that the convergence of per capita income in West Sumatra, Indonesia has positive spatial autocorrelation, there are two regions, namely Padang City and Agam Districts as the centre of the cluster. The districts, and cities of West Sumatra are not yet fully integrated with each other, there are seven districts, and cities which are categorized as neighbourless for all groups of economic variables, physical, and social variable groups. The group of economic variables that most significantly affect the reduction of inequality, such as the number of MSME businesses, and investment in the form of gross fixed capital formation, these seven regions have no spatial integrated with their neighbouring areas. Spatial autocorrelation in each variable used for analysis shows that autocorrelation clustering only occurs in nine districts, meaning that spatial autocorrelation has not fully occurred in districts, and cities in West Sumatra, the implication is that spatial interactions between these areas are in economic, physical development. Regional, and social, it has not happened, and has not been able to encourage the creation of agglomeration. The strategy for managing development inequality during the Covid-19 pandemic is a high priority starting with improving the health of mothers and children, increasing the transportation of people, and goods between regions, increasing the ratio of road length to area, increasing agglomeration between regions, and increasing the role and, participation of women in development to support increased life expectancy. If this can be done, it will be followed effectively by an increase in MSME business, and investment, which in turn can lead to an increase in the skills of the productive age population.
Keywords
Strategies, Regional Development, Covid-19.
Introduction
Regional disparities have been a major problem in regional development so far, affecting almost all developing countries, including Indonesia in general due to the inequality of East and West Indonesia, the inequality of Java and outside Java, and even the inequality of cities and villages. Regional disparities also occur at the provincial level in West Sumatra, Indonesia such as the inequality between coastal areas and inland areas, inequality between districts and their cities. The problem of this inequality arises, of course, because since the development process itself begins and this inequality will continue to increase or decrease, depending on the policy strategy adopted to reduce this gap. The root cause of the gap is usually due to the allocation and distribution of natural resources, human resources and even social resources that have not been properly distributed, even because of errors in the planning and development process itself. The consequences of this gap will certainly lead to conflict, weak social capital, and lead to low social welfare (Geoffrey, 2007).
The persistence of regional disparities from the perspective of economic growth among regions in the province of West Sumatra continues to receive attention in the analysis of regional development planning in this decade. Regional economic growth has been the focus of the study that has received the most attention among regional development sciences, more specifically on the phenomenon of spatial disparity (Krugman, 1991; Anselin, 1992). The mutual relationship between economic growth in terms of income growth and inequality in income as a result of regional development has been well stated in the theory of Williamson (1965) with the inverted U curve hypothesis (Xu & Lee, 2019). Disparities should be managed wisely to reduce the negative impacts that arise, so understanding and assessing regional disparities is a must in order to evaluate policies and implement development programs in the future more precisely (Edo, 2017).
The importance of the objectives of the regional disparity assessment carried out according to Edo (2017) is to improve regional connectivity between the development areas of West Sumatra Indonesia, transfer fiscal resources to greater investment for human resources and public services in disadvantaged areas, develop new growth centre (growth poles) in disadvantaged areas and reduce barriers between regional migration, so that in the end a policy design was obtained to reduce regional disparities in the development of the West Sumatra region.
Strategies to manage regional development inequality can be carried out through the creation of economic agglomeration, (Carlino, 1980; Cainelli et al., 2014; Castells-Quintana & Royuela, 2014; Kuchiki, 2019), developing linkages between regional internal superior industries (Fujita et al., 1999); (Fujita & Hamaguchi, 2012) building linkages between the food and beverage industry and tourism, (Kuchiki et al., 2017) even developing strategies to encourage exports and creating export processing zones (World Bank, 1993). According to Kuchiki (2019) the sequence of strategies for managing regional development so that development inequality through the construction of infrastructure facilities, including ports and roads, building strong economic institutions, building human resources, meeting decent living standards for the community.
Regional economic growth models among country levels have been motivated by work (Barro et al., 1991; Barro, 1991; Barro & Sala-i-Martin, 1992) which tends to show long-term disparities in regional income growth, disparities that occur, seen as there is a convergence of regional income growth with a steady state (Yandell, 1990), so that in studying regional disparities, the concept of convergence has become an important and controlled economic variable in seeing regional disparities. According to Barro & Sala-i-Martin (1992); Barro (1991) & Katsikides & Hanappi (2016) the convergence of average economic growth between two regions is to examine the relationship between the growth rate of per capita output at a time, at the initial level of per capita output. The existence of a negative correlation between the two relationships is stated as an indicator of the convergence of regional income growth. The concept of beta convergence can also be extended to other variables outside the per capita output of a regional economy, by increasing the sigma convergence (Barro et al., 1991).
Regional disparities in the development process in West Sumatra, Indonesia are inevitable; the Williamson and Theil index measures used have shown that there is a gap in per capita income in West Sumatra between the existing districts and cities. In Figure 1, the regions with the highest per capita income disparity levels are Padang City, South Pesisir District and Bukittinggi City, while Dharmasraya district and Payakumbuh City have the lowest per capita income disparity.

Figure 1 Inequality of per Capita Income Between Regencies and Cities in West Sumatra in 2019
Almost all the main cities of West Sumatra, Indonesia experience inequality in per capita income, except for Payakumbuh city, which has a low per capita income inequality. Meanwhile, the highest per capita income inequality among districts is the South Pesisir, Pasaman and West Pasaman districts. Districts that have low regional income inequality are the districts of Dharmasraya, Mentawai Islands, Agam and Lima Puluh Kota.
The Williamson index that describes economic growth and the condition of the population of a region has shown a high disparity, especially in line with the higher income per capita. This Williamson Index has succeeded in revealing that the city of Padang as a city which has a high trend of economic growth and income per capita, has also caused the inequality of per capita income among its population to increase (Williamson, 1965).
The persistence of regional disparities in the province of West Sumatra certainly needs to be reduced by finding the factors that cause this regional disparity. According to Portnov & Felsenstein, 2005) there are three indicator measures to see income disparities in a region, namely: land area, population and economic performance, in this case the availability of natural resources as a production factor and human resources with a labour force skilled. In relation to space and location and with reference to Tobler (1987) first geographic law, “everything is related to everything else but nearby things are more related than distant things”. This is the basis for the impact of economic activity at a location to be correlated (related) with economic activity in other places, but the regions closest to them, are certainly more connected to one another. The smaller the size of a region, the more dependent on exports (Ansofino et al., 2019) this makes dependence on regional external parties, which implies less freedom in formulating a local policy agenda, which in turn will lead to greater regional divergence (Geoffrey, 2007).
This study focuses on the problem of regional disparities in the West Sumatra region (Figure 2), both disparities in processes and health outcomes, education development, even disparities in processes and results of regional trade and foreign trade (Ansofino et al., 2018). In addition, this regional disparity has reduced the strength of regional economic agglomerations (Ansofino & Zusmelia, 2019), so that some local growth centre are more interested in growth centre in neighbouring regions, thereby reducing regional cohesiveness which leads to a decrease in regional per capita income. West Sumatra is compared to other external areas that are closer to one area, such as the Sumatra economic corridor. How this condition of inequality has further contributed to the regional economic crisis (Phillipson et al., 2020), during the Covid-19 pandemic, due to large-scale social restriction policies in West Sumatra, Indonesia, especially in areas that have experienced income inequality, therefore, it is necessary to further analysis how the strategy to manage regional development in the midst of regional disparities and the factors causing regional disparity, where this situation has worsened with the imposition of large-scale social restrictions in the province of West Sumatra, Indonesia.

Figure 2 Inequality of per Capita Income in West Sumatra Region According to Theil Entropy Index
Research Method
The concept of regional development analysis used is from the regional economic growth mainstream, especially spatial disparity analysis, spatial equity and spatial convergence, and spatial econometrics, as well as regional economic development and innovation (Fisher and Nijkamp, 2014). The use of innovation that comes from three types of knowledge based products such as R&D, namely: analytical (science based), synthetic (engineering based) and symbolic (art based), the three of them constitute an inseparable unit to produce innovation in regional development. The study of regional disparities in West Sumatra of Indonesia and policy considerations for carrying out structural changes in the economy to create a balance in regional development uses a regional science approach.
This type of research is a descriptive study using spatial data analysis method which begins with measuring the disparity of income per capita per district and city in West Sumatra province, Indonesia. The convergence measurement method proposed by Barro & Sala-i-Martin, (1992) and Barro et al. (1991) takes the following equation:
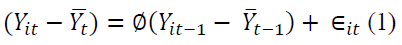
Where:
Yit = is the income per capita of region i, at time t.
 = is the average per capita income of the region at time t.
If value Φ >1 Indicates divergence
If value Φ <1 Indicate convergence.
Furthermore, the analysis method of measuring convergence to income growth is also used with the β convergence method from Barro & Sala-i-Martin (1992) which takes the following form:
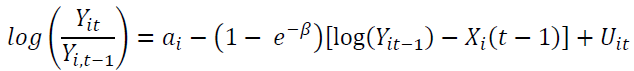 (2)
(2)
If the coefficient β is negative, significant, then the per capita income growth is experiencing convergence, and vice versa. Furthermore, the average convergence between regions can be estimated by: γ = -Ln(1+ T?)/T. Thus, it can be determined that the growth in per capita income of districts and cities has experienced convergence from time to time; toward equilibrium at the average convergence or divergence; away from the convergence average.
The results of this regional disparity measurement analysis are continued with spatial econometric analysis, to determine a number of factors that drive the convergence of growth in per capita income between districts and cities in West Sumatra province. The purpose of this analysis is to define the nature of the interrelationship between the convergence variable as the dependence variable with a number of independent variables such as economic growth, small and medium enterprises, GDP per capita, direct government investment, available road infrastructure, available educated workforce, poverty level, unemployment rate, and the rate of urbanization. Variable land availability for lowland rice farming and horticulture (land availability for wetland food crops).
Analysis of spatial and spatial econometric data was carried out to test the characteristics of the convergence of the region and its response to neighbouring areas which have an impact on socio-economic factors, (Putra et al., 2020; Kelejian & Piras, 2017), so as to formulate regional development strategies from the results. This study built a spatial weight matrix for 19 districts and cities in the province of West Sumatra using the concept of geographic distance because some districts and cities do not directly border and they directly border neighbouring provinces.
Analysis of spatial data is carried out in several steps: first, this study uses the Moran Index and Moran scatter plot to analysis the global and local characteristics of spatial agglomeration on convergence of regional per capita income (Cliff & Ord, 1975; Getis & Ord, 1992). Second; This study builds a spatial lag model (SLM) (Anselin, 2010), and a spatial error model (SEM) to analysis the mutual relationship between convergence of per capita income in regencies and cities with some of the social economic indicators mentioned above. This study built a shape file (shp.file) from the dependent variable and the independent variable in ArcGIS software and exported it to the Geoda software (Anselin, 2003). All analysis processes in the study were carried out using GEODA 1.14.
The spatial autocorrelation analysis built on the variable convergence of income per capita of districts and cities in West Sumatra and its influencing socio-economic indicators is based on the first geographic law, which reflects the degree of data interdependence from two spatial locations. Moran I statistics have been commonly used as an indicator of global spatial autocorrelation (Anselin, 1992 & 1990). The Moran index then takes the following form:
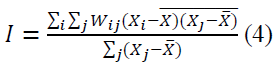
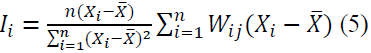
Where I is the global Moran Index, whose value is between -1 and 1. If the value of I Moran Index is close to 1, then there is spatial autocorrelation, on the other hand, if the value of I is close to zero, there will be no spatial autocorrelation. According to Glazier et al. (2004) Moran's I value> 0.2 or <-0.2 has implications for the significance of spatial autocorrelation.
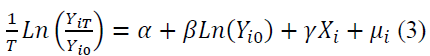
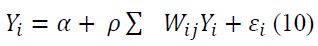
Spatial econometric focuses on the interaction model between districts and cities that are the samples of this study. Spatial econometric studies have become important in regional development at this time. According to Cliff & Ord (1975) research on cross sections, especially spatial lag models, has become an important issue in regional development research. This study will estimate the standard regression with the Ordinary Least Square (OLS) method by taking the following equation:
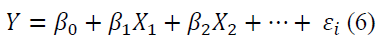
Where Y is the convergence of the per capita income of districts and cities in West Sumatra, Xi represents the socio-economic indicators that influence it, β0 represents constants, and β1 and β2 represent the regression coefficient, and εi represents the error term.
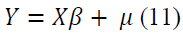
Furthermore, this study also analysis the spatial lag model and the spatial error model. When compared with OLS, the spatial econometric model considers spatial dependence in regression models as OLS could not do before, to produce consistent estimators (LeSage, 1999; LeSage, 2008; Patuelli et al., 2009). The spatial lag model (SLM) (Griffith et al., 2019), and the spatial error model (SEM) are part of the spatial econometric model that is commonly used in regional development analysis. SLM assumes that there is a spatial dependence in the dependent variable, whereas SEM assumes that there is also a spatial dependence in the error term. The form of the derivative equation of SLM can be seen in the following equation:
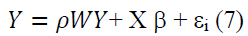

Where, Y is n x 1 the dependence variable vector, n, is the unit of observation, W is the spatial contiguity matrix which describes the neighbourhood pattern of the spatial units in the sample, ρ is the spatial auto correlation coefficient, X represents a matrix of explanatory variables, related to k x 1 the vector of the regression coefficient of β and ε, is the random error vector. The special form of SLM is:
Where Wij is an element of the spatial contiguity matrix. ΣWij is a spatial variable that is built from the spatial contiguity matrix and the dependent variable and the system are stationary. So this model represents the spatial structure of the dependent variable Y. This is a model that considers the impact of spatial correlation on the dependent variable, while ρ is a parameter related to the independent variable Y on the spatial weight variable Y(Anselin, 2016).
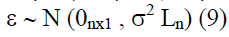
On the other hand, SEM considers the spatial dependence in the error process which can be represented by equations:
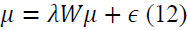
Where, λ is the spatial autocorrelation coefficient
The estimation of the SLM and SEM coefficients can be done with the maximum likelihood (ML). How the form of the process of determining the right spatial regression model from this model can be seen in Figure 3 below as stated in the Technical guide in using Geoda software, in (Anselin, 2004; Anselin & Rey, 2012; Anselin, 2013).

Figure 3 Spatial Regression Decision Process
Furthermore, to measure the accuracy of spatial models, both SLM and SEM, 4 indicators are used which can be considered when the ML approach is used, the four indicators are: (1). Pseudo R2, (2) maximum likelihood (LIK), (3) Akaike information criterion (AIC) and Schwartz Criterion (SC). A good model (goodness of fit) is fulfilled if the Pseudo R2 value is higher, the LIK value is higher, while for AIC and SC the small value is for a better model (Anselin, 2019; Putra et al., 2020).
Next, after finding the dominant factor causing regional development inequality, an analysis is then carried out on how policies manage inequality in this region, which has worsened since the imposition of large-scale social restrictions during the Covid-19 pandemic in West Sumatra province, Indonesia. Analysis of how to manage development policies that are experiencing inequality and are getting worse with the imposition of large-scale social restrictions in the province of West Sumatra, using the interpretative structural modelling (ISM) method (Sage & Smith, 1977; Sage, 1981; Sharma & Gupta, 1995; Rajala & Sage, 1980). This ISM can determine the direction of policies and strategies in reducing regional development disparities in the province of West Sumatra, Indonesia, using the assistance of expert opinion through the development planning process (using AHP),(Kannan et al., 2008), to determine the hierarchy of the most important development policies and priorities that can be carried out for reduce regional development inequality that has occurred so far.
Results and Discussion
Disparity of Per Capita Income in the Development Area of West Sumatra
The income per capita for development areas in West Sumatra shows a tendency that urban areas have a much higher income per capita than those of the district. The city of Bukittinggi ranks as the city with the highest per capita income, reaching Rp.66.52 million, far above the average of West Sumatra province itself which is only Rp.45.28 million in 2019, among the city areas, Payakumbuh ranks at the bottom, even though the city of Payakumbuh is already above the average of West Sumatra province, Figure 4.

Figure 4 Comparison of District and City per Capita Income in West Sumatra in 2019
The districts and cities that have the highest per capita income are the districts of Padang Pariaman and the Mentawai Islands with Rp. 51.22 million and Rp. 50.46, respectively. These are above the average of West Sumatra province, and are in the group of urban areas. South Pesisir District is in the last position because it only has per capita income of IDR 30.27. This is in line with the large number of poor people in the South Pesisir district.
On the other hand, there are five regions with the highest GRDP-HB, namely the city of Padang, Padang Pariaman, Agam, Lima Puluh Kota and West Pasaman, see Figure 5a. Almost all of them are on the West coast, except for the South Coast. This is also in line with the quantile region with the largest population; Figure 5b, as well as areas along the West Coast of West Sumatra province, so that there is a diversity and distribution of areas with the highest and lowest per capita income that no longer follow this geographical pattern, as shown in Figure 5c.
Based on Figures 5a to 5d above, it can be seen that there is diversity in per capita income whose patterns and trends cannot be determined. Does this diversity or disparity divide between coastal areas; which has the potential of natural resources that are more diverse because of the potential for marine resources, with the interior of West Sumatra which has the potential for natural wealth in lowland rice farming and horticultural and perennial crops. What causes the diversity of income per capita as a measure of the success indicator of regional development in West Sumatra.

Figure 5 (a) Quantile Pdrbhb in 2019 (b) Quantile Population in 2019 (c) Quantile GRDP per Capita (d) Quantile Poor People
Regional disparities occur and are significant in the data on per capita income of districts and cities in West Sumatra by regressing between per capita income and average per capita income during the 2003-2019 period, as indicated by (Barro, 1991), the coefficient of disparity in West Sumatra is stable (steady state) between 0.4-0.6. There are 12 regencies and cities experiencing convergence towards this steady state, and six districts and cities experiencing divergence conditions. For more details, see the following Table 1.
| Table 1 Regression Results With OLS Method Convergence Conditions of per Capita Income in West Sumatra | |||||
| No | Region | Coefficient Convergence (f) | t Statistic | Probability | R2 |
| 1. | South Pesisir | 0.698302 | 3.2036 | 0.0069 | 0.9803 |
| 2. | West Pasaman | 0.598912 | 3.7529 | 0.0024 | 0.9535 |
| 3. | Lima Puluh Kota | 0.459723 | 2.2688 | 0.0410 | 0.8799 |
| 4. | Agam | 0.468325 | 3.1126 | 0.0090 | 0.9541 |
| 5. | Solok City | 0.507197 | 2.8075 | 0.0148 | 0.9488 |
| 6. | Tanah Datar | 0.518752 | 3.0801 | 0.0088 | 0.9416 |
| 7. | Sijunjung | 0.827836 | 5.2119 | 0.0002 | 0.9609 |
| 8. | Solok District | 0.596824 | 4.3096 | 0.0008 | 0.9695 |
| 9. | Sawahlunto | 0.538314 | 2.7027 | 0.0181 | 0.9451 |
| 10. | Dharmasraya | 0.590290 | 2.3706 | 0.0339 | 0.4833 |
| 11. | Padang | 0.915210 | 5.3942 | 0.0002 | 0.9627 |
| 12 | South Solok | 1.016272 | 11.0257 | 0.0000 | 0.9916 |
| 13. | Pariaman City | 0.622788 | 4.0282 | 0.0017 | 0.9859 |
| 14. | Padang Pariaman | 0.843222 | 5.8473 | 0.0001 | 0.9249 |
| 15. | Padang Panjang | 0.508150 | 2.1031 | 0.0572 | 0.9047 |
| 16. | Bukittinggi | 0.485665 | 2.0736 | 0.0603 | 0.9493 |
| 17. | Payakumbuh | 1.120976 | 6.5828 | 0.0000 | 0.8382 |
| 18. | Mentawai Islands | 0.407316 | 1.8345 | 0.0915 | 0.7497 |
| 19. | Pasaman | 0.589322 | 4.1044 | 0.0012 | 0.9817 |
The regression results of the convergence conditions of the per capita income of districts and cities in the West Sumatra region show that all the convergence coefficients are significant, but there are 6 regions that have a higher convergence coefficient and experience divergence above the average stable condition (steady stated), so that these six regions are the ones that have a higher convergence coefficient. is suspected of experiencing a large inequality of income per capita compared to the average income per capita of regencies and cities in West Sumatra. Sixth of this area is South Pesisir district, Sijunjung district, Padang Pariaman district, South Solok district, Padang city, and Payakumbuh city. All of which increase in per capita income above the steady state conditions in the West Sumatra region.
Thirteen districts and cities that have convergence coefficient values ranging from 0.4 to 0.65 as a steady state condition of changes in the average per capita income of West Sumatra during the analysis period, namely 2003 to 2019. The regions experiencing convergence of per capita income are West Pasaman, Lima Puluh Kota district, Agam district, Solok City, Tanah Datar district, Solok district, Sawahlunto city, Dharmasraya district, Pariaman city, Padangpanjang city, Bukittinggi city, Mentawai Island district, and Pasaman district. In general, districts that experience this convergence have per capita income that is below the average per capita income of West Sumatra, namely IDR 45.28 million, except for urban areas such as Bukittingi city, Pariaman city, and Padang Panjang city which are all of these cities has a per capita income above the average per capita income of West Sumatra.
Figure 6 below illustrates that the dotted line for the disparity coefficient and the convergence coefficient, these two linear trend lines show that the per capita income of districts and cities in West Sumatra experienced a divergence during the 2003 to 2019 period. Padang and Payakumbuh city. And there are four districts that also contribute to the development of divergence in per capita income in the West Sumatra region, namely the South Pesisir district, Sijunjung district, Padang Pariaman district and South Solok district. The highest divergence was experienced by Payakumbuh, South Solok and Padang cities.

Figure 6 Convergence of West Sumatra Regional Capita Income
The high coefficient of divergence in income per capita in six regencies and cities which shows a tendency of accelerating increases in per capita income, of course, requires further explanation, considering that three of these six regions are positioned among the rankings of West Sumatra's per capita income, which are below the provincial average, namely South Pesisir district, Sijunjung district, and South Solok district. Meanwhile, the three regions experiencing high divergence, namely Padang Pariaman, Padang City and Payakumbuh City are regions that have a per capita income ranking above the average per capita income of West Sumatra. It is expected that by using regional spatial disparity analysis, it is able to discard six regions that experience high divergence in per capita income. The initial explanation can be put forward because this area has the highest number of poor people as well, and South Solok is a neighbour less area.
Regional Spatial Variations of Disparities and Their Socio-Economic Indicators
In this analysis (Figures 7 a, b, c, d), it tries to find an explanation of the factors causing the divergence of income per capita in regencies and cities by looking at spatial interactions in economic, physical and social activities. All the variables used are grouped into these three clusters, namely the variable economic factors; namely economic growth, GRDP per capita, number of MSMEs, use of natural resources (land) for main commodities such as coffee, cocoa, oil palm, coconut and rubber, the number of productive workers in the processing industry, agriculture and trade. The variable area physical cluster is the length of the road and the ratio of the length of the road to the population, the ratio of the length of the road to the area, the number of transportation vehicles. The social cluster consists of the variable number of poor people, life expectancy, and HDI numbers, gender inequality index.

Figure 7 Standard Deviation Map of Spatial Distribution (a) Regional Disparities (b) GRDP per Capita (c & d) Indicators of socioeconomic Disparity
There are 12 variables that cause regional inequality in West Sumatra. The regional inequality used is the convergence coefficient obtained from model, which measures regional convergence using data on per capita income of districts and cities in West Sumatra.
The Moran Index of regional convergence in West Sumatra is greater than 0 (see Figure 8); this indicates that the convergence of regional per capita income in West Sumatra has positive spatial autocorrelation. As additional information, the p-value of 0.00028 is smaller than 0.05, so it can be said that the value of this variable is spatial.

Figure 8 Regional Autocorrelation of Coefficient Disparity
Figures 9a and 9b show with the LISA Map of coefficient convergence per capita income in the West Sumatra region, there are 2 districts that are statistically significant for spatial clustering, namely Padang City and Agam District, and there are 10 districts and cities that have no significant spatial auto correlation, which is interesting. There are 7 isolated districts (neighbourless); do not have spatial auto correlation with other areas; this means that these seven regions are not connected or geographic distribution is low, with other regencies and cities intensively.

Figure 9a Local Indicator of Spatial Association (LISA) Cluster Coefficient Disparity of Perapita Income in West Sumatra Region

Figure 9b Local Indicator of Spatial Association (LISA) Significant Cluster MAP
Figure 9b illustrates the local indicator spatial association (LISA) for per capita income convergence which shows H-H of 1, namely Padang City, and L-L also has 1, namely Agam district. In this figure, it can be seen that there are no districts and cities that have a geographic distribution of L-H and H-L. These results indicate that a spatial auto correlation exists, between disparities in the per capita income of districts and cities in West Sumatra; therefore a spatial regression approach is needed.
Evidence for the Spatial Econometric Model of Regional Disparities
The results of previous global and local spatial autocorrelation analysis show that spatial clustering is in the convergence of per capita income at the district and city levels in West Sumatra. Therefore, in the next analysis, an analysis of the spatial econometric model was carried out using the spatial interdependence of per capita income as data. Table 2 shows the regression results of the estimation method using OLS to the convergence coefficient model of per capita income in West Sumatra, as a first step in developing an econometric spatial model. This model has an R2 value of 0.701728. Other indications of the feasibility of the spatial regression model are maximum likelihood (15.2643), AIC (-4.52857) and SC (7,74914), all of which state that the accuracy of this model has met the test requirements.
| Table 2 Ordinary Least Square Estimation of Disparity Regional West Sumatra | ||||
| Variable | Coefficient | Std Error | t-Statistic | P-Value |
| Constant | 0.93831 | 2.260852 | 0.415025 | 0.69256 |
| GDP per capita | -0.0490278 | 0.0217873 | -2.2503 | 0.06541 |
| Economic growth | -0.313105 | 0.258282 | -1.21226 | 0.27098 |
| HDI | -0.0196764 | 0.0968417 | -0.203181 | 0.84571 |
| life expectancy | 0.0555213 | 0.115481 | 0.480782 | 0.64770 |
| Doctor | 0.00186504 | 0.0017824 | 1.04636 | 0.33570 |
| net enrolment rate | 0.0221628 | 0.0172478 | 1.28496 | 0.24618 |
| Road | -0.000213455 | 0.000251861 | -0.847512 | 0.42921 |
| cultivated land | -1.47997 | 1.78323e-06 | -0.829936 | 0.43834 |
| Rubber land area | 4.72499 | 6.87877 | 0.0686894 | 0.94747 |
| Poverty_SI | 1.64959 | 1.06727 | 1.54562 | 0.17315 |
| fish production | -4.05843 | 5.36993 | -0.75577 | 0.47840 |
| agricultural labor | -6.6441 | 5.78144 | -1.14921 | 0.29421 |
| R2 | 0.701728 | |||
| Maximized log-likelihood (LIK) | 15.2643 | |||
| Akaike Information Criterion (AIC) | -4.52857 | |||
| Schwartz Criterion (SC) | 7.74914 | |||
The OLS coefficient (see Table 2) shows that GDP per capita, economic growth, the number of MSMEs, investment, HDI, length of roads, cultivated land, fish production and agricultural labour have a negative coefficient value, meaning that an increase in the value of this variable will cause a decrease in per capita income convergence between districts and cities in West Sumatra region. On the other hand, the variable life expectancy, number of doctors, NER, gender inequality index, poverty depth level has a positive coefficient value, which will increase the convergence of per capita income between districts and cities in West Sumatra. Therefore, success in development planning, especially in improving per capita income, economic growth, HDI, road length, cultivated land, capture fisheries and aquaculture production, and agricultural TK, will be able to reduce the convergence of per capita income between districts and cities in West Sumatra.
The test for non-normality (Jarque-Berra) score (0.1451); p-value=0.93001) see Table 3 below indicating the normal distribution of the error term, and a high value from the Breusch-Pagan test (14.8157; p-value=0.25167) there is no heteroscedasticity. Matrix correlation coefficients among independent variables have been calculated, in order to eliminate multicollinearity. According to Anselin & Rey (2012) multicollinearity conditions occur when the number of coefficients is greater than 30, if it is smaller than that, there is no multicollinearity.
| Table 3 Regression Diagnostic | |||
| DF | Value | P-Value | |
| Normal Error (Jarque-Berra test) | 2 | 0.1451 | 0.93001 |
| Heteroskedastisity (Breusch-Pagan test) coefficient | 12 | 13.4829 | 0.33494 |
Table 4 shows that the LM lag of the per capita income convergence coefficient model is more significant than the LM error coefficient (ERR) or the p-value must be less than 0.05 to be significant. According to Anselin & Rey (2012), this indicates that the convergence of per capita income between districts and cities in West Sumatra is not randomly distributed, but it is spatially correlated. Therefore, we must develop a spatial lag model (SLM) in modelling the convergence of per capita income in West Sumatra.
| Table 4 Diagnostic for Spatial Regression Modelling | |||
| Test | MI/DF | Value | p-Value |
| Lagrange Multiplier (LM)-Lag | 1 | 3.5218 | 0.06057 |
| Robust LM-Lag | 1 | 8.4534 | 0.00364 |
| LM-error(ERR) | 1 | 0.1286 | 0.71990 |
| Robust LM-ERR | 1 | 5.0602 | 0.02448 |
| LM-Sarma | 2 | 8.5820 | 0.01369 |
Table 5 shows the results of SLM in modelling the convergence of income per capita in districts and cities in West Sumatra. In the lag model, a new variable for spatial lag coefficient named “W_Kodisparity” has been entered into the model. The coefficient parameter (ρ) reflects the effect of the spatial dependence between the samples data used, the average measurement of this variable affects neighbouring observations on a particular observation. This coefficient value has a negative and significant sign. This indicates that there is an indirect effect between the neighbours. Meanwhile, for other variables, it still shows the same coefficient sign as the sign in the OLS model, but the effect of increasing rubber land area, cultivated land, fish production, and agricultural labour has become more significant and significant in reducing income convergence between districts and cities in the West Sumatra region. Therefore, the issue of the availability of cultivated land area, rubber land area, fishery production and agricultural labour availability is an issue that must be focused on because it will reduce the convergence of per capita income.
| Table 5 Results of the Spatial Lag Model of West Sumatra Regional Disparities | ||||||
| Variable | Model OLS | Spatial Lag Model (SLM) |
Spatial Error Model (SEM) | |||
| Coefficient | t-Statistic | Coefficient | Z-Value | Coefficient | Z-Value | |
| W_Kodispar/ Lambda | -0.5001 | -26.7252 | -0.4077 | -1.3692 | ||
| Constant | -7.6595 | -1.1840 | -18.8457 | -348678 | -8.2982 | -3.1313 |
| Income per capita | -0.0077 | -0.4553 | 0.0244 | 16.1136 | -0.0059 | -1.1693 |
| EcoGrowth | 0.1303 | 0.4875 | 0.6283 | 26.8186 | 0.1716 | 2.0142 |
| Cultivate_land use | -0.2144 | -0.5319 | 1.1409 | 20.7512 | -0.2498 | -1.9251 |
| MSME | 2.6568 | 0.5628 | -7.1511 | -16.0804 | 2.1716 | 1.3588 |
| GrossF_CapitalF | -24791 | -0.3233 | -9.1321 | -2.2235 | -1.5163 | -0.5940 |
| Road RatioPop | 31.9935 | 0.7488 | 122.947 | 30.1366 | 33.8684 | 2.5055 |
| Road RatioArea | -0.2733 | -2.1128 | -0.2878 | -41.8401 | -0.2905 | -7.2305 |
| Number of Transported | -4.2802 | -1.2965 | -7.5761 | -35.4364 | -4.5882 | -4.6238 |
| HDI | 0.2958 | 1.5452 | 0.5239 | 39.6043 | 0.3121 | 5.4253 |
| Life_Expectancy | -0.1995 | -1.4142 | -0.3621 | -376347 | -0.2122 | -4.9694 |
| Net_EnrollmentR | 0.0109 | 0.99284 | 0.0338 | 31.8529 | 0.0123 | 3.011 |
| Poverty_SI | 2.8414 | 1.6709 | 4.3432 | 40.9775 | 3.0923 | 5.4488 |
| Gender_InequalityI | 0.1772 | 0.3605 | -2.0299 | -23.4094 | 0.2349 | 1.4547 |
| Doctor_ServiceR | 0.0002 | 0.8477 | 0.0009 | 31.005 | 0.0002 | 3.0932 |
| Prop_ProdAge | -0.9456 | -0.6348 | -2.4281 | -25.2127 | -1.1123 | -2.3769 |
| R2 | 0.9667 | 0.9991 | 0.9708 | |||
| R2 Adjusted | 0.8007 | |||||
| AIC | -40.2359 | -104.247 | -46.4716 | |||
| SIC | -25.1249 | -87.2473 | -30. 4162 | |||
| Likelihood Ratio Test | 67.8415 | 8.0659 | ||||
Taking into account the feasibility and accuracy of the model, the Pseudo R2 value in SLM is much higher than the OLS model, so this model is better than the standard OLS model. Therefore, we must develop a spatial lag model (SLM) in 17 modelling the inequality of income per capita in West Sumatra.
The spatial distribution of per capita income inequality between districts and cities in West Sumatra from an economic perspective shows the distribution pattern of economic growth, use of cultivated land, the number of developing MSMEs, the number of transportation of people and goods, and an increase in investment. The results of the spatial regression (Table 6) show that the higher the number of MSMEs the lower the income savings between districts, and cities. Two clusters of MSME interaction with per capita income were formed, namely Agam district and 50 Kota districts.
| Table 6 Diagnostic for Spatial Regression Modelling | |||
| Test | MI/DF | Value | p-Value |
| Moran I | -0.0433 | ||
| Lagrange Multiplier (LM)-Lag | 1 | 16.8964 | 0.00004 |
| Robust LM-Lag | 1 | 18.6110 | 0.0002 |
| LM-error(ERR) | 1 | 0.0377 | 0.84631 |
| Robust LM-ERR | 1 | 1.7523 | 0.18559 |
| LM-Sarma | 2 | 18.6487 | 0.0009 |
Based on the analysis of the local indicator of spatial association (LISA), the MSME development cluster centre is located in two districts, namely Lima Puluh Kota, and Agam districts, which is significant at 0.05%. The development of the number of MSMEs that is most sensitive to an increase in inequality in per capita income, as indicated by the coefficient value of the largest negative 7.57. There are 7 districts and cities that interact directly with the MSME activities of the two cluster centre, namely: Padang Pariaman district, Tanah Datar district, South Pesisir district, Bukittinggi City, and Payakumbuh city.
On the other hand, when viewed from the impact of this spatial interaction between the number of MSMEs that are centred in Agam district and economic growth, it turns out that Agam and Dharmasraya districts are districts that have an impact on increasing the number of MSMEs in line with their economic growth, for the district of Lima Puluh Kota itself. It has not had a significant impact on its economic growth.
There are 6 regencies (Figure 10) and cities that have the highest number of MSME businesses, namely: Agam district, Padang Pariaman district, South Pesisir district, Lima Puluh Kota district, Bukittinggi city, and Tanah Datar district. The center for the development of MSMEs is located in Agam district and the most significant spatial autocorrelation is MSMEs in the Dharmasraya district, as shown by the LISA map analysis in Figure 11 below.

Figure 10 Area Quantile with the Most Dominant and Spatial MSME Enterprises

Figure 11 Moran Index Value for Spatial Autocorrelation of MSMES And Inequality of Income per Capita
The results of the spatial autocorrelation analysis of MSME development as an important variable that reduces the inequality of per capita income, the centre for MSME development is in Agam and Lima Puluh Kota districts, and there is one district, Dharmasraya, which is significantly spatial autocorrelation with the activity centre of Agam and Fifty districts. City, while the other three areas, such as South Pesisir district, Padang Pariaman district, do not seem to have significant local spatial association (LISA) interactions. This means that the two regions that have the most number of MSME businesses among the districts in West Sumatra province, but do not yet have spatial autocorrelation with the centre of MSME activity, namely Agam district and Lima Puluh Kota district.
Figure 12 shows the spatial autocorrelation for MSME activities in three regions, namely Agam district, 50 cities district and Dharmasraya district, which is indicated by the significant Lisa value map is significant at 1% for Agam district and 5% for Lima Puluh Kota district. There are ten areas where the spatial autocorrelation of UMKM activities is not significant, namely: South Pesisir district, Padang Pariaman district, Tanah Datar district, Sijunjung district, and Padang city.

Figure 12 Lisa Map of MSMES with Income Inequality
Moran's index for the investment variable is 0.134 which is greater than 0 (see Figure 13 below), which means that there is positive spatial autocorrelation. The p-value is less than 0.05 and the Z score is negative at -2.2235. This indicates that inequality of per capita income exists and is negatively correlated with inequality in per capita income, where the higher the investment, especially induced investment, will reduce the inequality of income per capita in West Sumatra.

Figure 13 Global Autocorrelation of West Sumatra Investment Variables
Analysis of the local index spatial association (LISA) shows that investment in three districts is statistically significant in spatial clustering, namely Agam district, Lima Puluh Kota district and South Pesisir district. The number of districts showing H-H clusters is 2, namely Agam district and Lima Puluh Kota district, and one L-H cluster, namely South Pesisir district. These results indicate that spatial autocorrelation exists among investment districts, namely Agam, Lima Puluh Kota and South Pesisir district, therefore, a spatial regression approach is needed to explain the increasing investment factor, which will reduce inequality in per capita income. The nine areas where the increase in investment have not affected the level of inequality in per capita income are Padang City, Padang Pariaman district, Pariaman City, Solok district, Tanah Datar district, Sijunjung district, and Dharmasraya district, Sawahlunto City, and Padang Panjang City.
Figure 14 below shows that the high spatial autocorrelation in investment between Agam and Lima Puluh Kota districts which encourages reducing inequality in per capita income, and spatial autocorrelation between the two regions and South Pesisir district, in investment or gross fixed capital formation will reduce inequality in per capita income in the West Sumatra region. Therefore, caution is needed in arranging investments in the two areas that are the centre of this cluster. If it is related to the variable of increasing the number of MSME businesses, the investment that is able to reduce the inequality of per capita income in the West Sumatra province is in the type of MSME business in the processing industry and tourism service business MSME, because it turns out that the number of businesses and workers of MSMEs and SMEs is the most These three areas are the centre of the SME and IKM business clusters, and most importantly, if the centre of these clusters increases the investment in the MSME and IKM sectors, it will be able to reduce the inequality of per capita income in the West Sumatra region, because this region has interactions with the surrounding areas. Or spatial autocorrelation significantly on investment and MSME

Figure 14 West Sumatra Investment Area Cluster According to Lisa Analysis
The variable number of people and goods transport has a spatial autocorrelation with per capita income as indicated by the Moran Index value of 0.587 which is greater than 0, and the p value is less than 0.05, and the z-value is negative of -35.4364, so it can be concluded that the variable value it is spatial (Figure 15).

Figure 15 Global Variable Autocorrelation Number of Transportation of People and Goods in West Sumatra Region
There are six regencies, and cities that are in the highest quantity of people and goods transported, namely: Padang City, Solok City, Solok district, Padang Pariaman district, Agam district, Lima Puluh Kota district, and Tanah Datar district. However, the cluster map analysis or LISA of map analysis shows that only Solok district contributes to this per capita income inequality caused by changes in the number of people and goods transported, the results of the cluster with the LISA Map show that there are LL interactions with other districts and cities that have clusters that same. So it can be said that the increase in the number of people and goods transported in Solok district has weak interactions with the surrounding area.
In medium quantile, there are also six districts and cities, namely, South Pesisir district, Dharmasraya district, Sijunjung district, Pasaman, and West Pasaman districts, and Mentawai Island districts, an increase in the number of transport of goods and people has a moderate impact on decreasing inequality of district per capita income, and cities in West Sumatra. In fact, there is one district that has the lowest impact on increasing the number of transportation of goods and people on reducing inequality in per capita income, namely South Solok district. South Solok is indeed one of the outermost districts of the province of West Sumatra in this Geoda analysis, this area is included in an area that does not have a neighbour (neighbourless). This is one of the most important things in the development of regional development policies in West Sumatra, there are 7 neighbouring areas, namely: South Solok district, Pasaman district, West Pasaman district, Solok city, Payakmbuh city and Buktitinggi city, as well as the Mentawai islands district.
Based on the analysis of the local indicator spatial association (LISA) it can be said that the districts, and cities of West Sumatra are not yet fully integrated with each other, there are seven districts and cities which are categorized as having no neighbours (neighbourless) for all groups of economic variables, groups of physical variables and social (See Figure 16). On the other hand, in the group of economic variables that most significantly affect the reduction of inequality, such as the number of MSME businesses and investment in the form of gross fixed capital formation, these seven regions have no spatial relationship with their neighbouring areas. Spatial autocorrelation for each variable used for analysis shows that autocorrelation clustering only occurs in nine districts, meaning that spatial autocorrelation has not fully occurred in districts and cities in West Sumatra, the implication is that spatial interactions between these areas are in economic, physical development. Regional and social, it has not happened and has not been able to encourage the creation of agglomeration with one another. Therefore, in future regional development, the creation of agglomeration and spatial interactions in all aspects of regional development needs to be done so that the development of the West Sumatra region is able to encourage an increase in per capita income, so that in turn it can encourage quality economic growth, evenly distributed among development areas, reducing leakage of the regional economy, because it is attracted by the growth centre of neighbouring regions.

Figure 16 Lisa Cluster Map of the Number of Goods and People in West Sumatra
Furthermore, the policy direction strategy to manage how existing regional inequalities can be reduced, based on the results of the analysis with the spatial econometric model that has been carried out, it can be stated that several elements of policy direction to reduce regional development inequality in the province of West Sumatra, Indonesia, among others E1, Improvement of the MSME cluster center and its supporting areas, E2, Increasing investment in MSMEs, especially those engaged in the tourism sector, which during the Covid-19 pandemic still existed, were food and beverage MSMEs and weaving industry MSMEs. E3, Increased transportation of people and goods between regions, E4, Increase in the ratio of road length to area, E5, Increased agglomeration between regions, E6, Increased life expectancy, E7, Improvement of maternal and child health, E8, Increasing the role and participation of women in development, and E9, Increased skills at productive age. This finding is in line with Kuchiki (2019) which states that the reduction in convergence can be due to the integration of the agricultural and tourism sector, it turns out that in this determination the MSME sector is able to reduce regional inequality by increasing the MSME sector engaged in the tourism sector.
The results of the analysis using the interpretative structural modeling (ISM) approach show that all elements of the policy strategy to reduce regional inequality are in square 3 which illustrates the linkage between elements is very strong, (see Figure 17). The nine elements have a strong thrust (drive power) and dependence (linkages) on other elements is also high. Therefore, in making a policy an opinion of experts is needed to determine the order, and hierarchy, through the ISM approach.

Figure 17 Matrix Relationship Between Drive Power, and Dependence Policy Strategies Manage Regional Inequality
Based on the policy structure for directions to reduce inequality in the Province West Sumatra has five levels of policy. The highest priority element in policy making is the E7 element, namely the improvement of maternal and child health (see Figure 18). For this reason, it is necessary to improve maternal and child health in the areas of South Solok District, Sijunjung District, Pasaman District, West Pasaman District and Mentawai District.

Figure 18 The Hierarchical Structure of the Policy Direction Reduces Regional Inequality in the Province of West Sumatra, Indonesia
The strategy to accelerate development and reduce regional development inequality in the economic aspect that must be done is to increase the centre of MSME clusters in Agam district and Lima Puluh Kota district that need to be strengthened by developing seven MSME buffer areas namely Bukittinggi City, Payakumbuh City, Padang Panjang City, Pariaman City, Padang Pariaman district, Tanah Datar district, South Pesisir district. The UMKM products that need to be developed are the SME snacks and weaving & embroidery industries. In addition, to increase tourism investment and its supporting industries, it is necessary to develop three main tourism investment clusters, namely Agam, Lima Puluh Kota districts. South Pesisir which is strengthened by developing tourism investment in the areas of Padang City, Padang Pariaman District, Pariaman City, Solok district, Tanah Datar District, Sijunjung District, and Dharmasraya District, Sawahlunto City, and Padang Panjang City.
Strategies for accelerating development and reducing regional development inequality in the physical aspects of the area that can be done are the need to increase the number and types of transportation of goods and people to reduce inequality, especially in neighbouring areas, namely South Solok district, Pasaman district, West Pasaman district, and Mentawai Island districts and strengthen the Solok City, Payakumbuh City and Buktitinggi City as transportation hubs for goods and people. It is necessary to increase the ratio of road length (accessibility) to regencies and cities, especially neighbouring areas (Pasaman District, West Pasaman District, South Solok District, Mentawai District to encourage spatial interaction by building economic linkages with each other, linkage of input-output, linkage of supply and demand, using the concept of business agglomeration between regencies and cities.
Strategies to accelerate development and reduce regional development disparities in socio-cultural aspects that must be done is to increase life expectancy through improving the health of mothers, children and toddlers to reduce regional inequality in Solok and Dharmasraya districts, and by paying attention to South Solok District, Sijunjung District, Pasaman, West Pasaman District and Mentawai Islands District. Providing equal opportunities in development activities that reduce the gender inequality index by increasing the roles and equal participation of men and women in the Dharmasraya District and surrounding areas, South Solok District, Sijunjung District, Solok District, West Pasaman District, Mentawai District. Increasing the proportion of productive age through increased education and skills, especially in Tanah Datar, and South Pesisir districts with attention to Solok District, Pasaman District, Lima Puluh Kota District, Padang Pariaman district, and Agam district.
Conclusion
There are six districts and cities that have the highest income inequality per capita, experiencing divergences above the stable average. Payakumbuh, Padang Pariaman district, and Padang cities have the highest divergence. Meanwhile, the districts of South Pesisir, Sijunjung, and South Solok are below the provincial average.
The number of MSME businesses, the amount of investment, especially the formation of gross fixed capital, is factors that have reduced regional disparities so far. Meanwhile, economic growth and use of cultivated land will continue to increase inequality in per capita income in West Sumatra. On the other hand, the increase in the number of goods and people transported and the ratio of road length to area will reduce the inequality of per capita income, however the greater the ratio of the number of roads to the population will actually increase the inequality of per capita income. In addition, the increase in the gender inequality index, the life expectancy rate and the proportion of productive age, which is increasing, is able to reduce inequality, but the increase in the HDI and APM numbers actually increases the level of income inequality per capita.
The creation of mutual interactions in development areas can only be done by reducing physical regional imbalances and economic and social imbalances. In the economic aspect, the development of medium and small and medium enterprises, especially in the processing industry and tourism business, especially in the snack food industry is able to reduce inequality in per capita income. On the other hand, investment in the form of gross fixed capital formation is also the one with the greatest impact on reducing inequality in per capita income, so the choice of this investment needs to be done carefully, so that it focuses on investment options that can reduce inequality in per capita income, such as in industry processing, tourism businesses and wholesale and retail trading businesses need to be carried out.
In the physical aspect of the region, the development of the number of transportation, especially the transportation of goods and people needs great attention, because it will reduce the inequality of income per capita in West Sumatra at the most. This effort must be in line with considering the ratio of road length to the area of districts and cities, so that the availability of road infrastructure for the transportation of goods and people, of course is able to encourage spatial interaction between regencies and cities can be developed, districts that have not interacted with neighbouring areas (neighbourless) need to be reduced in number, by building interconnected economies with one another. Interrelationship of input-output, supply linkages with demand between regions need to be created, using the concept of business agglomeration between districts, and cities. City areas that have not been able to attract the activities of their supporting areas need to redefine their function as centre of non-agricultural activities to support their hinterland areas.
Based on the analysis of the local indicator spatial association (LISA) it can be said that the districts and cities of West Sumatra are not yet fully integrated with each other, there are seven districts and cities which are categorized as having no neighbours (neighboursless) for all groups of economic variables, groups of physical variables and social. On the other hand, in the group of economic variables that most significantly affect the reduction of inequality, such as the number of MSME businesses and investment in the form of gross fixed capital formation, these seven regions have no spatial relationship with their neighbouring areas. Spatial autocorrelation for each variable used for analysis shows that autocorrelation clustering only occurs in nine districts, meaning that spatial autocorrelation has not fully occurred in districts and cities in West Sumatra, the implication is that spatial interactions between these areas are in economic, physical development. Regional and social, it has not happened and has not been able to encourage the creation of agglomeration with one another.
There are nine (9) elements of a development policy strategy that can reduce inequality in West Sumatra, Indonesia, namely E1. Improvement of the MSME cluster center, and its supporting areas, E2. Increasing investment in MSMEs, especially those engaged in the tourism sector, which during the Covid-19 pandemic still existed, were food and beverage MSMEs and weaving industry MSMEs. E3. Increased transportation of people and goods between regions, E4. Increase in the ratio of road length to area, E5. Increased agglomeration between regions, E6. Increased life expectancy, E7. Improvement of maternal, and child health, E8. Increasing the role, and participation of women in development, and E9. Increased skills at productive age.
The strategy for managing development inequality during the Covid-19 pandemic is a high priority starting with improving the health of mothers, and children, increasing the transportation of people and goods between regions, increasing the ratio of road length to area, increasing agglomeration between regions, and increasing the role and participation of women in development. to support increased life expectancy. If this can be done, it will be followed effectively by an increase in MSME business, and investment, which in turn can lead to an increase in the skills of the productive age population.
References
- Anselin, L. (1990). Some robust approaches to testing and estimation in spatial econometrics. Regional Science and Urban Economics, 20(2), 141-163.
- Anselin, L. (1992). Space and applied econometrics: introduction. Regional Science and Urban Economics, 22(3), 307-316.
- Anselin, L. (2003). GeoDa 0.9 user’s guide. Spatial Analysis Laboratory (SAL). Department of Agricultural and Consumer Economics, University of Illinois, Urbana-Champaign, IL.
- Anselin, L. (2010). Thirty years of spatial econometrics. Papers in regional science, 89(1), 3-25.
- Anselin, L. (2013). Spatial econometrics: Methods and models. Springer Science & Business Media.
- Anselin, L. (2016). GeoDA 1.8. 1. In GeoDA Workshop Part I, Center for Spatial Data Science, University of Chicago.
- Anselin, L. (2019). Quantile local spatial autocorrelation. Letters in Spatial and Resource Sciences, 12(2), 155-166.
- Anselin, L.G. (2004). 0.9. 5-i Release Notes. Center for Spatially Integrated Social Science: Urbana, IL, USA.
- Anselin, L., & Rey, S.J. (2012). Spatial econometrics in an age of CyberGIScience. International Journal of Geographical Information Science, 26(12), 2211-2226.
- Ansofino, A., & Zusmelia, Z. (2019). Agro Bussines Development Nexus Tourism In West Sumatra Province. MIMBAR: Journal of Social Affairs and Development, 35 (1), 57-68.
- Ansofino, A., Zusmelia, Z., Yolamalinda, Y., & Lovely, D.D. (2018). Regional economic improvement model through integration of west sumateran rubber market with ASEAN regional market. In Proceedings of the Social and Humaniora Research Symposium (SoRes 2018): Advances Social Science, Education and Humanities Research. Atlantis Press.
- Ansofino, A., Zusmelia, Z., Yolamalinda, Y., & Lovely, D.D. (2019). The Spatial Integration of Crumb Rubber Markets within ASEAN Countries. MIMBAR, 18(4), 1-13.
- Barro, R.J. (1991). Economic growth in a cross section of countries. The Quarterly Journal of Economics, 106(2), 407-443.
- Barro, R.J., & Sala-i-Martin, X. (1992). Convergence. Journal of political Economy, 100(2), 223-251.
- Barro, R.J., Sala-i-Martin, X., Blanchard, O.J., & Hall, R.E. (1991). Convergence across states and regions. Brookings Papers on Economic Activity, 107-182.
- Cainelli, G., Montresor, S., & Marzetti, G.V. (2014). Spatial agglomeration and firm exit: a spatial dynamic analysis for Italian provinces. Small Business Economics, 43(1), 213-228.
- Carlino, G.A. (1980). Contrasts in agglomeration: New York and Pittsburgh reconsidered. Urban Studies, 17(3), 343-351.
- Castells-Quintana, D., & Royuela, V. (2014). Agglomeration, inequality and economic growth. The Annals of Regional Science, 52(2), 343-366.
- Cliff, A.D., & Ord, J.K. (1975). Model building and the analysis of spatial pattern in human geography. Journal of the Royal Statistical Society: Series B (Methodological), 37(3), 297-328.
- Edo, A. (2017). Regional disparities in the Philipines?: Stuctural drivers and policy conciderations. Erkunde, 71(2), 97-110.
- Fujita, M., & Hamaguchi, N. (2012). Japan and economic integration in East Asia: post-disaster scenario. The Annals of Regional Science, 48(2), 485-500.
- Fujita, M., Krugman, P.R., & Venables, A. (1999). The spatial economy: Cities, regions, and international trade. MIT press.
- Geoffrey, J. (2007). Advances in spatial science.
- Getis, A., & Ord, J.K. (1992). 1992: The analysis of spatial association by use of distance statistics. Geographical Analysis 24, 189-206.
- Glazier, R.H., Creatore, M.I., Gozdyra, P., Matheson, F.I., Steele, L.S., Boyle, E., & Moineddin, R. (2004). Geographic methods for understanding and responding to disparities in mammography use in Toronto, Canada. Journal of General Internal Medicine, 19(9), 952-961.
- Griffith, D., Chun, Y., & Li, B. (2019). Spatial regression analysis using eigenvector spatial filtering. Academic Press.
- Kannan, G., Haq, A.N., Sasikumar, P., & Arunachalam, S. (2008). Analysis and selection of green suppliers using interpretative structural modelling and analytic hierarchy process. International Journal of Management and Decision Making, 9(2), 163-182.
- Katsikides, S., & Hanappi, H. (2016). society and economics in Europe. Disparity versus Convergence.
- Kelejian, H., & Piras, G. (2017). Spatial econometrics. Academic Press.
- Krugman, P. (1991). Increasing returns and economic geography. Journal of Political Economy, 99(3), 483-499.
- Kuchiki, A. (2019). The existence of economies of sequence: A theory of architecture in building an industry agglomeration. Regional Science Policy & Practice, 11(3), 597-612.
- Kuchiki, A., Mizobe, T., & Gokan, T. (2017). A multi-industrial linkages approach to cluster building in East Asia: Targeting the agriculture, food, and tourism industry. Springer.
- LeSage, J.P. (1999). The theory and practice of spatial econometrics. University of Toledo. Toledo, Ohio, 28(11).
- LeSage, J.P. (2008). An introduction to spatial econometrics. Revue D'économie Industrielle, (123), 19-44.
- Patuelli, R., Reggiani, A., Nijkamp, P., & Bade, F.J. (2009). Spatial and Commuting Networks. In Complexity and spatial networks. Springer, Berlin, Heidelberg.
- Phillipson, J., Gorton, M., Turner, R., Shucksmith, M., Aitken-McDermott, K., Areal, F., Cowie, P., Hubbard, C., Maioli, S., McAreavey, R., & Monteiro, D.S. (2020). The COVID-19 pandemic and its implications for rural economies. Sustainability, 12(10), 3973.
- Portnov, B.A., & Felsenstein, D. (2005). Measures of regional inequality for small countries. In Regional disparities in small countries. Springer, Berlin, Heidelberg.
- Putra, A. S., Tong, G., & Pribadi, D.O. (2020). Spatial Analysis of Socio-Economic Driving Factors of Food Expenditure Variation between Provinces in Indonesia. Sustainability, 12(4), 1638-1656.
- Rajala, D.W., & Sage, A.P. (1980). On measures for decision model structuring. International Journal Of Systems Science, 11(1), 17-31.
- Rustiadi, E., Panuju, D.R., & Pravitasari, A.E. (2010). Java island: regional disparity and sustainability perspective. Jurnal Kinerja, 14, 444.
- Sage, A.P. (1981). Sensitivity analysis in systems for planning and decision support. Journal of the Franklin Institute, 312(3-4), 265-291.
- Sage, A.P., & Smith, T.J. (1977). On group assessment of utility and worth attributes using interpretive structural modeling. Computers & Electrical Engineering, 4(3), 185-198.
- Sharma, H.D., & Gupta, A.D. (1995). The objectives of waste management in India: a futures inquiry. Technological Forecasting and Social Change, 48(3), 285-309.
- Tobler, W. (1987). Geographical movement. Geographical Analysis, 13(1), 1-25.
- Williamson, J.G. (1965). Regional inequality and the process of national development: a description of the patterns. Economic development and cultural change, 13(4, Part 2), 1-84.
- World Bank. (1993). The East Asian miracle: Economic growth and public policy. In World Bank Bank. Oxford University Press.
- Xu, X., & Lee, L.F. (2019). Theoretical foundations for spatial econometric research. Regional Science and Urban Economics, 76, 2-12.
- Yandell, B.S. (1990). Spatial Econometrics: Methods and Models. Journal of the American Statistical Association, 85(411), 905-907.
- Yatim, A.B.A. (2016). The economic integration of districts and cities in West Sumatra towards market integration to face the ASEAN economic community 2015. Journal of Applied Science and Technology, 9 (2), 1-18.