Research Article: 2018 Vol: 17 Issue: 3
Sustainability Reporting and Firm Performance: A Bi-Directional Approach
Uwalomwa Uwuigbe, Covenant University
Obarakpo Teddy, Covenant University
Olubukola Ranti Uwuigbe, Covenant University
Ozordi Emmanuel, Covenant University
Osariemen Asiriuwa, Covenant University
Gbenedio Akpevwenoghene Eyitomi, Covenant University
Oluwagbemi Simeon Taiwo, Covenant University
Keywords
Sustainability Reporting, Firm Performance, DMBs, Legitimacy Theory, GRI.
JEL Classification
M41, G21
Introduction
No business exists in a vacuum and operates in a closed system without any form of interaction with its environment. Hence, based on their activities, they tend to have some level of impact on the environment and the society through this constant interaction with their environment. As organizations seek to achieve competitive advantages over their competitors, the businesses grow complex and quite industrious, this, in turn, will affect the environment and the society. Industrialization is also associated with economic, social and environmental hazards ranging from environmental degradation, air and water pollution which has dramatically increased deforestation and loss of habitats for aquatic and terrestrial animals (Utile, 2016).
Traditionally, a corporation’s main objective is to grow, survive and maximize value for its owner (shareholders), to meet these objectives they prepare conventional financial reports to investors, potential investors, shareholders and other stakeholders who show their financial performance but this reports usually do not reflect the effect of the operations of the corporation on the environment. According to Simnet, Vanstraelen & Chua (2009) over the past decade, conventional financial reporting has been criticized for not representing multiple dimension of a corporation’s value. The criticism of financial reporting coupled with the current global financial predicament has asserted more pressure on accounting to represent and present the multiple dimension of firm’s value (Utile, 2016). Furthermore, the increasing need for non-financial disclosures and the growth of global ecological awareness and the movement for sustainable economic growth are bringing to the attention of firms towards making its operations sustainable and ecological sensitivity.
The above discussion birthed or gave rise to the sustainability agenda (sustainability reporting) which is linked to earlier ideas like the accounting for human resource and social audits in the 1970s and triple bottom line reporting and environmental reporting in the 1990s, corporate social responsibility reporting and various versions of the GRI (Global Reporting Initiative) guidelines on reporting (Simnet, Vanstraelen & Chua, 2009). Sustainability reporting has become important to both developed and developing economies with the increasing concern for the global environment and preservation of the ecosystem to make it sustainable. In Nigeria for example, the situation is no different because the industry that gives great concern for the effect of their activities on the environment is the oil and gas industry. The Nigerian crude comes from productions fields situated in the swamplands of the Niger Delta. According to Asaolu et al. (2011) the multinationals corporations in the oil and gas industry have been consistently accused of lacking transparency, insensitivity to stakeholders concern, environmental degradation and have continually been targets of community unrest and public criticisms. Nigeria is however classified in the corporate sustainability reporting quadrant tagged “starting behind” (Asaolu et al., 2011). As a matter of fact, Nigeria has no mandatory environmental or social reporting requirement for public companies, though there have been significant efforts like the Nigerian Stock Exchange (NSE) sustainability disclosure guideline 2016.
Prior studies in Nigeria (Olayinka & Temitope, 2011; Uwuigbe & Uadiale, 2011; Uwuigbe, Olubukunola & Anijesushola, 2011; Akinlo & Iredele, 2014) all evaluated corporate social responsibility and environmental disclosure on firm performance in Nigeria. Various studies have examined the link between Sustainability Performance (SP) and Financial Performance (FP) the results are often non-conclusive. According to Belascu & Horobet as cited in Ching, Gerab & Toste (2017).
“The link between social and financial performance can be explained in four categories: (a) unilateral causality-social performance causes financial performance, (b) unilateral causality-financial performance causes social performance, (c) bilateral causality-social performance causes financial performance and financial performance causes social performance and (d) no causal relationship”.
Based on the above background, the study basically takes a bi-directional approach in examine the link between sustainability reporting and firm performance in Nigeria. The study looked at the unilateral causality-sustainability reporting causes, firm performance and unilateral causality-firm performance sustainability reporting in order to understand the bi-directional relationship. The remaining sections of the paper following the introduction are the scope of the study; theoretical framework; literature review and hypothesis development; methodology; data analysis; discussion and conclusion.
Literature Review
Theoretical Framework
There are a number of social contract theories that explain the reason behind corporate social and environmental reporting; these theories also apply to sustainability reporting (Kwaghfan, 2015). They include legitimacy theory, the stakeholder’s theory and the political economy theory. This study adopts the legitimacy theory, signaling theory and slack resource theory as theories concerning social performance could not be considered in isolation since they complement each other. These adopted theories will enable us to achieve the objectives of this study. Unlike the stakeholder’s theory which considers the interest of all stakeholders, legitimacy theory strictly examines the interaction between the company and the society and the motivation for disclosure of environmental and social issues by the company. According to Brown & Deegan (Mousa & Hassan, 2015) Legitimacy theory focuses on the idea of a social contract, suggesting that the survival of a company is largely reliant on the degree to which the company functions within the bounds and norms of society. This means that for the continued survival of a company it must maintain its legitimate status by aligning its operations in line with the society expectations and norms. Failure to align with norms firms may face problems in procurement of the required resources. Some members of the community like, employees, consumers, investors may reject any deal or association with companies that have repute for poor environmental and social behavior (Coopers & Lybrand, 1993).
Therefore, in order for companies to maintain their legitimacy status, they disclose the corporations view on various environmental and social issues in order to make impressions about the company’s activities; they do this through the legitimacy device, usually the annual report. The signaling theory helps us understand that firm usually report or disclose positive information about their activities to show their performance above others (Shehata, 2014). Consequently, this will help improve their reputation and make them attractive to the society. Hence, the legitimacy theory suggests that when firms disclose information on sustainable development, this improves their reputation which in turn will attract members of the society. The attraction could lead to the influx of highly qualified employees, investors and more customers, hence leading to better performance of the firm. This theory attempts to explain sustainability reporting as a determinant of firm performance and expects a positive link from sustainability reporting as a determinant of firm performance.
The slack resource theory as adopted to explain the firm performance as a determinant of sustainability reporting. According to Ahlström & Ficeková (2017)
“The availability of slack resource in company plays an important role due to resources available that can be allocated to social or environmental domains. Corporate slack is the ability to use the available corporate resources and reach a set of goals”.
Wissink (2012) also put forth that
“Slack resources theorists argue that firms with better financial performance will have resources available to invest in CSR activities”.
More investment in CSR activities will improve social performance which will, in turn, improve the reporting content and practice of firms on sustainability issues based on the signaling theory. Therefore, the slack resource theory attempts to explain firm performance as a determinant of sustainability reporting and expects a positive link(Figure 1).

Figure 1.Summary Of Theoretical Framework.
Sustainability Reporting
According to GRI (2011)
“A sustainability report is a report published by a company or organization about the economic, environmental and social impacts caused by its everyday activities. A sustainability report also presents the organization's values and governance model and demonstrates the link between its strategy and its commitment to a sustainable global economy”.
There are a variety of benefits a firm stands to gain from reporting on its sustainability activities. These benefits could include fostering investor confidence, trust and employee loyalty to the firm. Market analyst often reflects on a company’s sustainability disclosures in an attempt to assess the quality and efficiency of management and reporting may offer firms an enhanced access to capital (Dhaliwal et al., 2011).
The concept of Sustainability reporting is perceived to identical with other certain concepts that describe disclosure of information on economic, environmental and social impacts, such as triple bottom line reporting and Corporate Social Responsibility (CSR) reporting. Sustainability reports are voluntarily disclosed by corporations that want to offer additional value and information to their stakeholders concerning the effect their activities and operations have on the society and environment (Garg, 2015). This additional information will provide certain payoffs for the company as identified by Epstein 2008 (Dembo, 2017) those benefits include
“Financial payoffs such as lower capital costs and stock market premiums; Customer-related payoffs such as market share increases, improved reputation; Operational payoffs such as Process innovation and improved resources yields; Organizational payoffs such as reduced risk and increased learning”.
Firm Performance and Sustainability Reporting
The performance of firms can be measured in terms of growth of its size (total assets), profitability (return on assets, return on equity and earnings per share) and market-based proxies (market price per share). Prior studies have argued that size and the profitability of firms could also have an effect on the level of disclosure of information by firms. For example, Al-Gamrh & Al-Dharnari (2016) argued that larger firms are likely to disclose additional information in other to reduce agency cost, improve its reputation, win public support and attract investors. This suggests that more profitable firms and large firms are likely to disclose additional information as result of their ability to invest more in environmental and social activities, hence taking advantage of the benefit from the disclosure of such information. Similarly, Turban & Greening (1997), who also provided pragmatic support for the above argument, observed that firms with high sustainability performance are likely to attract the best quality of employees. Consequently, these firms would attract more qualified applicants, which could add up to its competitive advantage over others. This suggests that firm with high sustainability performance have better firm performance as they attract both human and capital resources from the environment.
Wissink (2012) stated that
“Waddock & Graves discovered the first empirical evidence for the virtuous cycle of corporate social responsibility. They found that social performance was significantly related to subsequent firm performance and firm performance was significantly related to social performance”.
Their claim was further expanded by Surroca, Tribó & Waddock (2010) who also found evidence to support this claim.
Review of Prior Studies
A survey of literature on sustainability reporting on firm performance provide varying results as to the link between reporting on environmental, economic, social issues and firm performances, ranging from positive, negative and mixed results. For example, in developed economies like in the US, Dhaliwal et al. (2011) in their study used KLD ratings to measure non-financial disclosure and cost of equity capital for firm performance discovered a negative relationship between non-financial disclosure and firm performance. Ameer & Othman (2012) concentrated their study in developed Countries, they used Scores on 4 Indices Environment, Diversity, Community and Ethics as a measure for sustainability reporting and ROA for firm performance for period 2006-2010. They took a bi-directional approach and discovered a positive and bi-directional relationship between sustainability practices and firm performance.
In the United Kingdom, Brammer, Brooks & Pavelin (2006) examined the relationship between corporate social performance and stock returns. They used Composite/Aggregate Sustainability Score from EIRIS database as a proxy for corporate social performance; they discovered a negative relationship between the two variables. Wissink (2012) investigated the bi-directional relationship between corporate social performance and corporate financial performance in the Netherlands. In his findings, he observed that a positive bi-directional relationship existed between corporate social performance and corporate financial performance. In a related study, Norhasimah (2016) investigated the effect of environmental disclosure on financial performance in Malaysia using the Malaysian public limited companies. Using a sample of a sample of 100 companies, the study observed that there is a significant relationship between total environmental disclosure and profit margin.
In Nigeria, Asaolu et al. (2011) examined sustainability reporting in the Nigerian Oil and Gas sector using six major Oil and Gas multinational companies operating in Nigeria. Using content analysis form annual reports, he found that sustainability performance indicators were not present in any of the organizations sampled. Similarly, Kwaghfan (2015) in his study examined the impact of sustainability reporting on firm performance in Nigeria. He sampled 64 companies quoted on the Nigerian stock exchange for 2002-2012. He observed a positive relationship between sustainability reporting and ROA, ROE, EPS and net profit margin.
Based on the above literature, it was observed that all the prior studies reviewed basically looked at financial statement based indicators of performance like the ROA, ROE, EPS and profit margin except for Brammer, Brooks & Pavelin (2006). To this end, this study focused on the use market price of shares at year-end. This will make for a combination of market-based and financial statement based indicators of firm performance. The study also used the revenue-generating ability of a firm as a measure of its performance because a firm’s ability to generate revenue is important for a firm to remain a going concern and enables the firm to secure a ROE, EPS and profit margin based on the firm’s ability to manage the related cost.
Hypothesis Statement
Based on the mixed result from prior studies and the theoretical framework, the following hypotheses were stated in their null form:
H1: Firms with improved sustainability reporting do not have better firm performance.
H2: Firms with better performance do not have improved sustainability reporting.
Materials And Methods
An ex-post facto research approach was adopted in order to achieve the objectives of the study. This section refers to the modalities adopted in the development of the study. It includes the population, sample, data collection, measurement of the variables.
Sample Selection, Data Collection and Analysis
To achieve the objectives of the study, the study adopts the use of corporate annual reports and stand-alone sustainability reports published by firms in the banking industry for the period 2014-2016. The choice of this period is based on the fact that sustainability reports were consistently available for the sample firms within this time period. The study examined the banking industry with specific focus on quoted money deposit banks in Nigeria. Also, using the judgmental sampling technique and guided by the assumptions of Kerjice & Morgan as cited in (Uwuigbe, Olamide & Iyoha, 2015; Uwuigbe et al., 2016; Olubukunola et al., 2016) where they opined that a minimum of 5% of a defined population is considered as an adequate sample size required for generalization. Hence, a total of 10 banks were selected from the aforementioned industry (see Appendix 4 for list of banks). With the total sum of quoted money deposit banks numbering 16, the sample represents about 62.50% of the population. The chosen sample also comprises more than 50% market share in the industry. Content analysis was used to analyze the annual report for the purpose of this investigation. The Eviews statistical software was employed to analyze the data.
Development of Sustainability Disclosure Index
In order to offer guidance to corporations in preparing and reporting sustainability disclosures, several initiatives were launched. Of all the major reporting frameworks (initiatives) for reporting sustainability disclosures, Daizy & Das (2014), opined that
“The most exhaustive framework currently in use is that of Global Reporting Initiative (GRI)”.
Therefore, this study adopts the GRI framework for the purpose of developing the sustainability disclosure index. The GRI (Global Reporting Initiative), a framework for sustainability reporting highlights three (3) major pointers of sustainability performance, namely economic, environmental and social. In general, there are 79 indicators of GRI index shared into those 3 major categories. Though the GRI is criticized for not been industry-specific, there has been a development that has led to industry-specific disclosures for each industry. Hence, this study adopts the disclosures as specified in the G4 sector specific disclosures for financial services (GRI, 2013).
The study adopts an unweight sustainability disclosure index, as each indicator was be awarded 2 points for full disclosure, 1 and 0 points for partial reporting and for non-reporting of each indicator respectively (Munshia & Duttab, 2016). The Sustainability Disclosure Index (SDI) for each company was calculated by the sum the Total Disclosure Score (TDS) of the indicators, divided by the maximum scores possible (158). Therefore,
SDI=TD/M
Where, SDI=Sustainability Disclosure Index
TD=Total Disclosure Points of a Firm
M=Maximum Points for a Firm (158)
Model Specification and Variable Selection
To understand the link between sustainability reporting and firm performance, a panel regression technique will be adopted for this study to test the bi-directional relationship between the two variables. The regression will aid our understanding of the two-way relationship between sustainability reporting and firm performance. The following regression model was adopted from Daizy & Das (2014) the equation is implicitly expressed as
SDIit=f(ROAit, MPSit, BVPSit, EPSit, LogREVit) (1)
Where, i=denotes firm and t=time period
SDIit=depicting Sustainability Disclosure Index measured by GRI indicators of firm i at period t
ROAit=representing Return on Asset of firm i at period t
MPSit=representing the Market Price of firm i at the end of period t
BVPSit=depicting the Book Value per Share for firm i at the end of period t
EPSit=representing the Earning per Share of firm i at periodt
LogREVit=representing the natural log of Revenue of firmi at period t
In order to ensure that the model includes only the statistical significant regressors, a stepwise regression technique was adopted. We used Stepwise-Backwards procedure where all possible added variables are first included in the model. The variable with the highest p-value is first removed. The variable with the next highest p-value, given the removal of the first variable, is also removed. Next both of the removed variables are checked against the forward's p-value criterion. Any variable whose p-value is lower than the criterion is added back in to the model. The result of this section technique is shown in Table 1.
| Table 1: Stepwise Regression | ||||
| Dependent Variable: SDI | ||||
| Number of search regressors: 5 | ||||
| Selection method: Stepwise backwards | ||||
| Stopping criterion: t-stat forwards/backwards=1/1 | ||||
| Variable | Coefficient | Std. Error | t-Statistic | Prob.* |
|---|---|---|---|---|
| LogREV | 0.021533 | 0.003631 | 5.930449 | 0.0000 |
| BVPS | 0.011720 | 0.003962 | 2.958352 | 0.0064 |
| MPS | -0.007533 | 0.002753 | -2.735974 | 0.0109 |
| R-squared | 0.355251 | Mean dependent var | 0.341200 | |
| Adjusted R-squared | 0.307492 | S.D. dependent var | 0.110701 | |
| S.E. of regression | 0.092122 | Akaike info criterion | -1.836758 | |
| Sum squared resid | 0.229137 | Schwarz criterion | -1.696638 | |
| Log likelihood | 30.55136 | Hannan-Quinn criter. | -1.791932 | |
| Durbin-Watson stat | 1.107010 | |||
| Selection Summary | ||||
| Removed ROA | ||||
| Removed EPS | ||||
Source: Eviews output 2018
Hence, based on the variable selection criteria model 1 equation can be rewritten and expressed in its linear form as;
SDIit=β0+δt+β1MPSit+β2BVPSit+β3LogREVit+CONTit+?it (2)
Where, β0=Represents the firm-specific effects;
δt=Denotes the deterministic time trend;
?it =Denotes the estimated residual;
CONTit =Represents the control variable-natural log of total assets of firm i at period t.
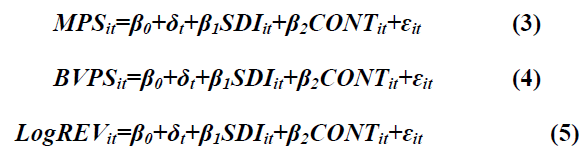
While model 2, 3, 4 and 5 examine sustainability reporting as a determinant of firm performance. Since, the regressors (firm performance variables) in model 1 which examines firm performance as a determinant of sustainability reporting have been selected, model 2, 3 and 4 examine sustainability reporting as a determinant of firm performance controlling for the size of the firms. The linear equation for model 2, 3 and 4 is expressed below as;
Empirical Results
Descriptive
The Table 2 above shows the descriptive statistics of the data used in the analysis for the study.
| Table 2: Descriptive Statistics | |||||
| N | Minimum | Maximum | Mean | Std. Deviation | |
|---|---|---|---|---|---|
| SDI | 30 | 0.196 | 0.620 | 0.34135 | 0.110713 |
| LogRev | 30 | 4.89 | 5.62 | 5.2308 | 0.23173 |
| MPS | 30 | 0.81 | 27.00 | 8.7090 | 8.00947 |
| BVPS | 30 | 3.08 | 22.40 | 11.7243 | 4.94029 |
| CONT | 30 | 2.90 | 3.68 | 3.2825 | 0.25593 |
| Valid N (listwise) | |||||
Source: Eviews output 2018
The Table 2 shows the descriptive statistics for sustainability disclosure index as a proxy for sustainability reporting, MPS BVPS and logRev as a proxy for firm performance and the natural logarithm of the total asset (SIZE) as the control variable. The table shows that a mean sustainability disclosure index of 34.13%, this means that Nigerian banks are still far behind in sustainability reporting practices based on the GRI framework and efforts should be made to improve sustainability reporting by banks in Nigeria. It also shows a standard deviation of 11.07% for the sample banks. This implies that there is a large variability in sustainability reporting among the sampled banks as the maximum statistic shows 62% and a minimum of 19.60% for sustainability reporting. Correspondently, LogRev MPS and BVPS show a mean distribution of 5.62, 8.70 and 11.72 respectively.
Regression Results
This study investigated the bi-directional relationship between the sustainability reporting and firm performance. Findings from this study as depicted in Table 3 show the Pearson correlation results for the variables used in the investigation. Table 4 shows the Hausman test, Tables 4 and 5 shows the random effect model results.
| Table 3: Pearson Correlation | |||||
| Pearson Correlation | SDI | MPS | BVPS | LogRev | LOGSIZ |
|---|---|---|---|---|---|
| SDI | 1 | ||||
| MPS | -0.120 | 1 | |||
| BVPS | 0.373* | 0.470** | 1 | ||
| LogRev | 0.487** | 0.277 | 0.688** | 1 | |
| CONT | 0.385* | 0.199 | 0.707** | 0.932** | 1 |
| *Correlation is significant at the 0.05 level (2-tailed). | |||||
| **Correlation is significant at the 0.01 level (2-tailed). | |||||
Source: Eviews output 2018
| Table 4: Hausman Test | ||||
| Correlated Random Effects-Hausman Test | ||||
| Equation: Untitled | ||||
| Test cross-section random effects | ||||
| Test Summary | Chi-Sq. Statistic | Chi-Sq. d.f. | Prob. | |
|---|---|---|---|---|
| Model 1 | Cross-section random | 2.332593 | 5 | 0.8015 |
| Model 2 | Cross-section random | 0.077702 | 2 | 0.9619 |
| Model 3 | Cross-section random | 0.306093 | 2 | 0.8581 |
| Model 4 | Cross-section random | 0.490131 | 2 | 0.7827 |
Source: Eviews output 2018
Table 2 (Pearson correlation table) is used to measure the direction and strength of a relationship amongst two variables. Thus, the correlation matrix as depicted in Table 2 indicates that a positive significant relationship exists between Revenue generation (LogRev) and sustainability disclosure index. This is evident as there is a correlation coefficient of 0.487 at 0.01 significance. In the same vein, Book Value per Share (BVPS) (Appendix 2) and size of the firm also show a positive correlation with sustainability reporting with a correlation coefficient of 0.373 and 0.385 at 0.05 significance Market Price per Share (MPS) show a negative relationship with sustainability reporting with a correlation coefficient of -0.120 respectively, however, this relationship is statistically insignificant.
The Hausman test rule is as follows:
1. If the P-value is statistically significant, accept the alternative hypothesis (Fixed Effect Model)
2. If the p-value is not statistically significant, accept the null hypothesis (Random Effect Model).
From the result below (Table 4), the study can deduce that the probability percentage for all the variables in Hausman test is above 5% (0.05) level of significance, which proves that random effect is a more appropriate selection for regression analysis with respect to the four models.
Tables 4 and 5 shows adjusted R square of 0.246 for model 1. This suggests that 25% variation in the dependent variable can be explained by the independent variables in model 1. Table 4 also shows an adjusted R square of 0.103 for model 2. This suggests that 10.30% variation in the dependent variable can be explained by the independent variables in model 2. Model 3 and 4 show an adjusted R square of 0.287 and 0.764 respectively, this suggests that 29% and 76% of the variation in the dependent variable can be explained by the independent variables in mode 3 and 4 respectively.
| Table 5: Random Effect Results For Model 1 | ||||
| Dependent Variable: SDI | ||||
| Total panel (balanced) observations: 30 | ||||
| Variable | Coefficient | Std. Error | t-Statistic | Prob. |
| MPS | -0.006704 | 0.003035 | -2.208913 | 0.0366 |
| BVPS | 0.006634 | 0.005270 | 1.258729 | 0.2198 |
| LogREV | 0.197024 | 0.114349 | 1.723002 | 0.0972 |
| CONT | -0.294512 | 0.217118 | -1.356464 | 0.1871 |
| C | -1.090582 | 0.834921 | -1.306210 | 0.2034 |
| Weighted Statistics | ||||
| R-squared | 0.364552 | Mean dependent var | 0.151582 | |
| Adjusted R-squared | 0.262880 | S.D. dependent var | 0.072003 | |
| S.E. of regression | 0.061819 | Sum squared resid | 0.095538 | |
| F-statistic | 3.585577 | Durbin-Watson stat | 1.338485 | |
| Prob(F-statistic) | 0.019201 | |||
| Unweighted Statistics | ||||
| R-squared | 0.441129 | Mean dependent var | 0.341200 | |
| Sum squared resid | 0.198616 | Durbin-Watson stat | 0.643838 | |
| *Significance@5% | ||||
Source: Eviews output 2018.
Test of Hypothesis and Discussions
Results, as shown in Tables 5 & 6, help to capture the relationship between the estimated variables. Findings relating to the first hypothesis which states that (firms with better performance do not have improved sustainability reporting) shows that of all the proxy used to capture firm performance, revenue generation (LogREV) as depicted in Table 5 shows a positive influence on sustainability reporting, although this relationship is not significant. This is evident with a t-value of 1.493223 and P-value>0.05 (Appendix 3). This outcome suggests that firms with better performance in terms of revenue generation are able to perform socially and disclose (report) more on sustainability issues. The BVPS also show a positive insignificant relationship with sustainability reporting.
| Table 6: Summary Of Random Effect Results For Models 2, 3 And 4 (See Appendix For Full Results) | |||||||||
| Dependent variable | MPS (2) | BVPS (3) | LogREV (4) | ||||||
|---|---|---|---|---|---|---|---|---|---|
| coefficient | T stat | Prob | coefficient | T stat | prob | coefficient | T stat | prob | |
| SDI | -18.84219 | -2.217813 | 0.0352* | 12.27958 | 1.85581 | 0.0744 | 0.671653 | 2.313740 | 0.0285* |
| CONT | 3.739248 | 0.509683 | 0.6144 | 13.41953 | 2.76483 | 0.0101 | 1.750230 | 8.728999 | 0.0000 |
| C | 2.865743 | 0.118555 | 0.9065 | -35.60901 | -2.24872 | 0.0329 | 6.070859 | 9.317954 | 0.0000 |
| Adjusted R2 | 0.102524 | 0.287173 | 0.764700 | ||||||
| F | 2.656413 | 6.841529 | 48.12351 | ||||||
| Prob | 0.088481 | 0.003948 | 0.000000 | ||||||
| Durbin-Watson stat | 1.784389 | 1.551037 | 0.611379 | ||||||
| *Significance@5% | |||||||||
Source: Eviews output 2018
Findings, as it relates to the Market Price per Share (MPS) (Table 4), show that a significant negative relationship exists between market price per share and sustainability reporting. This is evidenced in the t-statistics value of value of -1.612831 and a p-value<0.05. This outcome suggests that investors in the stock market, whose major interest or objective is to get a return on their investment, are basically not interested or have little or no regard for sustainability issues. Hence, they tend to believe that firms that disclose more sustainable information may have exhausted a substantial part of their return on sustainability performance. Thus, the decline in the demand for such company stocks which will eventually drive the market price of such firms down. Based on the results as depicted in Table 5, it is evident that firms that perform in terms of Market Price per Share (MPS) tend to disclose less sustainability information because they would invest less in sustainability issues. Consequently, instead of investing in sustainability issues, they would invest in improving shareholder return via increasing market price per share. Hence, on the basis of this result and argument, our null hypothesis is accepted. This is in consonance with the findings of Humphrey, Darren & Yaokan (2012); Aggarwal (2013); Oyewo (2014). However, it contradicts or differs with the findings of Ameer & Othman (2012); Pan et al. (2014).
Being a bi-directional study, findings, as it relates to hypothesis (2), shows that sustainability disclosure index as a proxy for sustainability reporting has no significant influence on all the performance proxies except revenue generation (LogREV) and Market Price per Share (MPS) (see Table 6 coefficient for model 2,3 and 4). The revenue generation (LogREV) shows a t-statistics value of 2.313740 and p-value<0.05. This result suggests although the revenue generating ability of the banks does not significantly influence the sustainability performance (sustainability reporting), sustainability reporting significantly influences the ability of a bank firm to generate revenue. This may be because sustainability reporting improves their corporate reputation and makes them a preferable business partners. This will, in the long run, bring about an improvement in the revenue generating capacity of the firms. The results from MPS model (2) shows that the model is statistically insignificant, hence, we make no inferences on that model (f stat 2.656413 and Prob. of 0.088481)
The results as depicted in Table 6 also showed that sustainability reporting has a positive relationship with book value per share, but this relationship is statistically insignificant. Based on this outcome, there is evidence that firms with improved sustainability reporting have better firm performance (in terms of revenue generation). Hence, the null hypothesis is rejected. This outcome, however, corroborates the findings of Orlitzky, Schmidt & Rynes (2003); Wissink (2012).
Conclusion
The study examined the bi-directional relationship between sustainability reporting and firm performance in quoted Deposit Money Banks (DMBs) in Nigeria. This was accomplished by examining the annual reports and stand-alone sustainability reports of these sampled banks for the period 2014-2016. The empirical findings show that there is a bi-directional relationship between sustainability reporting and firm performance of quoted Deposit Money Banks (DMBs) in Nigeria. This finding is in line with Wissink (2012); Dhaliwal et al. (2011). The study also observed that Market Price per Share (MPS) (Appendix 1) had a significant negative influence on sustainability reporting. However, the study observed that sustainability reporting had a significant positive impact on the revenue generation base of the sample firms. This results, therefore, confirms the proposition by legitimacy theory but did not confirm the proposition of slack resource theory. This outcome basically implies that sustainability performance via sustainability reporting will invariably bring about an improvement in the financial performance of quoted deposit money banks in Nigeria in terms of revenue generation ability. This result further suggests that reporting on sustainability issues will present the DMBs before as legitimate in the eyes of the society. Hence, making them is more attractive to customers, investors and business partners. Therefore, sustainability reporting by the Nigerian DMBs may see increased customer base, human capital growth and revenue growth of the selected banks over time. However, there is a need for the DMBs to note that sustainability may negatively affect the market price per share, but this may be based on the behavior of the market participants. Thus, the study suggests that Nigerian DMBs should improve their sustainability reporting so as to trigger their performance positively.
Further Studies
Considering the fact that only the quoted Deposit Money Banks (DMBs) in Nigeria were considered for this study is a major limitation. Hence, this study suggests that future research in this area could address this salient limitation by carrying out a comparative study of both listed and non-listed firms across all the sectors in the Nigerian economy.
Acknowledgement
Authors acknowledge Covenant University who has solely provided the plate form for this research and has also fully sponsored publication of this research work.
Appendix
| Appendix 1: Dependent Variable: Mps | ||||
| Method: Panel EGLS (Cross-section random effects) | ||||
| Cross-sections included: 10 | ||||
| Total panel (balanced) observations: 30 | ||||
| Swamy and Arora estimator of component variances | ||||
| Variable | Coefficient | Std. Error | t-Statistic | Prob. |
|---|---|---|---|---|
| SDI | -18.84219 | 8.495842 | -2.217813 | 0.0352 |
| LOGSIZ | 3.739248 | 7.336411 | 0.509683 | 0.6144 |
| C | 2.865743 | 24.17220 | 0.118555 | 0.9065 |
| Effects Specification | ||||
| S.D. | Rho | |||
| Cross-section random | 8.443841 | 0.9013 | ||
| Idiosyncratic random | 2.794879 | 0.0987 | ||
| Weight Statistics | ||||
| R-squared | 0.164418 | Mean dependent var | 1.634715 | |
| Adjusted R-squared | 0.102524 | S.D. dependent var | 2.870289 | |
| S.E. of regression | 2.719175 | Sum squared resid | 199.6356 | |
| F-statistic | 2.656413 | Durbin-Watson stat | 1.791106 | |
| Prob(F-statistic) | 0.088481 | |||
| Unweight Statistics | ||||
| R-squared | 0.052405 | Mean dependent var | 8.709000 | |
| Sum squared resid | 1762.904 | Durbin-Watson stat | 0.202829 | |
| Appendix 2: Dependent Variable: Bvps | ||||
| Method: Panel EGLS (Cross-section random effects) | ||||
| Cross-sections included: 10 | ||||
| Total panel (balanced) observations: 30 | ||||
| Swamy and Arora estimator of component variances | ||||
| Variable | Coefficient | Std. Error | t-Statistic | Prob. |
|---|---|---|---|---|
| SDI | 12.27958 | 6.616813 | 1.855815 | 0.0744 |
| LOGSIZ | 13.41953 | 4.853641 | 2.764837 | 0.0101 |
| C | -35.60901 | 15.83523 | -2.248721 | 0.0329 |
| Effects Specification | ||||
| S.D. | Rho | |||
| Cross-section random | 4.530083 | 0.8001 | ||
| Idiosyncratic random | 2.264333 | 0.1999 | ||
| Weight Statistics | ||||
| R-squared | 0.336333 | Mean dependent var | 3.500165 | |
| Adjusted R-squared | 0.287173 | S.D. dependent var | 2.596443 | |
| S.E. of regression | 2.192154 | Sum squared resid | 129.7495 | |
| F-statistic | 6.841529 | Durbin-Watson stat | 1.551037 | |
| Prob(F-statistic) | 0.003948 | |||
| Unweight Statistics | ||||
| R-squared | 0.424652 | Mean dependent var | 12.62367 | |
| Sum squared resid | 575.2591 | Durbin-Watson stat | 0.349836 | |
| Appendix 3: Dependent Variable: Logrev | ||||
| Method: Panel EGLS (Cross-section random effects) | ||||
| Cross-sections included: 10 | ||||
| Total panel (balanced) observations: 30 | ||||
| Swamy and Arora estimator of component variances | ||||
| Variable | Coefficient | Std. Error | t-Statistic | Prob. |
|---|---|---|---|---|
| SDI | 0.671653 | 0.290289 | 2.313740 | 0.0285 |
| LOGSIZ | 1.750230 | 0.200508 | 8.728999 | 0.0000 |
| C | 6.070859 | 0.651523 | 9.317954 | 0.0000 |
| Effects Specification | ||||
| S.D. | Rho | |||
| Cross-section random | 0.176511 | 0.7524 | ||
| Idiosyncratic random | 0.101256 | 0.2476 | ||
| Weight Statistics | ||||
| R-squared | 0.780928 | Mean dependent var | 3.786751 | |
| Adjusted R-squared | 0.764700 | S.D. dependent var | 0.202821 | |
| S.E. of regression | 0.098384 | Sum squared resid | 0.261342 | |
| F-statistic | 48.12351 | Durbin-Watson stat | 2.176170 | |
| Prob(F-statistic) | 0.000000 | |||
| Unweight Statistics | ||||
| R-squared | 0.887331 | Mean dependent var | 12.04428 | |
| Sum squared resid | 0.930234 | Durbin-Watson stat | 0.611379 | |
| Appendix 4: List Of Deposit Money Bank Sampled |
| ZENITH BANK PLC |
| FEDELITY BANK PLC |
| ACCESS BANK PLC |
| STERLING BANK PLC |
| FBN BANK PLC |
| GTB BANK PLC |
| DIAMOND BANK PLC |
| UNION BANK PLC |
| UBA BANK PLC |
| STANBIC BANK PLC |
References
- Aggarwal, P. (2013). Impact of sustainability performance of company on its financial performance: A study of listed Indian companies. Global Journal of Management and Business Research, 13(11), 61-70.
- Ahlström, J. & Ficeková, M. (2017). The relationship between current financial slack resources and future CSR performance. A quantitative study of public companies in the Nordic Markets. Umeå, Sweden.
- Akinlo, O.O. & Iredele, O.O. (2014). Corporate environmental disclosures and market value of quoted companies in Nigeria. The Business & Management Review, 5(3), 171-184.
- Al-Gamrh, B. & Al-Dharnari, R.A. (2016). Firm characteristic and corporate social responsibility. International Business Management, 10(8), 4283-4291.
- Ameer, R. & Othman, R. (2012). Sustainability practices and corporate financial performance: A study based on the top global corporations. Journal of Business Ethics, 108(1), 61-79.
- Asaolu, T.O., Agboola, A.A., Ayoola, T.J. & Salawu, M.K. (2011). Sustainability reporting in the Nigerian oil and gas sector. Proceedings of the Environmental Management Conference, Federal University of Agriculture, Abeokuta, Nigeria.
- Brammer, S., Brooks, C. & Pavelin, S. (2006). Corporate social performance and stock returns: UK evidence from disaggregate measures. Financial Management, 35(3), 95-116.
- Ching, H.Y., Gerab, F. & Toste, T.H. (2017). The quality of sustainability reports and corporate financial performance: Evidence from Brazilian listed companies. SAGE Open, 7(2), 1-9.
- Coopers & Lybrand (1993). Environmental management practices: A survey of major Australian organizations. Coopers & Lybrand Consultants, Sydney.
- Daizy & Das, N. (2014). Sustainability reporting framework: Comparative analysis of global reporting initiatives and dow jones sustainability index. International Journal of Science, Environment and Technology, 3(1), 55-66.
- Dembo, A.M. (2017). The impact of sustainability practices on the financial performance: Evidence from listed oil and gas companies in Nigeria. In N. Capaldi, S. Idowu & R. Schmidpeter (Eds.), Dimensional Corporate Governance. CSR, Sustainability, Ethics & Governance. Springer, Cham.
- Dhaliwal, D.S., Li, O.Z., Tsang, A. & Yang, Y.G. (2011). Voluntary nonfinancial disclosure and the cost of equity capital: The initiation of corporate social responsibility reporting. The Accounting Review, 86(1), 59-100.
- Garg, P. (2015). Impact of sustainability reporting on firm performance of companies in India. International Journal of Marketing and Business Communication, 4(3), 38-45.
- GRI (2011). Sustainability reporting guidelines, version 3.1.
- GRI (2013). The G4 sector specific disclosures for financial services.
- Humphrey, J., Darren, D.L. & Yaokan, S. (2012). The independent effects of environmental, social and governance initiatives on the performance of UK firms. Australian Journal of Management, 37(2), 1-33.
- Kwaghfan, A. (2015). Impact of sustainability reporting on corporate performance of selected quoted companies in Nigeria. University of Nigeria. Nsukka, Nigeria.
- Linsley, P.M. & Shrives, P.J. (2006). Risk reporting: A study of risk disclosures in the annual reports of UK companies. British Accounting Review, 38(4), 387-404.
- Mousa, G.A. & Hassan, N.T. (2015). Legitimacy theory and environmental practices: Short notes. International Journal of Business and Statistical Analysis, 2(1), 41-52.
- Munshia, D. & Duttab, S. (2016). Sustainability reporting quality of Indian and American manufacturing firms: A comparative analysis. Serbian Journal of Management, 11(2), 245-260.
- Norhasimah (2016). The effects of environmental disclosure on financial performance in Malaysia. Procedia Economics and Finance, 35(1), 117-126.
- Olayinka, M.U. & Temitope, O.F. (2011). CSR and financial performance: The Nigerian experience. Journal of Economic and Sustainability Development, 3(4), 44-54.
- Olubukunola, R.U., Uwuigbe, U., Iyoha, F. & Omankhanlen, A.E. (2016). Globalizing the board and financial performance: Evidence from Nigerian Banks. Indian Journal of Finance, 10(9), 66-79.
- Osariemen, A., Edosa, J.A., Uwuigbe, U. & Olubukunola, U. (2018). Audit committee attributes and audit quality: A benchmark analysis. Business: Theory and Practice.
- Orlitzky, M., Schmidt, F. & Rynes, S. (2003). Corporate social and financial performance: A meta-analysis. Organization Studies, 24(3), 403-441.
- Oyewo, B.M. (2014). Sustainable development reporting practices by Nigerian Banks. Mediterranean Journal of Social Sciences, 5(23), 2535-2544.
- Pan, X., Sha, J., Zhang, H. & Ke, W. (2014). Relationship between corporate social responsibility and financial performance in the mineral industry: Evidence from Chinese mineral firms. Sustainability, 6(7), 4077-4101.
- Shehata, N.F. (2014). Theories and determinants of voluntary disclosure. Accounting and Finance Research, 3(1), 18-26.
- Simnet, R., Vanstraelen, A. & Chua, W.F. (2009). Assurance on sustainability reports: An international comparison. Accounting Review, 84(3), 937-967.
- Surroca, J., Tribó, J.A. & Waddock, S. (2010). Corporate responsibility and financial performance: The role of intangible resources. Strategic Management Journal, 31(5), 463-490.
- Turban, D.B. & Greening, D.W. (1997). Corporate social performance and organizational attractiveness to prospective employees. Academic Management Journal, 40(3), 658-672.
- Utile, B.J. (2016). Effect of sustainability reporting on firm’s performance: A review of literature. International Journal of Business & Management, 4(7), 203-208.
- Uwuigbe, O.R. (2013). Corporate governance and share price: Evidence from listed firms in Nigeria. An International Multidisciplinary Journal, 7(2), 129-143.
- Uwuigbe, U. & Uadiale, O.M. (2011). Corporate social and environmental disclosure in Nigeria: A comparative study of the building material and brewery industry. International Journal of Business and Management, 6(2), 258.
- Uwuigbe, U., Olamide, O. & Iyoha, F. (2015). The effects of corporate governance mechanisms on firm’s dividend payout policy in Nigeria. Journal of Accounting and Auditing.
- Uwuigbe, U., Olubukunola, U. & Anijesushola, O.A. (2011). Corporate social responsibility disclosures by environmentally visible corporations: A study of selected firms in Nigeria. European Journal of Business and Management, 3(9), 9-17.
- Uwuigbe, U., Francis, K.E., Uwuigbe, O.R. & Ataiwrehe, C.M. (2016). International financial reporting standards adoption and accounting quality: Evidence from the Nigerian banking sector. Corporate Ownership & Control, 14(1), 287-294.
- Wissink, R.B.A. (2012). A test of the virtuous cycle of corporate social responsibility: Testing the relation between corporate social performance and corporate financial performance. University of Twente. Enschede, Netherlands.