Research Article: 2021 Vol: 20 Issue: 6S
The Effect of Earnings Management and Corporate Governance on the Likelihood of Equity Overvaluation
Intan Waheedah Othman, UiTM Shah Alam
Nur Aida Amir, UiTM Kampus Puncak Alam
Maslinawati Mohamad, UiTM Shah Alam
Eley Suzana Kasim, UiTM Shah Alam
Abstract
This study aims to empirically examine the effects of financial factors and corporate governance on the likelihood of equity overvaluation among the Malaysian public listed firms. Specifically, it explores the strategic roles of two common earnings management attributes of discretionary Accruals-Based Earnings Management (AEM) and Real Earnings Management (REM), and corporate governance elements of the board that include board independence and board size in determining the likelihood of firms’ equity overvaluation. The analysis was performed on 163 firm-year observations from the FTSE100 sample companies from 2016 to 2018. The univariate (Pearson correlation) and multivariate (logistic regression) statistical techniques were employed to test the hypotheses. Results show that firms are less likely to engage in REM in attaining equity overvaluation. Moreover, no evidence was found to support that firms engage in AEM practices in ensuring that firms are overvalued. Interestingly, board size is an important mechanism in mitigating the likelihood of equity overvaluation. The domination of a large synergetic pool of people with the necessary skills and expertise on the board makes the board independence attribute irrelevant in controlling firm’s overvaluation. Whilst the findings from this study provide useful insights to the regulators for enhancing the corporate governance regulation, it further creates awareness among investors in identifying firms that are at risk of being overvalued.
Keywords
Equity Overvaluation, Earnings Management, Corporate Governance, Public Listed Firms, Logistics Regression, Opportunistic Behaviour, Accrual-Based Earnings Management, Real Earnings Management
Introduction
Reported earnings and growth in earnings are essential factors in determining a firm’s value. When a firm is seen as having a high and attractive value, investors will be interested to invest in the company. Managers thus have a strong incentive to increase firm’s value as it is used to indicate a company’s success (or failure). As highlighted by Jensen (2005), the effort of attaining and sustaining overvaluation may lead to adverse effect, including the impact by which the difficulty in managing the set of organizational forces in motion, including earnings management, may end up with the destruction of firms’ core value in the long-term. Jensen (2005) states that overvaluation affects analyst expectations, and it could also prevent top management from reaching or exceeding earnings forecasts.
Previous studies have shown that Earnings Management (EM) has the potential to inflate firm value to sustain overvalued equity by artificially increasing expectations for earnings and earnings growth (Dechow, Richardson & Tuna, 2000). In particular, managers of overvalued firms have strong incentives to retain the firm’s overvalued equity, as this increases managers’ welfare with more lucrative stock options or rewards related to the performance of the company. Given these various incentives, there is a link between overvaluation and the likelihood of a firm continuing to engage in EM.
Chi & Gupta (2009) mentioned that regardless of the exact causes of overvaluation, over time, the overvalued equity price will decrease to the underlying value. This price decrease is inevitable as information about the fundamentals of the firm will be revealed eventually, and the opinions of investors on valuation will converge to the underlying value. However, any manager rarely desires a fall in the equity price for any reason. This happens because when equity prices rise, a manager has a lot to gain. This is evident, firstly, from stock-performance-based incentives, whereby the manager's wealth and compensation increase with the increase in stock price (Bergstresser & Philippon, 2006; Burns & Kedia, 2006). Secondly, job security for the manager increases as the stock prices increase when the stock performs well; a manager is less likely to lose the job (Weisbach, 1988). Thirdly, a strong performance in stocks increases the executive labour market value of the manager. If the equity price goes down, the opposite of all the above could happen. Motivated by these incentives, a manager would strive through earnings management for higher stock prices. Such manipulation can lead to the masking of earnings estimates, thereby causing overvaluation, which ultimately leads to investors making misleading investment decisions.
Managing earnings is acceptable when it is still within the GAAP’s requirement. However, past studies have shown that EM is one of the sources or root causes of accounting scandals. This is because some companies manage firms’ earnings by engaging in within GAAP EM practices, before moving to employ non-GAAP EM, hence the practice of egregious financial reporting. Enron and WorldCom are examples of some of the most notorious and severe corporate accounting scandals in the United States (Teh, San, Lau & Ying, 2017). Cotton (2002) reported that the market capitalization loss amounted to $460 billion which resulted from false financial reporting in five firms, namely Enron, WorldCom, Tyco, Quest, and Global Crossing. According to Felsted, Oakley& Agnew (2013), Tesco, which is a prominent public supermarket corporation in the United Kingdom, had an interim income overstatement of £250 million. It was, by default, 25 percent higher than the actual figure, thereby casting more notoriety on the credibility of reported financial statements.
In Malaysia, there were cases where companies have engaged in EM over the years to the point that they have not been able to cover their manipulation activities and eventually lead to aggressive EM and fraud. The Transmile Group Bhd, for example, had an overstatement of its group profits, which amounted to RM530 million between the financial periods 2005 and 2006, resulting in shareholders losing value in the prices of their shares. The firm was subsequently delisted from Bursa Malaysia on the grounds of employee discontent, reputation loss, and fall in the price of their shares (Teh et al., 2017) (PricewaterhouseCoopers, 2011). The Malaysian Securities Commission registered 17 cases of earnings fraud from 1996 to 2012. PwC also estimated that 48% of Malaysian businesses were victims of white-collar crime through their study, and only 25% were willing to improve their internal audit program and methodology (Teh et al., 2017). Additionally, the PwC survey revealed that the total fraud loss per business in Malaysia was US$ 173,303 for two years prior to the survey (Ung, Brahmana & Puah, 2014).
These cases, among others, highlighted that the managerial mishap behaviour in sustaining equity overvaluation involved opportunistic EM activities. Such reporting activities are performed to camouflage weak firm performance and make it appear favourable to the public. It is therefore clear that failure to address firm overvaluation may erode investors’ confidence in the quality and reliability of financial report, thus threatening shareholders’ investments in the capital market. Despite the need to prevent such practice, knowledge on the determinants of equity overvaluation among firms is still limited, particularly within the milieu of the Malaysian emerging economy. Therefore, this study seeks to examine the influencing factors towards equity overvaluation among the Malaysian publicly listed companies. More specifically, this study aims:
1. To test whether managers employ accrual-based earnings management as the determinant of equity overvaluation among the Malaysian listed firms.
2. To test whether managers employ real earnings management as the determinant of equity overvaluation among the Malaysian listed firms.
3. To examine whether board independence influences equity overvaluation among the Malaysian listed firms.
4. To examine whether board size influences equity overvaluation among the Malaysian listed firms.
Literature Review and Hypotheses Development
Accrual-Based Earnings Management and Equity Overvaluation
In line with the agency theory, managers of overvalued firms are likely to manage their earnings upwards to enhance overvaluation (Shiue, Lin & Liu, 2009). The manager’s opportunistic nature to manipulate financial performance may further increase information asymmetry, thus hindering the ability of shareholders to effectively monitor them. A study by Chi & Gupta (2009); Yang & Abeysekera (2019) found that overvaluation is related significantly to subsequent income-increasing EM. Coulton, Saune & Taylor (2015) further found that overvalued companies that are merely above the level-related earnings thresholds have higher unexpected accruals than companies with less extreme valuations. Prior studies have shown that managers are more likely to engage in accruals-based EM (AEM) at the early stage of overvaluation, and later resort to another EM mechanism (Yang & Abeysekera, 2019). This contrasts with the findings by Ali Ahmadi, Soroushyar & Naseri (2013) that show EM is not associated with the occurrences of earnings restatement. Based on the different views from prior research, the following hypothesis is proposed between AEM and equity overvaluation:
H1: There is a significant relationship between accrual-based earnings management and equity overvaluation among publicly listed firms in Malaysia.
Real Earnings Management and Equity Overvaluation
Managers may employ REM practices to positively influence reported earnings. Darmawan, et al., (2019) assert that managers are more inclined to adopting REM than AEM owing to the fact that REM is more difficult to be detected by regulators or auditors and makes achieving desired profit targets easier in the short term (Ferdawati, 2009). Badertscher (2011); Yang & Abeysekera (2019) document that the longer a company is overvalued, the greater the amount of total EM exhibited by the company. This can be seen when the company is initially engaged in AEM, however, at some point when they run out of AEM choices, they will resort to employing Real Earnings Management (REM). Companies tend to switch from one mechanism of EM to another to induce overvaluation, rather than relying on a single EM approach (Badertscher, 2011). However, REM is more costly than AEM from a cash flow point of view due to its negative implication on business operations and its ability to destroy long-term firm value (Rowchowdhury, 2006; Darmawan et al., 2019). Based on the above contention, the hypothesis is drawn up as follows:
H2: There is a significant relationship between real earnings management and equity overvaluation among publicly listed companies in Malaysia.
Board Independence and Equity Overvaluation
The MCCG 2017 provides clear guidance to the establishment of independent directors on the board for them to exercise adequate oversight function in overseeing governance, risk management and internal control, thus reducing agency conflict. Being independent, the directors can speak out on management misdeeds and defend shareholders' rights because they have no need to perform in order to gain management's good grace (Clarke, 2006). It is further argued that an independent board can enhance business operation efficiency and firm’s performance (Shiue et al., 2009). Studies have shown that the proportion of independent board members is negatively correlated to the possibility of accounting scandals (Dechow, Sloan & Sweeney, 1996) and financial restatement incidences (Zhizhong et al., 2011, Rakoto, 2012). However, contradicting findings were shown in other studies where board independence demonstrate insignificant relationship with financial restatement (Abdullah, Yusof & Nor, 2010; Wang et al., 2013). Based on the mixed findings of prior studies, the hypothesis is developed as follows:
H3: There is a significant relationship between board independence and equity overvaluation among publicly listed companies in Malaysia.
Board Size and Equity Overvaluation
Board size is an internal control mechanism that could help minimize the agency cost by reducing activities related to EM. Due to the diversity of experience and knowledge on the board, large boards are seen to enhance synergetic control, lowering the rate of earnings manipulation (Cao, Myers & Omer 2012). Large-sized board has more external connections, and an improved ability to extract crucial resources including expertise and fund capital in operating a business operation, both of which may contribute to improved firm performance. Studies have shown a significant negative impact of board size towards earnings management activities (Xie, Wallace & Dadalt, 2003). A large-sized board, on the other hand, may lead to issues like free-riding, coordination breakdown, and problems in reaching a consensus, resulting in ineffective supervision (Jensen, 1993; Garg, 2007; Wang et al., 2013). This is supported by Beasley (1996) where it is discovered that firms with larger boards are more likely to experience from cases of financial scandals. Firms with larger boards tend to be positively and significantly related to EM (Chin, Firth & Rui, 2006; Mansor et al., 2013) and financial restatement (Hasnan, 2017). Based on the contention and diverse findings of prior studies, the hypothesis is formulated as follows:
H4: There is a significant relationship between board size and equity overvaluation among publicly listed companies in Malaysia.
Data and Research Design
Figure 1 shows the research framework for this study. The framework illustrates the relationship between the independent variables and the dependent variables of this study. The independent variables comprise of accrual-based earnings management, real earnings management, board independence and board size, whereas the dependent variable is the equity overvaluation. Control variables such as firm size and leverage are included in the framework to control for the effect that it might have on equity overvaluation.

Figure 1: Research Framework
Sample Selection
Consistent with Yang & Abeysekera (2019); Coulton, Saune & Taylor (2015), the sample for this study focuses on the 100 top largest companies listed on Bursa Malaysia, known as The Financial Times Stock Exchange 100 Index (FTSE100). The FTSE100 sample adequately represents the whole population of PLCs in Malaysia (Jamal et al., 2013) as the companies are major contributors to the economy of Malaysia and are not limited to specific sectors.
Based on the initial sample of 300 firm-years observations that covers a 3-year period from 2016 to 2018, this study excludes 48 firm years firms from the financial services and utility sectors. The financial sector is excluded because financial institutions are separately regulated under the banking and financial institution Acts of 1989. Utility companies are also exempted as they are regulated heavily by the government and have specific earnings management opportunities and incentives (Peasnell, Pope, & Young, 2005). A further 89 firm-year observations with missing values and data with negative earnings were eliminated. The sample is finally reduced to 163 firm-years observation (Table 1).
| Table 1 Sample Selection |
|||
|---|---|---|---|
| Number of firm- years | Number of firm- years | Number of firm- years | |
| Equity overvaluation observations | 300 | 300 | |
| Less: | |||
| Financial services | (36) | (36) | |
| Utilities | (12) | (12) | |
| 252 | 252 | ||
| Missing observation and negative earnings | (89) | (89) | |
| Total number of observations | 163 | ||
Data Collection Method
For the 2016-2018 study period, the financial data of the sampled firms was collected from the Thomson Reuters Eikon database, whereas the corporate governance data were obtained based on a content analysis of the company annual reports.
Variables Measurement
Accruals-Based Earnings Management (AEM)
Following prior studies such as Chi & Gupta (2009), Habib et al., (2013), and Darmawan et al. (2019), this study applies the Modified Jones model (DAMJ) developed by Dechow et al. (1995) to measure discretionary accruals. The total accruals (TACC) can be decomposed into non–discretionary accruals (i.e. normal accruals) and discretionary accruals (i.e. abnormal accruals). However, the focus of detecting EM is on the discretionary accruals portion.
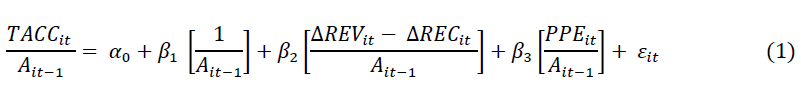
Where,
TACCit = Total accruals measured by net income before extraordinary items – net cash flows from operating activities, for firm i in year t
Ait-1 = Total asset for firm i in year t–1
?REVit = Change in company’s revenue from the preceding year for firm i.
?RECit = Change in company’s receivable from the preceding year for firm i.
PPEit = Fixed asset (property, plant and equipment) of firm i in year t.
Εit = Residual error (an unexplained component of total accruals) of firm i in year t.
The property, plant and equipment (PPE) and the change in revenue ?REV minus the change in trade receivables ?REC are included in the model to control for the non–discretionary accruals component caused by normal business activities. All variables are deflated by the prior year's total assets to reduce heteroscedasticity problem. The equation is regressed cross-sectionally for industry–years with at least 8 observations for each two-digit GICS industry and year, and the estimated residuals are the proxy for discretionary accruals (DACC) (Zang, 2012).
Real Earnings Management (REM)
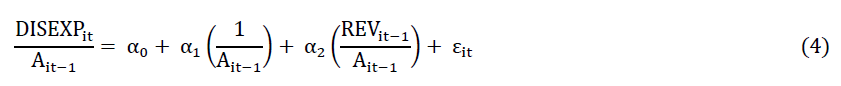
This study follows Rowchowdhury (2006) to measure real earnings management. It comprises of three measures namely (i) cash flow manipulation measured by Abnormal Operating Cash Flow (ACFO), (ii) production manipulation measured by abnormal production costs (APROD), and (iii) discretionary expenses manipulation measured by Abnormal Discretionary Expenditures (ADISEXP).
The abnormal operating cash flow ACFO is estimated based on Equation 2 by running a cross- sectional regression with at least 8 observations for each two-digit GICS industry and year. ACFO is the residual of the following equation:

The abnormal production costs APROD is estimated based on Equation 3 by running a cross- sectional regression for each two-digit GICS industry and year. PRODit represents the production cost and is defined as the sum of the cost of goods sold (COGS) and change in inventory (ΔINV) during the year. APROD is the residual of the following equation:

Similar to the previous REM metrices, the abnormal discretionary expenses ADISEXP are estimated based on Equation 4 by running a cross- sectional regression for each two-digit GICS industry and year. ADISEXP is the residual of the following equation:
In line with Cohen, Dey, & Lys (2008), the value for each component of REM is summed to align the relationship with real earnings management. A single variable, REM is estimated as follows:

Where,
?????????? = Net cash flow from operating activities for firm i in year t.
???????????? = COGS + ?Inventory for the year t
???????????????? = Discretionary expenses (sum of research and development, selling, general and administrative expenses for firm i in year t.
REM = A combined measure for real earnings management.
????????−1 = Total asset for firm i in year t-i.
?????????? = Total revenue of firm i in year t-i.
Δ?????????? = company’s revenue change from the preceding year for firm i.
???????????−1 = changes in firm revenue i in year t-i.
?????? = residual error (an unexplained component of total accruals) of firm i in year t.
The definition of variables used in this study is presented in Table 2.
| Table 2 Definition of Variables |
|||
|---|---|---|---|
| Variable | Code | Operationalisation | Source(s) |
| Equity Overvaluation | OV | The valuation of equity is measured by the average of lagged price earnings ratio and price book ratio (PEPB). OV is a dummy variable coded 1 for PEPB observations in the highest quartile and 0 otherwise. | Yang & Abeysekera, (2019) |
| Accrual-based Earning Management | DACC | Absolute value of abnormal discretionary accruals | Dechow, et al., (1995) |
| Real Earnings Management | REM | (ACFO*-1) + APROD + (ADISEXP*-1) | Roychowdhury (2006) |
| Board Independence | BIND | The number of non-executive directors divided by the total of board members | Shiue, et al., (2009); Abdullah, et al., (2010); Hasnan (2017) |
| Board Size | BSIZE | The total number of board member that comprises non-independent directors and independent directors | Shiue, et al., (2009), Koloub & Shoorvarzy (2015); Cornett, McNutt, & Tehranian (2009). |
| Size | FSIZE | Natural log of total assets | Vieira (2015); The, et al., (2017); Mansor, et al., (2013). |
| Leverage | LEV | Ratio of total liabilities to total assets | Mansor, et al., (2013); Wang, et al., (2013); Habib, et al., (2013). |
Regression Model
In testing the study hypotheses, the logistic regression model is used to empirically examine the influence of the financial and non-financial factors, and firm-specific characteristics on equity overvaluation occurrences. The empirical model is shown in Equation 6 below:

Findings and Discussion of Results
Table 3 presents the descriptive analysis of the continuous and dichotomous variables based on the 163 firm-year observations.
| Table 3 Descriptive Statistics |
||||||||
|---|---|---|---|---|---|---|---|---|
| Panel A - Continuous Variables | ||||||||
| Variables | N | Minimum | Maximum | Mean | Std. Deviation | |||
| DACC | 163 | -.153 | .180 | -.000 | .058 | |||
| REM | 163 | -.977 | 1.651 | .178 | .358 | |||
| BIND | 163 | .111 | 1 | .695 | .197 | |||
| BSIZE | 163 | 5 | 14 | 8.7 | 2.076 | |||
| FSIZE | 163 | 2.157 | 4.983 | 3.733 | .613 | |||
| LEV | 163 | .076 | .989 | .482 | .186 | |||
| Panel B - Dichotomous Variable | ||||||||
| Variable | Frequency of “1” | Frequency of “0” | Mean | |||||
| OV | 40 (24.5%) | 123 (75.5%) | .25 | |||||
Panel A, of Table 3 starts with the Discretionary Accruals (DACC) variable. The DACC value ranges from -0.153 to 0.180 which shows that FTSE100 companies engage in various EM strategies that include income-decreasing and income increasing EM practices. The average discretionary accrual is -.0003 with a standard deviation of 0.058. The negative value for the average discretionary accrual indicates that the average sample firms conduct income-decreasing accrual earnings management to obtain the desired reporting performance (Darmawan et al., 2019). The Real Earnings Management (REM) variable ranges from -0.977 to 1.651. In a similar manner, firms are seen to engage in a diverse REM strategy that involve income-increasing and income-decreasing REM practices. The mean of REM is 0.178 with a standard deviation of 0.358. The positive average value shows that the average sample firms conduct income-increasing real earnings management to attain an increase in profit and achieve the desired profit target (Darmawan et al., 2019).
The descriptive statistic for board independence (BIND) shows a value that ranges from 0.111 to 1. The average of BIND has a mean of 1 with standard deviation of 0.695. This indicates that the average firm has 100% independent directors sitting on the board, thus fulfilling the requirements of MCCG 2017 (Abdullah et al., 2010). As for board size (BSIZE), the number of board members ranges from 5 to 14 and has a mean of 8.7 with 2.076 standard deviation. Rahman & Ali (2006) documented relatively similar board size with a mean of 8.89, ranging from 5 to 15 members. Jensen (1983) suggests that the optimal board size is between seven to eight board members. This implies that the average board size for the sample firms is ideal.
Firm size (FSIZE) ranges from 2.157 to 4.983. In absolute value, firms’ total assets ranges from the smallest of RM 143.5 million to the largest of RM 96,141.4 million. The mean for firm size is 3.733 representing an average total asset is RM3.73 million. As for leverage (LEV), Table 3 shows that the leverage ratio ranges from .076 to .989 with a mean of .482 and standard deviation of .186. The mean is equivalent to 48.17% which indicates that almost half of the capital structure of the average firm comprises of long-term debt. Finally, the equity Overvaluation Variable (OV) shows a mean of .25 with 24.5% out of the total sample had overvalued their equity between 2016 to 2018.
Table 4 reports the correlation among OV, the independent variables and control variables. The aim is to draw attention to potential multicollinearity issue where the correlation coefficient exceeds 0.8, (Gujarati, 2011). Results of the correlation analysis show no multicollinearity problems as the correlations between the variables are seen to be comparatively low. The results from the Pearson correlation are solely indicative and may not be used to draw conclusion about the determinants of equity overvaluation.
| Table 4 Pearson Correlation Coefficient Matrix |
|||||||
|---|---|---|---|---|---|---|---|
| Variables | OV | DACC | REM | BIND | BSIZE | FSIZE | LEV |
| OV | 1 | ||||||
| DACC | .187* | 1 | |||||
| REM | -.314** | -.377** | 1 | ||||
| BIND | -.088 | -.112 | .237** | 1 | |||
| BSIZE | -.268** | -.034 | .067 | -.034 | 1 | ||
| FSIZE | .06 | .026 | -.149 | .351** | .379** | 1 | |
| LEV | -.03 | -.201* | .126 | .061 | .12 | .237** | 1 |
| Note: All p-values are two-tailed. * and ** denotes the 0.05 and 0.01 significance level respectively. | |||||||
Table 5 reports the result of the logistic regression analysis to test the hypotheses concerning the influencing financial and non-financial factors on the likelihood of equity overvaluation among listed companies in Malaysia. Results shows that two of the independent variables, namely, real earnings management and board size made a unique statistically significant contributions to the model, hence supporting H2 and H4.
| Table 5 Logistic Regression Analysis |
|||
|---|---|---|---|
| Variable | SE | P-value | Odd ratio(Exp(B)) |
| DACC | 3.951 | 0.264 | 82.278 |
| REM | 0.852* | 0.017 | 0.131 |
| BIND | 1.303 | 0.210 | 0.195 |
| BSIZE | 0.143** | 0.001 | 0.622 |
| FSIZE | 0.425* | 0.013 | 2.858 |
| LEV | 1.229 | 0.801 | 1.363 |
| (Constant) | 1.518 | 0.988 | 1.023 |
| Notes: All p-values are two-tailed. * and ** denotes the 0.05 and 0.01 significance level respectively.; n = 163, Dependent variable = OV | |||
A negative and significant relationship is documented between the REM variable and the likelihood of equity overvaluation at the 5% level. The result indicates that firms with equity overvaluation are less likely to engage real earnings management activities. This is consistent with the contention that the impact that REM practices may cause on the firms’ future cash flow may be relatively destructive (Graham, Harvey & Rajgopal, 2005). Due to the long-term adversarial impact, firms may have avoided REM despite the fact that such practices can possibly accelerate firm’s profit in the short term. With respect to BSIZE variable, the result shows a negative and significant relationship with the likelihood of equity overvaluation at 1% level. The inverse relationship implies that firms with large board size are less likely to have their equity overvalued. The result is consistent with Kalsie & Shrivastav (2016) that larger board perform more effective monitoring compared to small-sized board. This is possible as larger board size brings in larger group of people with a variety of expertise and knowledge, rendering them to be more synergetic in carrying out their monitoring duties effectively.
The control variable, Firm Size (FSIZE), shows a positive and significant relationship to the likelihood of equity overvaluation at the 5% level. The results indicate that large firm are more likely to have their equity overvalued. This is possibly due to larger firms receive greater amount of attention among sophisticated investors, hence the desire that firms maintain high firm value. Moreover, large firms are commonly associated with more prestigious reputation and image, thus to maintain this established status, firms are more likely to ensure a high valuation of its equity. Other variables that include DACC, BIND and LEV demonstrate and insignificant relationship with the likelihood of equity overvaluation. The insignificant relationship between discretionary accruals and equity overvaluation indicates no evidence of firms employing accruals-based earnings management practices in ensuring that equity is highly valued. This might be due to the managerial awareness of the adversarial implication of engaging in opportunistic AEM practices towards firm value in the long run.
Furthermore, the insignificant impact of the BIND variable implies that being independent does not significantly influence their monitoring duties in minimizing the incidence of equity overvaluation. The result is consistent with prior study by Abdullah, et al., (2010) who documented an insignificant association between board independence and financial restatement in Malaysia. It is argued that firms merely abide by the MCCG requirement in form rather than substance, which thus lead to such insignificant finding. The fact that the independent directors primarily serve in providing independent views to the board rather than serving as a monitoring mechanism in overseeing the management might be another reason which could have led to the insignificant finding.
There is also no evidence to support that firm leverage is significantly related to equity overvaluation. Shirzad & Haghighi (2015) contend that firms with financial leverage are less likely to manage their earnings due to the close scrutiny by their creditors. As such, the low probability of earnings management practices among leveraged firms might have led to the insignificant impact of leverage towards the occurrence of equity overvaluation. Table 6 shows the summary of the hypotheses results as follows:
| Table 6 Summary of The Hypotheses Results |
||
|---|---|---|
| Hypotheses | Result | |
| H1 | There is a significant relationship between accrual- based earnings management and equity overvaluation among publicly listed companies in Malaysia. | Rejected |
| H2 | There is a significant relationship between realearnings management and equity overvaluation among publicly listed companies in Malaysia. | Supported |
| H3 | There is a significant relationship between board independence and equity overvaluation among publiclylisted companies in Malaysia. | Rejected |
| H4 | There is a significant relationship between board size and equity overvaluation among publicly listed companies inMalaysia. | Supported |
Conclusion
A main concern of overvaluation firms is when the management is capable of opportunistically managing earnings to continue reporting a favorable firm performance while masking their business uncertainty and ensuring that equity is highly valued. Firms that are overvalued will face a harmful impact in their long-term performance when the firm cannot beat the market expectations. Whilst a fall in share price is undesirable, managers will strive to manage earnings for higher stock prices and sustain equity overvaluation. With such manipulation and overvaluation, investors might be misled, hence causing them to make an inaccurate misleading investment decision and suffer from substantial loss.
Based on the above problem, it is the main objective of the study to examine the influencing factor towards equity overvaluation among the Malaysian listed companies This study examines the financial and corporate governance determinants among 84 out of 100 largest companies listed in Bursa Malaysia with a total of 163 firm-years observation covering a period from 2016 to 2018. The logistic regression analysis was conducted to examine the study’s four hypotheses.
The results show that firms are less likely to engage in REM in attaining equity overvaluation. In Malaysia, with the pervasive family firms among top large listed firms, REM may appear unattractive as such practices can be damaging to the firm’s long-term underlying value hence detrimental to the long-term firm survival for the family’s future generation. Results further reveal of no evidence to support that firms engage in AEM practices in ensuring that firms are overvalued. Interestingly, board size is an important mechanism in mitigating the likelihood of equity overvaluation. The domination of a large synergetic pool of people with the necessary skills and expertise on the board makes board independence irrelevant in controlling firm’s overvaluation. Large-size firms were also discovered to be under pressure to sustain equity overvaluation due to close scrutiny among the various stakeholders. This study contributes to the growing body of knowledge dealing with the influencing factors on the likelihood of equity overvaluation from the lens of an emerging economy of Malaysia. Findings of the study further assist in creating awareness among the investors for them to make the right decision, hence minimizing their risk of investment in overvalued companies.
Nevertheless, the limitation of this study can be seen through the data-gathering process. The sample chosen could not represent the entire situation or the current state of the economic performance of PLC in Malaysia alone. This is because the sample size used in this study is measured from 100 largest companies over the span of three consecutive years, from 2016 to 2018, which equates to 300 firm-years and had been reduced to 163 firm-years due to missing values and information in a data stream and annual report. Future research could examine what causes firms to become overvalued, including the regulators’ role, management’s expectation, governance mechanisms, political connection, firm’s ownership, and other constraints on earnings management mechanisms (Yang & Abeysekera, 2019).
References
- Abdullah, S.N., Yusof, N.Z.M., & Nor, M.N.M. (2010). Financial restatements and corporate governance among Malaysian listed companies. Managerial Auditing Journal, 25(6), 526–552.
- Ali Ahmadi, S., Soroushyar, A., & Naseri, H. (2013). A study on the effect of earnings management on restatement and the changes on information content of earnings following restatements: Evidence from Tehran Stock Exchange. Management Science Letters, 3, 2867–2876.
- Badertscher, B.A. (2011). Overvaluation and the choice of alternative earnings management mechanisms. Accounting Review, 86(5), 1491–1518.
- Beasley, M. (1996). An Empirical Analysis of the Relation Between the Board of Director Composition and Financial Statement Fraud. The Accounting Review, 71(4) 443–464.
- Bergstresser, D., & Philippon, T. (2006). CEO incentives and earnings management. Journal of Financial Economics, 80(3), 511–529.
- Burns, N., & Kedia, S. (2006). The impact of performance-based compensation on misreporting. Journal of Financial Economics, 79(1), 35–67.
- Cao, Y., Myers, L. a. and Omer, T.C. (2012) Does company reputation matter for financial reporting quality? Evidence from restatements. Contemporary Accounting Research, 29(3), 956–990.
- Chi, J., (Daniel), & Gupta, M. (2009). Overvaluation and earnings management. Journal of Banking and Finance, 33(9), 1652–1663.
- Cohen, D.A., Dey, A., & Lys, T.Z. (2008). Real and accrual-based earnings management in the pre- and post-sarbanes-oxley periods. The Accounting Review, 83(3), 757–787.
- Cornett, M.M., McNutt, J.J., & Tehranian, H. (2009). Corporate governance and earnings management at large U.S. bank holding companies. Journal of Corporate Finance, 15 (4), 412–430.
- Cotton, D.L. (2002). Fixing CPA ethics can be an inside job. Washington Post 2002 October 20, B2.
- Coulton, J.J., Saune, N., & Taylor, S.L. (2015). Overvalued equity, benchmark beating and unexpected accruals. Accounting and Finance, 55(4), 989–1014.
- Darmawan, I.P.E., T, S., & Mardiati, E. (2019). Accrual earnings management and real earnings management: Increase or destroy firm value? International Journal of Multicultural and Multireligious Understanding, 6(2), 8.
- Dechow, P.M., Richardson, S.A., & Tuna, A.I. (2000). Are Benchmark Beaters Doing Anything Wrong? SSRN Electronic Journal, (734).
- Dechow, P.M., Sloan, R.G., & Sweeney, A.P. (1996). Causes and consequences of earnings manipulation: An analysis of firms subject to enforcement actions by the SEC. Contemporary Accounting Research, 13(1), 1–36.
- Dechow, P.M., Sloan, R.G., & Sweeney, A. P. (1995), Detecting earnings management. The Accounting Review, 70(2), 193-225.
- Fama, E.F., & Jensen, M.C. (1983). Separation of ownership and control. Journal of Law & Economics, 26(2), 301–326.
- Felsted, A., Oakley, D., & Agnew, H. (2013). Tesco in turmoil after profits overstatement. Financial Times, September 22.
- Ferdawati (2009). Effect of real earnings management on firm value. Journal of Accounting & Management, 4(1), 57-74.
- Firth, M., Fung, P.M.Y., & Rui, O.M. (2006). Ownership, board structure, and the informativeness of earnings - Evidence from an emerging market (January 2006). 1-37. Available at SSRN 976581.
- Garg, A.K. (2007). Influence of board size and independence on firm performance: A study of Indian companies. Vikalpa, 32(3), 39–60.
- Graham, J.R., Harvey, C.R., & Rajgopal, S. (2005). The economic implications of corporate financial reporting. Journal of Accounting and Economics, 40(1–3), 3– 73.
- Gujarati, D. N. (2011). Basic Econometrics, McGraw-Hill Publications, New York.
- Habib, A., Gong, R., & Hossain, M. (2013). Overvalued equities and audit fees: A research note. Managerial Auditing Journal, 28(8), 755–776.
- Hasnan, S. (2017). Board of Directors’ Characteristics and Financial Restatement. Journal of Muamalat and Islamic Finance Research, 14(1), 1–22.
- Jamal, A., Geetha, C., Mohidin, R., Karim, M., Sang, L., & Ch?ng, Y. (2013). Capital structure decisions: Evidence from large capitalised companies in Malaysia. International Journal of Contemporary Research in Business, 5(5), 30–49.
- Jensen, M. C. (1993). The modern industrial revolution, exit, and the failure of internal control systems. The Journal of Finance, 48(3), 831–880.
- Jensen, M. C. (2005). Agency costs of overvalued equity. Financial Management, 34(1), 5–19.
- Kalsie, A., & Shrivastav, S.M. (2016). Analysis of board size and firm performance: Evidence from NSE companies using panel data approach. Indian Journal of Corporate Governance, 9(2), 148–172.
- Koloub, M., & Shoorvarzy, M.R. (2015). The effect of board composition and CEO’s overconfidence in earnings on restatement of financial statements. European Online Journal of Natural and Social Sciences, 4(1), 1211–1218.
- Mansor, N., Che-Ahmad, A., Ahmad-Zaluki, N.A., & Osman, A.H. (2013). Corporate governance and earnings management: A study on the Malaysian family and non-family owned PLCs. Procedia Economics and Finance, 7(ICEBR), 221–229.
- MCCG. (2017). The Malaysian Governance 2017 Code on Corporate Client Update: Malaysia.
- Peasnell, K.V., Pope, P.F., & Young, S. (2005). Board monitoring and earnings management: Do outside directors influence abnormal accruals? Journal of Business Finance and Accounting, 32(7–8), 1311–1346.
- Pricewaterhouse Coopers. (2011). Global Economic Survey 2005. Halle, Germany: Martin-Luther-University and PricewaterhouseCoopers Int.
- Rahman, R.A., & Mohamed Ali, F.H. (2006). Board, audit committee, culture and earnings management: Malaysian evidence. Managerial Auditing Journal, 21(7), 783–804.
- Rakoto, P. (2012). Corporate governance, excessive stock option compensation and earnings restatement: Evidence from Canada. Paper presented at 2nd Annual International Conference on Accounting and Finance (AF2012), 1- 6.
- Roychowdhury, S. (2006) Earnings management through real activities manipulation. Journal of Accounting and Economics, 42, 335-370.
- Shirzad, A., & Haghighi, R. (2015). The effect of corporative leverage on earnings management in drug industry. Research Journal of Finance and Accounting, 6(17), 119-124.
- Shiue, M.J., Lin, C.J., & Liu, Y.P. (2009). Board characteristics and overvalued equity: Evidence from Taiwan. International Research Journal of Finance and Economics, 32(32), 104–113.
- Teh, B.H., San, T., Lau, O., & Ying, Y. (2017). Earnings management in Malaysian Public Listed Family Firms (Pengurusan pendapatan di firma keluarga tersenarai di Malaysia). Jurnal Pengurusan, 51, 183–193.
- Ung, L.-J., Brahmana, R., & Puah, C. (2014). Earnings management, ownership expropriation and brokerage fee of Malaysian property companies. MPRA Paper No. 63427, posted 26 May 2015. Available online at https://mpra.ub.uni-muenchen.de/63427/
- Vieira, E.F.S. (2015). Board of directors characteristics and performance in family firms under crisis. Proceedings of the 4th Virtual International Conference on Advanced Research in Scientific Areas, 4 (December 2015), 107–116.
- Wang, T.S., Lin, Y.M., & Chao, C.F. (2013). Board independence, executive compensation and restatement. Applied Financial Economics, 23(11), 963–975.
- Weisbach, M. (1988). Outside directors and CEO turnover. Journal of Financial Economics, 20(1-2) 431- 460.
- Xie, B., Davidson, W.N., & DaDalt, P.J. (2003). Earnings management and corporate governance: The role of the board and the audit committee. Journal of Corporate Finance, 9(3), 295-316.
- Yang, Y., & Abeysekera, I. (2019). Duration of equity overvaluation and managers’ choice to use aggressive underlying earnings disclosure and accrual-based earnings management: Australian evidence. Journal of Contemporary Accounting and Economics, 15(2), 167–185.
- Zang, A.Y. (2012). Evidence on the trade-off between real activities manipulation and accrual-based earnings management. Accounting Review, 87(2), 675–703.
- Zhizhong, H., Juan, Z., Yanzhi, S., & Wenli, X. (2011). Does corporate governance affect restatement of financial reporting? Evidence from China. Nankai Business Review International, 2(3), 289–302.