Research Article: 2017 Vol: 16 Issue: 3
The Effect of Relationship and Competitive Strategy on Business Performance of Rattan Industry in Java
Dwi Suryatini, Universitas Padjadjaran
Ina Primiana, Universitas Padjadjaran
Umi Kaltum, Universitas Padjadjaran
Yudi Azis, Universitas Padjadjaran
Keywords
Relationship, Competitive Strategy, Business Performance.
Introduction
Research Background
Rattan industry is one sector in the processing industry in Indonesia, which is during January-December 2015 non-oil exports of processing industry products contributed to 70.97%. Here Table 1 shows the FOB Value (million US$) of Indonesian export by sector and percentage of change.
| Table 1 Fob (Juta Us$) Value of Indonesian Export Sector and Percentage of Change |
||||
| Description | January-December, 2014 | January-December, 2015 | % Change | Role % |
| Total export | 175.980 | 150.2525 | -14.62 | 100% |
| Oil | 30.0188 | 18.5519 | -38.20 | 12.35 |
| Non-oil | 145.9612 | 131.7006 | -9.77 | 87.65 |
| Agriculture | 5.7706 | 5.6293 | -2.45 | 3.75 |
| Processing Industry | 117.3300 | 106.6368 | -9.11 | 70.97 |
| Mining and others | 22.860 | 19.4345 | -14.99 | 12.93 |
Source: Berita Resmi Statistic No.06/01/Th. XIX, 15 January 2016, p. 5
The production growth of large and medium manufacturing industries in the first quarter of 2015 decreased by 0.71 percent (q-to-q) against the fourth quarter-2014. The types of industries that experienced a decrease in production were non-metallic minerals down 6.64 percent, the electrical equipment industry fell 4.74 percent and the wood industry and cork goods (excluding furniture) and wickerwork from bamboo, rattan down 4.38 percent.
China dominates the export value of rattan furniture products to Japan in the period 2011 to 2013 (ITPC, OSAKA, 2014), as seen in Table 2 below.
| Table 2 Export of Rattan Furniture to Japan for the Period 2013-2015 (In Million Dollars) |
|||
| Negara | 2013 | 2014 | 2015 |
| Cina | 5.701.07 | 5.798.25 | 5.822.01 |
| Vietnam | 577.79 | 582.15 | 594.79 |
| Taiwan | 472.92 | 476.92 | 491.92 |
| Thailand | 466.49 | 475.68 | 487.49 |
| Indonesia | 450.93 | 461.50 | 465.93 |
Table 2 shows that Indonesia ranks fifth of rattan furniture exporting country to Japan, which is the first order is occupied by China. While the export of rattan products is still dominated by large companies, whereas they are vulnerable to the world economic crisis. Therefore the potential of small-scale enterprises to be a mainstay sector for Indonesia. The existence of small business craftsmen from rattan goods most widely spread on the island of Java. Small rattan craft industry in Java still dominates compared to other provinces in Indonesia, but the decline from 2014 to 2015 is very significant, therefore small rattan craft industry in Java becomes interesting to be studied.
Small-scale rattan-based furniture in Java is still experiencing difficulties in expanding their business, especially in facing competition in the global market. There is even a decline in export value over the last three years, while China's toughest competitor has increased by 20.72% market share, while Indonesia as the owner of Rattan raw material is only 7.68%. This can be seen in Table 3 below.
| Table 3 Business Performance of Small-Scale Rattan Furniture in Java Island (In Thousands of Rupiah) |
||||
| Year | 2012 | 2013 | 2014 | 2015 |
| Export Value | 1.015.008.140 | 722.370.745 | 292.637.395 | 255.879.365 |
| Market Share | 7.68% | 7.54% | 6.98% | 6.27% |
Source: Ministry of Industry, 2016
Based on Table 3 above, it appears that the decline in the value of sales and market share is an indication of the tendency of the business performance of small-scale rattan furniture on the Java Island is relatively decreased. David (2013) describes the financial ratios used to evaluate strategies consisting of: Return on Investment (ROI), Return on Equity (ROE), Profit Margin, Market Share and Debt to Equity, Earnings per share, Sales growth and Assets growth. In addition, in the opinion of Wheelen et al. (2015) performance related to profitability, market share and cost reduction.
The alleged aspect related to the decline in the performance of small-scale rattan furniture business in Java is due to the fact that the competing strategy has not been formulated precisely. Their business in Java Island is in the position of weak-moderate strength. The national rattan processing industry has difficulty in obtaining raw materials caused by the existence of the export policy of rattan raw materials and the rampant smuggling of rattan abroad. In addition, the production of mastery of finishing technology is still behind and the design of processed rattan products is still determined by the buyer from overseas (job order). On the other hand, there is still weak market intelligence, resulting in limited export market information. (http://www.kemenperin.go.id/artikel/471/Development-Industry-Processing-Rotan-Indonesia).
On the other hand, Wheelen et al. (2015) argue for a generic strategy that aims to outperform other companies in an industry, including: cost leadership, differentiation and focus.
In addition to issues related to competitive strategy, the rattan furniture industry in Java Island is also faced with the problem related to business relationship including the access to funding. Business relationships are not built well. Conceptually, based on Hubbard & Beamish's opinion (2011) the cooperation made by two or more organizations aims to secure a competitive advantage. The broader concept of relationship is developed by Cravens & Piercy (2013), who argue that the relationship is an effort to collaborate with stakeholders, including vertical relationships consisting of relationships with suppliers and customers and horizontal relationships consisting of lateral partnerships And internal.
Based on this background, the authors are interested to examine the influence of relationship and competitive strategy on the performance of the rattan industry in Java.
Research Goal
Based on the above description, this study aims to examine the influence of relationship and competitive strategy on the business Performance of rattan industry in Java.
Literature Review
Relationship
Kotler & Keller (2012) argue:
1. Basic Marketing: The salesperson simply the product.
2. Reactive Marketing: The salesperson sells the product and encourages the customer to call if he or she has questions, comments or complaints.
3. Accountable Marketing: The salesperson phones the customer to check whether the product is meeting expectations. The salesperson also asks the customer for any product or service improvement suggestions and specific disappointments.
4. Proactive Marketing: The salesperson contacts the customer from time to time with suggestions about improved product uses or new product.
5. Partnership Marketing: The Company works continuously with its large customers to help improve their performance. (General Electric, for example, has stationed engineer’s at large utilities to help them produce more power).
The broader concept of relationship is developed by Cravens & Piercy (2013), who argue that the relationship is an effort to collaborate with stakeholders, including vertical relationships consisting of relationships with suppliers and customers and horizontal relationships consisting of lateral partnerships and internal.
In this study, the relationship is measured by dimension refers to the opinion of Cravens & Piercy (2013) which includes internal relationship, supplier relationship, customer relationship and lateral relationship.
Competitive Strategy
Wheelen et al. (2015) argues for a generic strategy that aims to outperform other companies in an industry, including: Cost leadership, Differentiation and Focus. Pearce & Robinson (2015) add Speed-based strategies as an effort to achieve competitive advantage, which is a business strategy built on aspects of functional capabilities and activities that enable the company to be faster than its main competitor in meeting customer needs either directly or indirectly. On the other hand, Hitt, Ireland, Hoskisson (2015) argue that firms can choose five business strategies to build and maintain their strategic position against competitors: cost leadership, differentiation, cost leadership focus, differentiation focus, cost leadership/integrated differentiation.
In this study competitive strategy is measured by the dimensions of cost leadership strategy, differentiation strategy and speed strategy.
Business Performance
Hassab Elnaby, Hwang & Vonderembse (2012) measure performance by financial performance (Return on Assets/ROA) and nonfinancial performance (Quality). Best (2009) states that business performance is the output or outcome of the application of all activities related to business activities. Eikebrokk & Olsen (2009) measure e-business performance by efficiency, complementarities, lock-in and novelty.
Measurement of business performance by Ainin et al. (2007) through business net profit. Vanderstraeten & Matthyssens (2010) measure business performance through growth. While Najib & Kiminami (2011) operationalize business performance through three measures of sales volume, profitability and market share.
In this study, business performance is measured by using dimensions of sales volume, profitability and market share.
Previous Research
Previous research has noted the effects of relationship and competitive strategy on business performance. Najib & Kiminami (2011) indicate that the cooperation significantly associated with SME innovation that significantly influences business performance. La Forgia & Harding (2015) show that public or private or partnerships have an impact on company performance. Teeratansirikool et al. (2013) indicates that competitive strategies improve company performance positively and significantly through performance measurement. Abidin, Adros & Hassan (2014) found that strategies provided positive improvements in a number of projects being addressed. Daneshvar & Ramesh (2012) found that information technology (IT) can help companies to adopt cost reduction strategies through reduced staff costs. The IT strategy contributes significantly to improving profitability and products.
Based on the above description, then prepared the research hypothesis that is:
H1: Relationship and competitive strategy have a positive effect on the business performance of the rattan industry in the island of Java either simultaneously or partially.
Methodology
The research approach used in this research is quantitative. This is a verification study to test the hypothesis that has been formulated. The unit of analysis is small business of Rattan furniture in Java Island. Time horizon in this research is cross sectional in 2017. The population in this research is small business of Rattan furniture in Java Island covering Surabaya, Sidoarjo, Gresik, Jepara, Kudus, Semarang, Sukoharjo, Jogjakarta, Cirebon & Majalengka. The sampling technique is done by Simple Random Sampling, where data is processed with Partial Least Square (PLS).
Results and Discussion
Pls Results
Goodness of Fit-Outer and Inner Model
Inner Model: The analysis of structural model (inner model) shows the relationship between latent variables. Inner model is evaluated by using the value of R Square on endogenous constructs and Prediction relevance (Q square) or known as Stone-Geisser's used to know the capability of prediction with blindfolding procedure. Refer to Chin (1998), the value of R square amounted to 0.67 (strong), 0.33 (medium) and 0.19 (weak) and Prediction relevance (Q square) 0.02 (minor), 0.15 (medium) and 0.35 (large).
The Table 4 show that R2 of Business Performance as endogenous variable is in the medium criteria (>0.33) and the value of Q square in the large criteria (>0.35), so that can be concluded that the research model is supported by empirical condition or the model is fit.
Outer Model: Analysis of measurement model (outer model) is used as validity and reliability test to measure latent variable and indicator in measuring dimension that is a construct. It is can be explained by the value of Cronbachs Alpha that is to see the reliability of dimension in measuring variables. If the value of Cronbachs Alpha bigger that 0.70 (Nunnaly, 1994), it show that the dimensions and indicators as reliable in measuring variables. Table 4 shows that Composite reliability and Cronbachs Alpha of variables> 0.70 indicate that all of variables in the model estimated fulfil the criteria of discriminant validity. Then, it can be concluded that all of variables has a good reliability.
| Table 4 Test of Outer and Inner Model |
||||
| Variable | R Square | Cronbachs Alpha | Composite Reliability | Q square |
| Business Performance | 0.592 | 0.969 | 0.979 | 0.924 |
| Competitive Strategy | 0.969 | 0.974 | 0.832 | |
| Relationship | 0.903 | 0.921 | 0.562 | |
The Table 5 shows the result of measurement model for each dimension on indicator.
| Table 5 Loading Factor of Latent Variable-Dimension-Indicator |
|||
| Variable-Dimension | Indicator-Dimension | l | t-value |
| Relationship->Internal | 0.870 | 47.006* | |
| X11<-X1 | 0.969 | 235.214* | |
| X12<-X1 | 0.970 | 245.766* | |
| Relationship->Supplier | 0.785 | 26.158* | |
| X21<-X2 | 0.970 | 238.360* | |
| X22<-X2 | 0.963 | 169.726* | |
| Relationship->Customer | 0.863 | 38.445* | |
| X31<-X3 | 1.000 | - | |
| Relationship->Lateral | 0.706 | 11.268* | |
| X41<-X4 | 0.923 | 96.606* | |
| X42<-X4 | 0.942 | 129.820* | |
| X43<-X4 | 0.956 | 137.130* | |
| X44<-X4 | 0.956 | 222.226* | |
| Competitive Strategy->Cost Leadership Strategy | 0.965 | 157.810* | |
| X51<-X5 | 0.944 | 125.983* | |
| X52<-X5 | 0.945 | 124.852* | |
| Competitive Strategy->Differentiation Strategy | 0.956 | 152.181* | |
| X61<-X6 | 0.960 | 146.901* | |
| X62<-X6 | 0.956 | 121.687* | |
| Competitive Strategy->Speed strategy | 0.978 | 260.161* | |
| X71<-X7 | 0.935 | 98.247* | |
| X72<-X7 | 0.957 | 144.582* | |
| X73<-X7 | 0.950 | 129.235* | |
| Business Performance | |||
| Y1<-Business Performance | 0.970 | 175.243* | |
| Y2<-Business Performance | 0.979 | 255.351* | |
| Y3<-Business Performance | 0.961 | 141.391* | |
*valid for α=0.05
The result of measurement model of dimensions by its indicators show that the indicators are valid which the value of t<2.04 (t table at α=0.05). The result of measurement model of latent variables on their dimensions shows to what extent the validity of dimensions in measuring latent variables.
Following Figures 1 and 2 shows the complete path diagram:
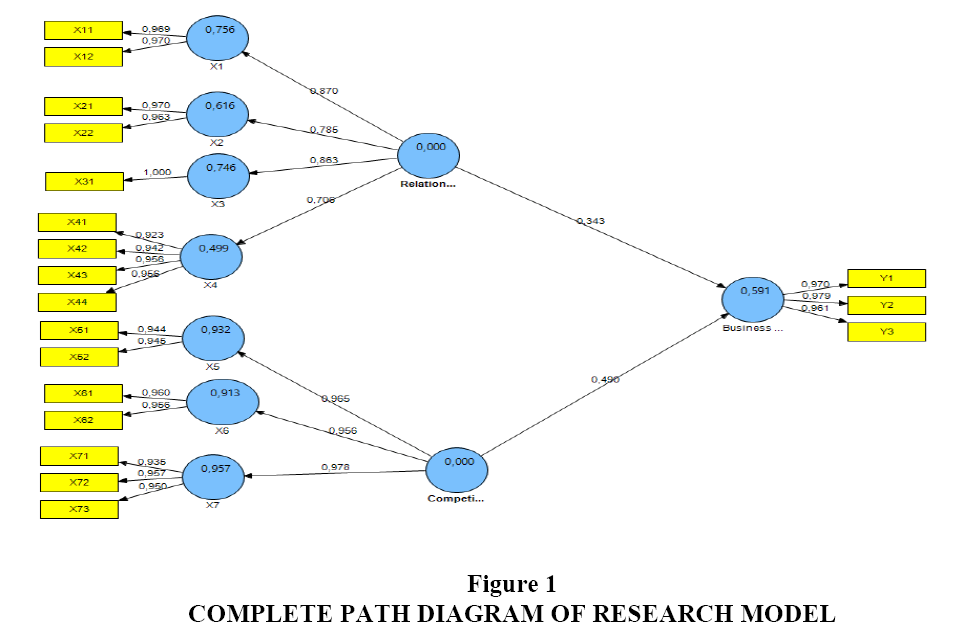
Figure 1: Complete Path Diagram of Research Model
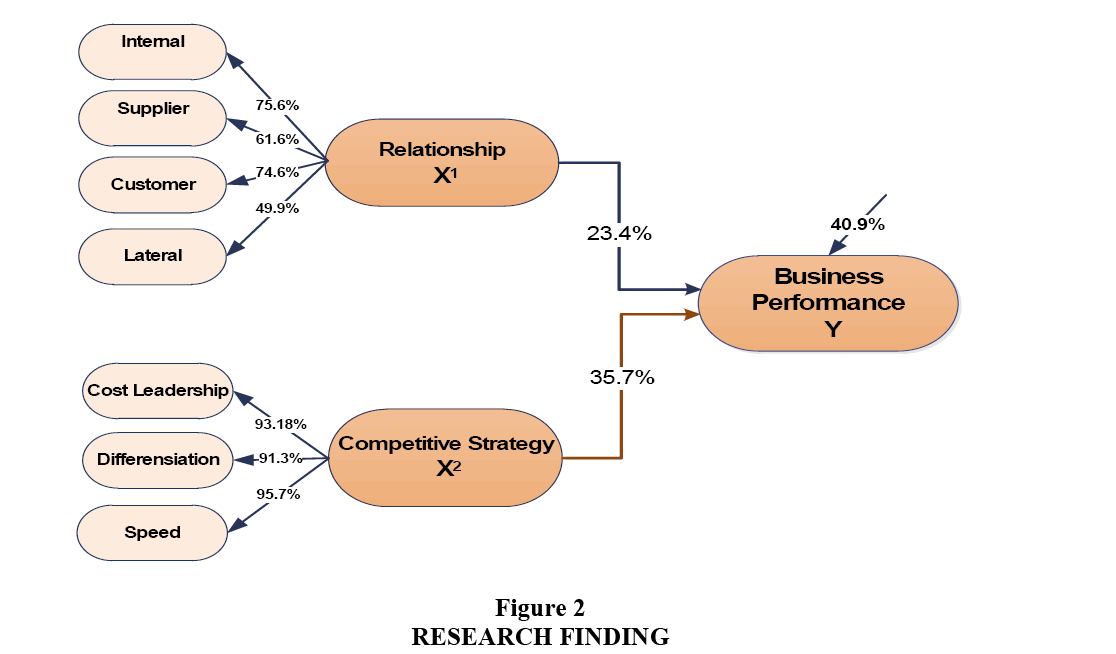
Figure 2: Research Finding
Structural Model
Based on the research framework and then obtained a structural model as follow:
Y=0.343X1+0.490X2+ς1
Which are:
Y=Business Performance
X1=Relationship
X2=Competitive Strategy
ςi=Residual
Hypothesis Testing Results
Table 6 shows the result of simultaneous hypothesis testing and Table 7 shows the result of hypothesis testing for partially.
| Table 6 SIMULTANEOUS TESTING OF HYPOTHESIS |
|||
| Hypothesis | R2 | F | Conclusion |
| Kerelasian and Strategi Bersaing®Business Performance | 0.591 | 26.802* | Hypothesis accepted |
*Significant at α=0.05 (F table=3316)
| Table 7 Partial Testing of Hypothesis |
||||
| Hypothesis | g | t | R2 | Conclusion |
| Relationship®Business Performance | 0.343 | 3.407* | 0.234 | Hypothesis accepted |
| Competitive Strategy®Business Performance | 0.490 | 4.618** | 0.357 | Hypothesis accepted |
*Significant at α=0.05 (t table=2.03)
Simultaneous Hypothesis Testing: Below is the result of simultaneous testing of hypothesis:
Based on the table, it is known that within the degree of confidence of 95% (α=0.05) simultaneously there is the effect of relationship and competitive strategy to Business Performance amounted to 59.1%, while the rest of 40.9% is affected by other factor did not examined.
Partial Hypothesis Testing: Below is the result of partial testing of hypothesis:
The table shows that partially, relationship and competitive strategy affect significantly to Business Performance, which is competitive strategy, has a greater effect (34.7%).
Research Finding
Based on hypothesis testing result, can be described the Research Model Finding as follow:
The results show that the two exogenous variables of relationship and competitive strategy have a positive effect on business performance. Thus shows that the results support the hypothesis. Competitive strategy is an aspect that has more dominant effect on business performance compared with the relationship. This has implications for the management of rattan companies in Java to improve competitive strategies in order to improve their business performance. Speed strategy is an aspect that plays more dominant effect than cost leadership strategy and differentiation strategy in improving business performance.
Companies are required to provide quick response to customers. In addition, the company is also required to anticipate the movement of competitors and follow the development of information technology in business development faster than its competitors.
Meanwhile, judging from the aspect of relationship, it is revealed that internal relationship gives greater role than relationship with supplier, customer and lateral in supporting the improvement of business performance. Therefore, internal relationships should be further developed by rattan entrepreneurs on the island of Java through increased synergies and collaboration among the inside unit of the company in order to be able to support faster strategy embodiment better.
The results of this study indicate the dominance of competing strategies in improving business performance, supporting the findings of Teeratansirikool et al. (2013) that competitive strategies improve company performance positively and significantly through performance measurement. Abidin, Adros & Hassan (2014) found that strategies provided positive improvements in a number of projects being addressed. Daneshvar & Ramesh (2012) found that information technology (IT) can help companies to adopt cost reduction strategies through reduced staff costs. The IT strategy contributes significantly to improving profitability and products.
Conclusion and Recommendation
Conclusion
Relationship and competitive strategy have a positive effect on business performance. Competitive strategy has more dominant effect on business performance compared to relationship. Speed strategy is an aspect that plays more dominant effect than cost leadership strategy and differentiation strategy in improving business performance.
Recommendation
Based on the results of this study, it is suggested to the management of rattan companies in Java to improve competitive strategy in an effort to improve business performance. Speed strategy is an aspect that plays more dominant effect than cost leadership strategy and differentiation strategy in improving business performance. Thus the companies are required to provide quick response to customers and anticipate the movement of competitors and follow the development of information technology in business development faster than its competitors. This finding of the study can be used in preparing the framework of the future study.
References
- Abidin, N.Z., Adros, N.A. & Hassan, H. (2014). Competitive strategy and performance of quantity surveying firms in Malaysia. Journal of Construction in Developing Countries, 19(2), 15-32.
- Ainin, S., Kamarulzaman, Y., Farinda, A.G. & Azmi, A.C. (2007). Business and entrepreneur characteristics influence on business performance of professional small medium enterprises. University of Malaya, Malaysia.
- Chin, W.W. (1998). The partial least square approach for structural equation modelling. In G.A Marcoulides (Eds.), Modern Method for Business Research Mahwah. NJ: Erlbaum.
- Cravens, D.W. & Nigel, P.F. (2013). Strategic marketing (10th Edition). New York: McGraw-Hill.
- Daneshvar, P. & Ramesh, H.N.D. (2012). Determination of IT strategies to improve bank's performance-Indian public banks experience. Anvesha, 5(2), 1-8.
- David Fred, R. (2013). Strategic Management, Concepts & Cases. Pearson Education Limited: England. http://www.kemenperin.go.id/artikel/471/Pengembangan-Industri-Pengolahan-Rotan-Indonesia
- Hubbard, G. & Beamish, P. (2011). Strategic management: Thinking, analysis, action. Frechs Forest, N.S.W: Pearson Australia.
- ITPC (2014). OSAKA.
- Kotler, P. & Keller, K.L. (2012). A framework for marketing management (4th Edition). Prentice Hall International Inc.: New Jersey.
- La Forgia, G.M. & Harding, A. (2009). Public-private partnerships and public hospital performance in São Paulo, Brazil. Health Affairs, 28(4), 1114-26.
- Najib, M. & Kiminami, A. (2011). Innovation, cooperation and business performance some evidence from Indonesian small food processing cluster. Journal of Agribusiness in Developing and Emerging Economies, 1(1), (75-96).
- Pearce, J.A. & Robinson, R.B. (2015). Strategic management: Planning for domestic & global competition, International edition. New York: McGraw Hill.
- Vanderstraeten, J. & Matthyssens, P. (2010). Measuring the performance of business incubators: A critical analysis of effectiveness approaches and performance measurement systems, ICSB. World Conference Proceedings, 1-26. Washington: International Council for Small business (ICSB).
- Wheelen, T.L., Hunger, J.D., Hoffman, A.N. & Bamford, C.E. (2015). Strategic management and business policy: Globalization, innovation and sustainability (14th Edition). Global Edition: Pearson.