Research Article: 2021 Vol: 20 Issue: 2S
The Impact of Financial Performance on Earnings Management Practice Behavior(An Empirical Study on Financial Companies in Jordan)
Ashraf Mohammad Salem Alrjoub, AlBalqa Applied University
Salam Nawaf Almomani, Aqaba University of technology
Atallah Ahmad Al-Hosban, Aqaba University of Technology
Mahmoud Izzat Allahham, Universiti Utara Malaysia
Keywords
Earnings Management, Financial Performance, ASE, Jordan
JEL Classification: G20, G23, G28
Abstract
The current study examines the impact of financial performance on earnings management practice behavior at the Jordanian public shareholding financial companies listed in the Amman stock exchange. The study model addresses the relationship between several independent variables represented in the companies' financial performance and some other variables and the dependent variable described in the practice of earnings management behavior at the Jordanian public shareholding financial companies listed in Amman stock exchange. The research findings proved the practice of earnings management behavior by several sectors at a different level. They found a statistically significant correlation between the financial performance variables and the response of earnings management practice at the public shareholding financial companies. The study also confirmed that Jordanian public shareholding financial companies had practiced earnings management during the study period, with a percentage of companies that practice earnings management is less than the rate of not practicing it.
Introduction
Accounting earnings consider one of the prominent figures that receive attention from various relevant parties to the company. These earnings express the nature of many accounting principles and rules, and the various management provisions choose and take and also provide better information for investment decision making. Investors, executive managers, and board of directors see earning figures as a fundamental and important indicator about the economic performance of the company and have direct effects on the wealth distribution among the different stakeholders (shareholders or credit owners, workers company management, the government, etc.), and also use to specify what management obtains from compensations and rewards. Therefore, accountants care about the financial performance which considers absolute and important in financial statements for the purposes of measuring firm management effectiveness and efficiency, it uses to predict the future income and various future events, and also directed toward the various economic decisions related to the firm. Thus it plays an important role in the functions and decisions of the planning, investment, and control both the inside and the outside of the firm (Al-Abed Allah, et al., 2007). The financial corporation management practice behavior related to interfering with the accounting figures which several parties depend on may have positive or negative effects on net income, and some may consider it a sort of fraud or manipulation of accounting information, while others might consider it a legitimate legal behavior regardless of it being immoral, as long as it is in the interest of economic unity.
Rahman et al., (2013), defines it in this context, as the deliberate administrative interference in the financial reporting preparation process, in order to influence the stakeholders, or modify the outcome of the agreements, and also in this context, Shubita (2015) considered that earnings management represented in the strategic practices of managerial discretions by amplifying the determinant earning figures for the external parties and achieving it mainly through timings of the actual or determinant economical events to transfer income between the different periods. The ministry of industry and commerce and the Jordanian securities commission regulate the public shareholding companies sector, and therefore implementing the instructions and rules issued by the securities markets will improve the quality of financial reports issued by the public shareholding companies through keeping away from the earnings management practices and provide instead, accurate financial reports which reflect the actual reality of it.
The researcher found in view of the above reasons, a need for the research in this topic, therefore this study tries to identify the impact of companies financial performance on the earnings management practices at the public shareholding financial companies listed in Amman stock exchange during the period (2010-2016), and the researcher chose this period due to the believes that financial market and most sectors in Jordan have recovered from the financial crisis that invaded the world in 2008.
The problem of the study resides in the financial companies as an important sector in the business world and benefits from it numerous individuals and institutions, and also plays a major role in the economic life of Jordan. The stopping of (5) companies from doing business and the liquidating of (13) others during (2015), despite gaining profits several years before liquidation refers to companies by trying through their annual financial lists to be seen as best as they could to influence their stock prices in the financial markets or get rewards currently or in the future, where companies try always to be at their best through their financial lists to use it as a way to get funding, get bonuses currently or in the future, or to hide losses already occurred. For these reasons, the financial companies might use earnings management concepts to show their financial statements better than the actual way of it. The phenomenon of income smoothing consider one of the common and spreading phenomena at numerous companies in the world, due to its influence on the accounting information and it impacts, in the same time by the financial performance of companies, to reach the interests of companies ' managements, either by reducing income to cut taxes, or by increasing it, for the purpose of boosting the board members reward, or prelude it through reducing it, when its high or increasing it when it is low, in order to reduce the sharp fluctuations in income level to achieve stability in the stocks prices in the market, therefore it may affect the accounting earnings quality and the continuity of the company in the future.
The study aims to identify the practice level of earnings management behavior in the financial companies listed in (ASE), and the impact of financial performance on the practice of this behavior, through collecting data from the real yearly financial reports issued by those companies during the period (2010-2016), which related to the variables of earnings management measure, by using the modified Jones model for the purpose of specifying the optional deserved that management performs and then identify the financial performance impact on earnings management practice in the companies. This study importance comes from the topic of earnings management practice behavior and its affecting variables in the financial companies (ASE), and the significance of accurateness and correctness about the published yearly financial reports, due to the fact that taking important decision relies on these reports, and with the strong competition between companies, they may use the earnings management practice behavior to influence the financial statements and show it in better financial situation. Therefore the importance of this study comes through examining the earnings management practice level in the companies and their affecting variables. This study will benefit each of the shareholders, customers, management, and relevant government agencies, which have requirements that there should be a set of controls and ethical and professional principles to achieve confidence and credibility in the data that contained in the financial reports and need it the financial report users, especially the investors who deal in the securities markets.
Literature Review
The study of Shubuta (2015) aimed to assess the income smoothing practices in the Gulf Cooperation Council (GCC) emerging markets; KSA, Kuwait, UAE, Oman, and Qatar, and to examine the impact of income smoothing on the earnings quality to decide if income smoothing can serve as a tool, either by enhancing earnings quality or by opportunistic behavior. The study methodology measures income smoothing behavior based on the coefficient of variation method. Earnings quality is measured as an outcome of the explained variations in stock returns by earnings based on the efficient market hypothesis. The results suggest that income smoothing behavior in the GCC markets has many variations in practice. Income smoothing, on average, improves earnings quality in three countries out of four, but not significantly for the whole sample based on earnings level. The earnings changes model demonstrated a positive and significant impact of income smoothing on earnings quality. Earnings qualities have a positive relationship within the region, and companies dominated by the government perform well in accordance with the earnings-return model. The study of Cheng & Li (2014), who replicate Ibrahim (2009) aimed to compare the results between the US and China markets. It used a sample of US firms from 2003 to 2008, and the results found to be consistent with Ibrahim (2009) that income smoothing improves FERC, but analysis for the China market over the same period indicates that income smoothing has little impact on FERC.
It argues that market-level information differences in the environment partly account for the differential impacts of income smoothing on FERC. But the study of Al-Sartawi (2013), aimed to identify the extent of audit committees on reducing earnings management practice in the Jordanian corporations, and describe the impact of this committee characteristics on reducing earnings management practices before the global financial crisis. In order to achieve the study objectives, researchers studied and analyzed the relevant law and Jordanian legislation to determine the most important characteristics of audit committees, and examine their impact on the earnings management for a sample consist of (50) public shareholding Industrial companies listed on Amman securities and stock exchange during the previous six years of the financial crisis (2001-2006) and got data from the annual financial reports issued by the companies, develop a form of multiple regression. The statistical analysis of the results showed characteristics of both audit committees: the audit committee size, financial experience of its members, and the number of meeting times, it hadn't any effect on reducing the earnings management, but the independence of audit committee members influence the reduction of earnings management, and the percentage of audit committee members ownership of the company's stock has had a significant impact on increasing the earnings management. Where the paper of Rahman et al (2013), specially focuses on earnings management, quality of earnings, and various techniques, such as cookie jar reserve, big bath, and big bet that are used to manage earnings in the business entity. This paper concludes that precise accounting standard, awareness of audit committee, corporate governance, consciousness, and the morality of the stake holders all play a vital role in controlling earnings management.
while the study of Donald (2002) aimed to identify the degree of management practice at the Kuwaiti public shareholding companies to the earnings management methods, and show the impact of management practice at these companies to the earnings management methods (Accounting acquisitions, misuse of relative importance, using accounting estimates, and revenue recognition practice) on the earnings of these companies. It also aimed to identify the differences, if they exist between the covered categories views in the study sample about the companies' management practices, in regard to the earnings management methods. The study results showed that companies' management practice earnings management methods, and found a statistical significant effect for management practice of the earnings methods on companies' earnings, and also found differences of statistical significant between the study sample views about management practices of the earnings management methods. The study of Shaheen (2011) aimed to identify the extent of earnings management practice in the banking environment and its resulting risks, by identifying the nature of those processes, their indicators, the methods used in practicing them, and the implications caused by them, in the national banks operating in Palestine. The results showed that banks' managements perform the process of earnings management practice, significantly during the years of study (2005-2009) and unevenly between banks, and that bank's management wasn't aware of risks resulting from the earnings management practice operations.
The results also showed that earning management processes greatly affect credibility of the financial statements and makes them misleading and lacking the characteristics of quality, objectivity, and credibility, which may affect the user's decision of those statements. But Shteiwi (2009) did a study that aimed to identify the extent of Saudi shareholding companies' practices in managing their earnings, and test the impact of some influencing factors on the direction of those companies in the earnings management practice. These factors include all of the company's size, profitability, indebtedness, and type of Sector Company belongs to. Study results showed that Saudi shareholding companies practice the earnings management negatively and the industrial and logistic shareholding companies practice the optional earnings positively. It also showed that profitable companies are practicing the earning management negatively, and the non- profitable one practicing it positively. The results also showed no effect for company size and sector type of the company on the earnings management, while there is an impact of indebtedness and profitability on company practice of earnings management, while the study of Gunny (2010), aimed to study the relationship between earnings management, by manipulating the real activities and companies future financial performance, and also to see the impact for a range of factors (company size, number of branches, the market value ratio of the property rights to the book value, the average return on assets, operating activities' cash flows, in addition to the research and development expenses) on the earnings management practice.
The analysis results showed a statistical significant relationship between company size, number of branches, and operating activities' cash flows and the earnings management, and the increase in research and development expenditures size in the companies encourages the management to practice earnings management. The study also showed non-existence of statistical significant relationship between the earnings management and the market value ratio of the property rights to the book value. Finally, the study of Shen and Chih (2007) aimed to identify the impact of companies' governance on the earnings management in nine Asian countries during the period (2001- 2002). Analysis results showed the companies that have good governance level, their earnings management practice level will be reduced, and that big company's practice earnings management more than small ones. The results also showed an impact of the financial leverage on companies' governance and the existence of indebtedness makes it difficult to practice the earnings management, because the highly indebted company would be subject to accurate scrutiny, and therefore it will be difficult to manipulate the earnings.
The study depends on the following hypotheses:
H1 The financial companies listed (ASE) don't practice the earnings management.
H2 There is no statistical significant relationship of financial performance on the of earnings management practice in the Jordanian public shareholding financial companies listed (ASE).
Methodology
The study population consists of all the financial companies listed (ASE) in 2017, which amount to (108) companies distributed on four sectors (Jordan Securities Commission, 2017), as shown in the following Table 1:
| Table 1 Distribution of the Study Population |
||
|---|---|---|
| Financial Sector | Number of firms | Percentage |
| Banks | 16 | 14.8 |
| Diversified Financial Services | 37 | 34.3 |
| Insurance | 22 | 20.4 |
| Real Estate | 33 | 30.6 |
| Total | 108 | 1 |
But as related to the study sample, it formed from (76) Jordanian public shareholding financial companies listed in Amman stock exchange and provide about it the adequate data related to the study variables, according to the following conditions:
• Its fiscal year must end in 31/12.
• It must be provided with the financial statements during the study period (2012-2016).
• Its name must be listed in Amman stock exchange during the study period (2012-2016).
• It shouldn't merge with another company during the study period.
The necessary data will be collected from the annual financial reports of the financial companies for the period (2012-2016), published on the Jordan securities commission websites, the businesses directory for the same period, the books from the university library, the references and periodicals related to the study topic, and by relying on the Internet and databases to obtain the foreign studies and articles published in the international journals and magazines which dealt with the study topic.
The annual financial reports for the Jordanian public shareholding financial companies listed in Amman stock exchange, during the period (2012-2016) consider the main source for collecting data to identify the impact of financial performance on the level of earnings management practice behavior, in order to detect the data of the study variables as follows:
Dependent Variable: Earnings Management
Earnings management practice will be measured by calculating the optional entitlements, which represented and initiated the earnings management for each company separately, by using the (modified Jones model, 1995), which was adopted in many of the previous studies, where the study of (Jean et al., 2004; Shubita, 2015), referred to it as the most powerful used model in the detection of earnings management practice, which calculated according to the following steps:
Measurement of total accruals (receivables), which can be measured by the cash flow method, where the total accruals will be calculated by the difference between operating net income and the cash flow from operations, through the model below:
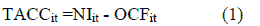
Where,
TACCit=Total Accruals for company i in year t.
NIit=Net Income before extraordinary items for company i in year t. OCFit=Operating Cash Flows for company i in year t.
A model parameters estimation that will calculate through it the non-discretionary accruals (NDACCi t) through the following regression equation, which made to a group of sample companies each year separately, according to the following model:

Where:
TACCit=total accruals for company i in year t. Ait-1=Lagged total asset for company i.
ΔREVit=change in operating revenues for company i in year t. ΔRECit=change in net receivables for company i in year t.
PPEit=gross property, plant and equipment for company i in year t. Α1- α3=regression parameters.
e=error term.
Define the normal non-discretionary accruals (NDACCit) for each sample company individually, and during each year of the study, through the estimated yearly model parameters above (α1, α2, α3), and depending on the following formula:

Where:
NDTACCit=non-discretionary accruals for company i in year t.
Ait-1=Lagged total asset for company i.
ΔREVit=change in operating revenues for company i in year t.
ΔRECit=change in net receivables for company i in year t.
PPEit=gross property, plant and equipment for company i in year t.
Â1- â3=regression parameters.
The discretionary accruals (DACCit) for each company will be calculated by the difference between the total accruals and the non-discretionary accruals, and according to the following formula:

Where:
DACCit=discretionary accruals for company i in year t.
TACCit=total accruals for company i in year t.
NDTACCit=non-discretionary accruals for company i in year t.
If the discretionary accruals (optional benefits) went over their average, the company has practiced earnings management this year and gives a false variable of (1); otherwise it didn't practice earnings management and gives the number (0).
The independent variables represents by the financial performance of the Jordanian public shareholding financial companies listed on Amman stock exchange, which measured by different criteria and methods, such as costs, earnings, sales value, or number of customers, and other methods (Donald, 2002), and after looking into the related previous studies (Ibrahim, 2009; Al-Abdullah et al., 2007; and Karabsheh, 2007), we state the following independent variables and their measurement mechanism:
Here Table 2 shows the variables definitions and measurements
| Table 2 Variables Definitions and Measurements |
||
|---|---|---|
| Variables | Code | Variable measurement |
| Return on Equity | ROE | Net operating earnings divided by shareholders equity. |
| Return on Assets | ROA | Total net income to total assets. |
| Earnings Per Share | EPS | Net income by the number of outstanding shares. |
| Dividend Per Share | DPS | Total cash distributions divided by the number of shares. |
| Closing Price (JD) | CP | The price of share at 31/12 |
| Audit Firm Size | ADFSZ | 1 if the audit firm is big 4, 0 otherwise. |
| Board Size | Board | The number of board of directors. A dichotomous variable equal to 0 if the firm i is. |
| Role Duality | Duality | Separated between the role of CEO and Chairman, and 1 otherwise. |
| Complexity level | Branch | The number of company's branches. |
| Company size | Size | The natural log of the total assets. |
| Leverage | LEV | Total debts to total assets. |
| CEO accounting expert | CEOFEX | 1 if the CEO is qualified as accounting expert, 0 otherwise. |
The following multiple regression models developed to test the research hypotheses:
The following regression formula will be used, which consists of twelve independent variable (five of these are continuous variables and seven are dummy variables). It also includes a dependent variable represented in the companies practice of earnings management behavior, and it's possible to express this relationship between the independent variables and the dependent variable by the following multiple regression formula:

Results and Discussion
The number of sample companies, which special conditions applied to it in selecting the study sample, amounted to (76) financial companies that are divided on four sectors: banking sector (13) companies, other financial services (25), insurance (22), and real estate at (16), with yearly total previews of (380), during the study period (2012- 2016). The following table shows the frequencies and ratios of the Jordanian public shareholding financial companies practicing the earnings management, during the period (2012-2016), at each level of the financial sectors.
| Table 3 | ||||||
|---|---|---|---|---|---|---|
| The Frequencies and Ratios of Companies | ||||||
| Sector | Total of Classification Declaration | 2012 | 2013 | 2014 | 2015 | 2016 |
| Banks Ratios | 13 practice Frequencies | 10 | 6 | 3 | 5 | 5 |
| 0.769 | 0.462 | 0.231 | 0.385 | 0.385 | ||
| Financial Services Ratios | 25 practice Frequencies | 11 | 13 | 14 | 12 | 12 |
| 0.44 | 0.52 | 0.56 | 0.48 | 0.48 | ||
| Insurance Ratios | 22 practice Frequencies | 7 | 7 | 10 | 16 | 16 |
| 0.318 | 0.318 | 0.455 | 0.727 | 0.727 | ||
| Real Estate Ratios | 16 practice Frequencies | 9 | 7 | 8 | 5 | 6 |
| 0.563 | 0.438 | 0.5 | 0.313 | 0.375 | ||
It notices from the table 3 above, the existence of a discrepancy or variation between companies in terms of the earnings management practice during the period (2012-2016), where it showed that banking is the most practicing sector of earnings management in 2012 with (76.9%), and in 2013 the number of companies that were practicing earnings management decreased, and researcher links it to the updates that securities commission made on the directions of exporting companies disclosure, accounting criteria, and old auditing criteria, which had positive reflection on companies by moving away from practicing earnings management and committed to the disclosure criteria that were released. Banks were the least practice of earnings management in 2014, due to the development of banks ' compliance instructions issued by the central bank of Jordan, where the percentage of practicing banks is (23.1%), but this commitment didn't continue by the companies, where the proportion of banks that practiced the earnings management increased in 2015, and negatively reflect the banking sector and insurance companies, with a decline in the same year at the different financial companies sector and the real estate companies. Where in 2016, the number of companies practicing earnings management increased in all financial sectors to the extent that outstripped the previous three years, and this may be due to the feeling of some companies that the process of their commitment to the disclosure criteria may entail some problems that negatively will reflect the display of company's financial situation, and also the finding of some gaps in the disclosure law with companies taking advantage of that, and the following figure 1 illustrates that:

Figure 1: Display of Company's Financial Situation
From the above, the researcher notes a similar trend of companies in each year of the study in practicing earnings management or not, due to the effect of all companies by the laws, regulations, and instructions issued by the securities commission and the central bank of Jordan. Table (4) also shows the average rates of financial companies earnings management practice during the period (2012-2016) in the Jordanian public shareholding financial companies listed in Amman stock exchange, according to the financial sectors, where the results showed that the level of earnings management practices in the annual financial reports for the financial companies ranges from (0.00%) as the lowest practice level and (84%) as the highest.
Generally, it showed that financial companies in its various sectors are practicing the earnings management behavior at (12%), with standard deviation of (13%), which refers to non-existence of large dispersion in the level of earnings management practices between the companies representing the study sample.Observe table 4.
| Table 4 Level of Earnings Management Practices |
||||||
|---|---|---|---|---|---|---|
| Sector | Mean | Min. | Max. | Std. | Skewness | Kurtosis |
| Banks | 0.076 | 0.35 | 0 | 0.072 | 2.167 | 5.86 |
| Financial Services | 0.109 | 0.68 | 0 | 0.101 | 2.018 | 7.495 |
| Insurance | 0.128 | 0.61 | 0 | 0.111 | 1.513 | 2.877 |
| Real Estate | 0.163 | 0.84 | 0 | 0.2 | 1.572 | 1.634 |
| Financial Sector | 0.12 | 0.84 | 0 | 0.13 | 2.231 | 6.262 |
Where the results showed the most financial sectors practicing the earnings management behavior was the real estate sector at (16.3%), then the insurance companies sector with (12.8%), while the least practice of earnings management behavior was the banking sector with a rate of (7.6%), and the following figure 2 shows that:

Figure 2: Earnings Management Classified By Industry
Table (5) shows the results of the descriptive analysis of the independent variables for the period (2012-2016), using the descriptive statistical analysis methods represented in the arithmetic mean, median, standard deviation, maximum value, minimum value, Skewness, and kurtosis available on the E-Views program. The results indicated that skewness coefficients values for the study variables fall within the normal accepted range for the skewness coefficients, where the values narrowed between (± 1) and ranged between (0.924-) for ROA and (0.907) for DPS, but the kurtosis behavior for the study variables were greater than the normal distribution at (3).
| Table 5 Descriptive Statistics |
|||||||
|---|---|---|---|---|---|---|---|
| variables | Mean | Median | Max. | Min. | Std. | Skewness | Kurtosis |
| ROE | 1.94 | 3.185 | 111.772 | -13.541 | 0.151 | 0.167 | 5.86 |
| ROA | 0.667 | 1.39 | 25.57 | -50.12 | 5.945 | -0.924 | 26.883 |
| EPS | 0.059 | 0.04 | 0.65 | -1.01 | 0.14 | -0.321 | 13.179 |
| DPS | 0.042 | 0 | 0.35 | 0 | 0.066 | 0.907 | 6.866 |
| CP | 1.235 | 0.895 | 9.45 | 0.11 | 1.336 | 0.844 | 20.354 |
| CEOFEX | 0.356 | 1.254 | 0.621 | 0 | 0.495 | 0.397 | 5.157 |
| Duality | 0.747 | 1 | 1 | 0 | 0.433 | -0.138 | 9.296 |
| BOARDSZ | 8.021 | 12 | 16 | 7 | 1.753 | -0.269 | 5.381 |
| ADFSZ | 0.408 | 0 | 1 | 0 | 0.492 | 0.375 | 6.14 |
| Branch | 29.642 | 25 | 117 | 12 | 15.387 | 0.659 | 16.594 |
| Size | 7.632 | 7.392 | 10.412 | 6.275 | 0.887 | 0.166 | 3.668 |
| LEV | 44.973 | 13.17 | 99.901 | 0.04 | 0.314 | 0.042 | 6.542 |
Table (5) exhibits the descriptive analysis for the continuous independent variables used in analysis.
The descriptive statistics regarding the company continuous variables, which are included in the model, consider the effects of them on the earnings management for financial sectors. According to board size, the average number of board size is (8) members, but the maximum number of board size is (16) members, which generally implies that companies do not follow the Jordanian corporate governance codes which recommends that board members should not exceed (13) members.
This hypothesis test the extent of earnings management practice by the Jordanian public shareholding financial companies during the period (2012-2016), where the descriptive statistics showed frequency appearance of the earning management practice during the study period, and upon that a binomial test for the practice morality level was performed for the first hypothesis which stated: "The public shareholding financial companies don't practice earnings management".
| Table 6 Binomial Test Results for the First Hypothesis |
|||
|---|---|---|---|
| Classification | Number of previews | Previews ratios | Sig. |
| Practice companies | 182 | 0.479 | 0 |
| Non- practice companies | 198 | 0.521 | 0 |
The above table 6 shows that public shareholding financial companies had practice earnings management during the study period with (47.9%), while the proportion of non-practice amounted to (52.1%), and by looking into the advantages of this test, where it compares the actual distribution reviews with a default one, the low significant (Sig) value says that distribution previews differ from the default distribution, meaning that percentage of companies which practice earnings management are less than the percentage of not practicing it, and the low (Sig) value supported the statistical significance of this result. Thus, the nihilism hypothesis will be rejected, and the alternative hypothesis will be accepted, meaning that the Jordanian public shareholding financial companies had practiced the earnings management during the study period. The regression model was checked before conducting the analysis, for the presence of multi-co linearity problem between the independent variables. This occurs when two or more independent variables are highly correlated which makes it difficult to determine the individual contribution of each variable to the prediction of the dependent variable, where (Jean et al., 2004) consider an absolute correlation coefficient high if it exceeds (70%) for any two of the independent variables(i.e, in table 7).
| Table 7 Correlation Analysis for Independent Variables |
||||||||
|---|---|---|---|---|---|---|---|---|
| Variables | 1 | 2 | 3 | 4 | 5 | 6 | 7 | |
| Panel A: Correlation for variables ROE (1) to Duality (7) | ||||||||
| ROE | 1 | |||||||
| ROA | 0.234* | 1 | ||||||
| EPS | 0.136* | 0.674 | 1 | |||||
| DPS | 0.049* | 0.266 | 0.727 | 1 | ||||
| CP | 0.036* | 0.141 | 0.643 | 0.456* | 1 | |||
| CEOFEX | 0.060* | 0.06 | 0.33 | 0.346* | 0.339* | 1 | ||
| Duality | -0.043* | -0.095 | -0.089 | -0.104 | 0.002* | -0.14 | 1 | |
| BOARDSZ | 0 | -0.049 | -0.135 | -0.167 | 0.143* | -0.135 | 0.117 | |
| ADFSZ | 0.061* | 0.06 | 0.337 | 0.355 | 0.348* | 0.256 | -0.133 | |
| Branch | 0.042* | 0.046 | 0.516 | 0.627 | 0.245* | 0.236 | 0.108 | |
| Size | 0.065* | 0.131 | 0.588 | 0.624 | 0.505* | 0.541 | -0.138 | |
| LEV | 0.003* | 0.009 | 0.057 | 0.108 | 0.065* | 0.065 | 0.029 | |
| Variables | 8 | 9 | 10 | 11 | 12 | |||
| Panel B: Correlation for variables BOARDSZ (8) to LEV (12) | ||||||||
| BOARDSZ | 1 | |||||||
| ADFSZ | -0.132* | 1 | ||||||
| Branch | 0.044 | 0.247 | 1 | |||||
| Size | -0.153 | 0.559 | 0.564 | 1 | ||||
| LEV | -0.002 | 0.065 | 0.139 | 0.105 | 1 | |||
The results were tabulated in Table (8), indicating that only DPS and EPS have a co- linearity exceeding the rule of thumb, 0.70. This analysis was supplemented with the use of Variance Inflation Factor (VIF) analysis, which suggests the presence of a multi-co-linearity problem if the VIF value is more than 10. However, unreported results suggest that the highest VIF value in the data is 3 for both DPS and EPS. This indicates that multi-co-linearity problem doesn't threaten the validity of the regression estimations. Table (8) shows the multi-co-linearity Test:
| Table 8 Multi-Colinearity Test |
||
|---|---|---|
| Variables | Tolerance | VIF |
| ROE | 0.586 | 1.705 |
| ROA | 0.559 | 1.789 |
| EPS | 0.577 | 2.789 |
| DPS | 0.534 | 2.845 |
| CP | 0.555 | 1.803 |
| CEOFEX | 0.492 | 2.034 |
| Duality | 0.576 | 1.737 |
| BOARDSZ | 0.619 | 1.616 |
| ADFSZ | 0.446 | 2.244 |
| Branch | 0.437 | 2.286 |
| Size | 0.452 | 2.345 |
Table (8) shows that the Value of Coefficient (VIF) for all independent variables are less than (10), which enhances the results of Pearson correlation matrix, that showed a very weak existence of links among the independent variables, therefore it doesn't consider the problem of overlapping linear influential on the regression model study. After checking and verifying the appropriate data for statistical analysis, and giving an initial description of the study variables, the last stage in data analysis is hypothesis testing, where the study model addresses the relationship between several independent variables represented in the companies' financial performance and some other variables and the dependent variable represented in the practice of earnings management behavior, and since the relationship between a set of independent variables and the dependent variable, therefore the appropriate regression model to measure this relationship is the pooled data regression model, and also the study sample represented in the financial companies across a time series data during the period ( 2012-2016), and to estimate the relationship between the variables, E-Views program was used, and the following table shows the results of the study sample test (Regression results):
| Table 9 Regression Results |
||||
|---|---|---|---|---|
| Independent Variable | Expected sign | Coefficient | t-Statistic | Prob. |
| ROE | - | -8.802 | -2.302 | 0.021 |
| ROA | - | -0.205 | -4.553 | 0 |
| EPS | - | -18.339 | -7.754 | 0 |
| DPS | +/- | -0.012 | -0.019 | 0.979 |
| CP | - | -0.958 | -3.088 | 0.002 |
| CEOFEX | +/- | 0.241 | 2.145 | 0.012 |
| Duality | - | 0.03 | 1.777 | 0.076 |
| BOARDSZ | - | -1.801 | -1.986 | 0.047 |
| ADFSZ | +/- | -0.561 | -1.164 | 0.024 |
| Branch | + | 0 | -0.76 | 0.447 |
| Size | + | -0.018 | -1.085 | 0.278 |
| Lev. | + | 4.392 | 1.883 | 0.046 |
| R | 0.71 | |||
| R-squared | 0.624 | |||
| Adjusted R Square | 0.531 | |||
| F-statistic | 16.41 | |||
| Prob (F-statistic) | 0.005 | |||
| Durbin-Watson statistic | 2.145 | |||
Table (9) above shows a statistical significant correlation between the financial performance variables and the behavior of earnings management practice at the public shareholding financial companies, where the correlation value amounted to (71%), which indicate a strong correlation and impact, while the (Adjusted R Square) explains (0.531) percentage of the variance in the dependent variable, which means that (53%) value of the changes that occur in the of earnings management practice result from the financial performance, and confirms that the value of calculated (F) test which amounted to (16.410) at a statistical significance of (0.005), and this assure the significant of the model, and refers to the existence of statistical significance relationship between the independent variables and the dependent variable.
Also according to the results in table (9) above, ROE shows a negative significant impact on earnings management (at coefficient=-8.802, p>0.021), which in¬dicates that companies' ROE directly influence their earnings management. Also the coefficient for the ROA is (-0.205), which indicate that ROA has a negative impact on earnings management (at p>0.000) which in¬dicates that ROA of the firms directly influence their earnings management. And the same results for the EPS, where it shows a negative significant impact on earnings management (at coefficient=-18.339, p>0.000), which in¬dicates that companies EPS directly influence their earnings management. Also CP shows negative significant impact on earnings management (at coefficient=-0.958, p>0.002), which in¬dicates that companies CP directly influence their earnings management. And the results in table (9) also shows, CEOFEX and earnings management to be posi¬tively related (at Coefficient=0.241, p<0.012), which implies that CEOFEX has a positive influence on earnings management.
Also, coefficient for the BOARDSZ is (-1.801), indicates that BOARDSZ has a negative impact on the earnings management, The calculated value of t-statistic for the coefficient of BOARDSZ (p>0.047), is less than the critical value of t-statistics in error 0.05, which in¬dicates that BOARDSZ directly influence their earnings management. While ADFSZ shows negative significant impact on the earnings management (at coefficient=-- 0.561, p>0.024), which in¬dicates that companies ADFSZ directly influence their earnings management, and finally the coefficient for the leverage is (4.392), which indicates that leverage has a positive effect on the earnings management. The calculated value of t-statistic for the coefficient of leverage (p>0.046) is less than the critical value of t-statistics in error 0.05, which implies that leverage has a positive influence on earnings management. While the DPS, Duality, Branch and the company size aren't significant with the earnings management.
The calculated value of t-statistic for the coefficient is greater than the critical value of t-statistics in error 0.05. Which in¬dicates that this variable doesn't have influence on earnings management.
Conclusion
The current study examines the impact of financial performance on earnings management practice behavior at the Jordanian public shareholding financial companies listed in Amman stock exchange. The study model addresses the relationship between several independent variables represented in the companies' financial performance and some other variables and the dependent variable represented in the practice of earnings management behavior at the Jordanian public shareholding financial companies listed in Amman stock exchange. The research findings proved the practicing of earnings management behavior by several sectors at different level, and found a statistical significant correlation between the financial performance variables and the behavior of earnings management practice at the public shareholding financial companies. The study also confirmed that Jordanian public shareholding financial companies had practiced earnings management during the study period, with a percentage of companies which practice earnings management is less than the percentage of not practicing it.
The Study Concluded the Following Results:
1. The financial performance of financial companies have a negative impact on the earnings management practice behavior, where companies with acceptable and good financial performance don't need to practice the earnings management, in order to make their financial statements looks better.
2. The board of director's characteristics has an impact on earnings management practice behavior, where the financial experience of the chairman plays a large role in practicing earnings management, and the division between the chief executive officer (CEO) and the chairman also plays the same role and the positive relationship.
3. The companies that own a very large size board of directors have a negative impact on earnings management practice, which agrees with the governing laws, and also with the law of Jordanian companies that limit the members of management board between (3-13).
4. The results refers to the existence of negative relationship between the auditing company size and its characteristics, where companies that get audited from the international auditing companies, their percentages of earnings management practice tend to be reduced.
5. In relation to the financial company characteristics, the results showed the implementation level of companies operations with branches have a negative impact on earnings management, and this may be credited to company that doesn't need to attract new customers, and as related to company's size represented by the overall assets, it had a negative impact on the practice of this behavior in the large companies, where the practice of earnings management behavior get reduced.
6. The highly indebted financial companies practice earnings management to decorate their statements and affect their stock prices in the financial markets compare with the low debt financial companies.
Recommendations
The study made the following recommendations:
1. Work to tighten controls on the listed companies in Amman financial market by adjusting and developing the systems and laws that limits the practice of earnings management behavior.
2. Force companies to audit their financial accounts through the international auditing companies, by adding an article or chapter to the law of auditing accounts that obligate auditing companies to connect with the international companies.
3. Work on obligating companies to implement government regulations and complies with it, in relation to the size of management board and the separation between the chairman and CEO.
References
- Ahmad, M.A., Alrjoub, A.M.S., & Alrabba, H.M. (2018). The effect of dividend policy on stock price volatility: Empirical evidence from amman stock exchange. Academy of Accounting and Financial Studies Journal, 22(2), 1-8.
- Al-Sartawi, A.A. (2013). The impact of audit committees in the Jordanian public shareholding companies on the reduction of earnings management – An empirical study on the industrial companies before the global financial crisis. An-Najah University Journal for research (Humanities), 27(4), 821-846.
- Al-Abdullah, R., Suwaidan, M., & Al-Goran, S. (2007). The means and motives influencing income smoothing policy: an empirical study on industrial companies listed in Amman stock exchange. Arabic magazine for accounting, 10(4), 1-41.
- Al-Qudah, A.A., Alsharari, N.M., Al-Rjoub, A.M., & Haddad, W. (2013). Importance of financial analysis for published financial information to predict the stocks behavior (Case study-ASE–Industrial Sector-Jordan). European Journal of Business and Management, 5(26), 96-102.
- Alrjoub, A.M.S., & Ahmad, M.A. (2017). Inventory management, cost of capital and firm performance: Evidence from manufacturing firms in Jordan. Investment management and financial innovations, 14(3), 4-14.
- Al-Rjoub, A.M., Alsharari, N.M., Al-Qudah, A.A., & Alfawaerah, N.H. (2013). The relationship between the EPS & the market stock return (Case Study: Industrial sector Jordan). In Information and Knowledge management, 3(11), 15-23.
- AL-Shwiyat, Z.M., ALRjoub, A.M., & Bshayreh, M. (2013). The impact of social responsibility on the financial performance for Jordanian companies. European Journal of Business and Management, 5(30), 123-132.
- Cheng, C.S., & Li, S.L. (2014). Does income smoothing improve earnings in formativeness? – A comparison between us and china markets. China Accounting and Finance Review, 16(2), 128-147.
- Donald, W. (2002). A way to develop corporate performance. Cairo, Egypt: Dar El- Farouk for publishing and distribution.
- Gunny, K.A. (2010). The relation between earnings management using real activities manipulation and future performance: Evidence from meeting earnings benchmarks. Contemporary Accounting Research, 27(3), 855- 888.
- Ibrahim, K.O. (2009). The effect of corporate governance on company competitiveness: A case study of Jordanian public shareholding companies, master thesis. Yarmouk University, Irbid, Jordan.
- Jean, B., Sonda, M. & Lucic, C. (2004). The effect of audit committee expertise, aggressive earnings management. Auditing: A Journal of Practice and Theory, 23(2), 13-35.
- Karabsheh, B. (2007). Relationship between corporate governance and finance performance of Jordanian bank. Master Thesis, Banking and Finance Department, Yarmouk University, Irbid, Jordan.
- Moqbel, M.A., Al-Rjoub, A.M., & AL-Shwiyat, Z.M.M. (2015). The effect of applying accounting information systems on the improvement of production costs: An applied study on Jordanian industrial firms listed on the Amman stock exchange. International Management Review, 11(2), 5-20.
- Rahman, M., Moniruzzaman, M., & Sharif, J., (2013), Techniques, motives and controls of earnings management. International Journal of Information Technology and Business Management, 1(1), 22- 34.
- Shaheen, A.A. (2011). Earnings management and risks in the banking environment-applied analytical study on Palestinian national banks. Faculty of Commerce, Islamic University.
- Shen, C.H., & Chih, H.L., (2007). Earnings management and corporate governance in Asia’s emerging markets. Journal compilation © Blackwell Publishing Ltd, 15(5), 999-1021.
- Shteiwi, A.A. (2009). An empirical study to analyse the impact of the economic factors on Egyptian companies' earnings management practices. Scientific journal for trade and finance, Faculty of Commerce, University of Tanta, 214-267.
- Shubita, M.F. (2015). The impact of income smoothing on earnings quality in emerging markets: Evidence from GCC markets. Journal of Accounting in Emerging Economies, 5(3), 299-324.