Research Article: 2020 Vol: 19 Issue: 6
The Innovation Capability of Small Business: A Study Focused on Food and Beverage SMEs in the Tourism Industry-An Analysis of Ecuador
Wendy Anzules-Falcones, Universidad de las Américas
Mauricio Ángel, Universidad Central de Venezuela
Juan Martin-Castilla, Universidad Autónoma de Madrid
Abstract
Innovation is an important factor for the future performance of companies. This article analyzes the relationship between leadership, strategy, marketing, processes, and external factors on the capacity for innovation. Findings from a structural equation model of 137 micro and Ecuadorian food and beverage small and medium-sized enterprises (SMEs) showed that leadership, strategy, processes, and marketing significantly influence firms’ innovation. We also found that external factors influence innovation and that variable leadership does not have a significant relationship with strategy; however, processes and strategy are related. We discuss the possible implications of this study for SMEs.
Keywords
Innovation Capability; Food and Beverage SMEs; Ecuador.
Introduction and Literature Review
Innovation has generated many opportunities for firms not only to enhance business operations and competitive advantage but also to embark on new business ventures (Forsman, 2011). In addition, innovation is an vital organizational capacity, since the achievement of new products improves sales and increases profits (Battor & Battor, 2010).
The ability to innovate is a critical success factor for the growth and future performance of firms, and it is seen as the only way to maintain their competitive advantage (Carayannis & Provance, 2008; Muller et al., 2005). According to Kim et al. (2018) the ability to innovate is determined by several aspects that include top management leadership, knowledge development (Branzei & Vertinsky, 2006; Saunila & Ukko, 2014), entrepreneurial orientation (Mohd Noor et al., 2017) and external networks (Jørgensen & Ulhøi, 2010; Kim et al., 2018; Liu et al., 2013). At the same time, organizational rigidity and insufficient resources can hinder innovation capacity (Kim et al., 2018).
On the other hand, tourism as a productive activity represents income and economic development in many countries and is an industry that affects social and cultural aspects (UNWTO, 2018).
Li et al. (2020) use a broader perspective to define tourism firms as those that can provide services to tourists. The Global Industry Classification Standard (GICS), developed by Morgan Stanley Capital International (MSCI) and Standard & Poor’s (S&P) for use by the global financial community, shows companies with “GIC Industries”, equal to 25301040, which are named “Restaurants” classified within “Hotels, Restaurants & Leisure”, equal to 253010 (MSCI, 2018).
This research investigated the relationship between leadership, strategy, marketing, processes, and external factors on the capacity for innovation. We chose the tourism SMEs (small and medium-sized enterprises) in Ecuador, where the activities related to tourism established include accommodations, tour operator services, transportation systems, recreation, and food and beverage services. We decided to analyze establishments dedicated to food and beverage activities, which represent 68% of the total number of companies in the tourist industry, followed by travel agencies (15%), hotels (13%), recreation and entertainment establishments (3%), and tourist transport companies (2%). Additionally, around 99% of food and beverage companies are micro and small companies (Ministerio de Turismo, 2019). Considering this background, it was vital to determine the innovation capability of this type of business, since it creates opportunities by allowing tourism firms to be more competitive (Durán-Sánchez et al., 2019).
Theoretical Background & Hypotheses Development
Leadership capability
Leadership is a process that affects people (Ebrahimi et al., 2016; Hogg, 2001; Jung, 2001), since, it is the ability to influence individuals to achieve objectives (Hongdao et al., 2019). Hongdao et al. (2019) point out that leadership is essential for the success and innovativeness of a firm.
Carreiro & Oliveira (2019) affirmed that leaders’ visions, combined with their ability to consider others’ feelings and personal needs, are strongly related to the adoption of important innovation. Other research results illustrate that wise leadership has positive effects on the performance of organizational innovation (Ding et al., 2019).
A research conducted by Eide et al. (2020) showed that personal motivation impacts the firm strategy through managers´ leadership behavior.
The findings of Khan et al. (2020) suggest that employees are inspired by leadership behavior in terms of creativity, individual considerations, openness to new ideas, future vision orientation that leads to the firm becoming innovative.
Leadership and management styles include various fundamental concepts that must be analyzed in order to identify how it impacts the innovation capacity of organizations. Therefore, this research displays the results regarding the role of leaders in terms of the trust they bestow in their collaborators and the support they provide to promote the development of knowledge within the organization, and whether they have established a flexible organizational structure that allows for the implementation of innovation strategies that can be adapted to changes in the environment (Fundibeq, 2015).
The following hypothesis is thus proposed.
H1 Leadership significantly influences innovation capability.
Strategy capability
An excellent organization develops its mission and vision and puts them into practice through a clear strategy geared towards different stakeholders. It analyzes how policies, plans, and objectives are deployed and communicated effectively at all levels of the organization (Fundibeq, 2015).
A business strategy includes formulating objectives and identifying policies to achieve these objectives. The strategic objectives are related to the expected results in the medium and long term. Strategic plans include how a company creates a competitive advantage or a “value proposition” (OECD, 2018). Thus, information about strategies, innovation goals, and results is valuable for investigating the success of strategies with respect to observed performance (OECD, 2018).
Management can impact a firm's capability to start innovation activities and obtain innovation results. Though research has identified a variety of management capabilities that can be related to innovation results, this article focuses on identifying whether priorities are defined and whether resources have been allocated for research, innovation, creativity, and improvement activities. Moreover, it focuses on identifying if the strategy is consistent with the mission, vision, and values, and based on the needs and expectations of the stakeholders, and finally whether the strategic objectives are deployed through operational plans structured in actions with the allocation of managers, resources, deadlines for their execution, and indicators for their evaluation and monitoring (Fundibeq, 2015).
Therefore, hypothesis is presented as follows.
H2 Strategy significantly influences innovation capability.
Processes capability
Gault (2018) defines product innovation as “an available product made for potential users that is new or significantly modified with respect to its characteristics or intended use”. The author also emphasizes the relationship between product innovations and processes, resulting from the implementation of significant changes in delivery processes, which includes changes in infrastructure of the firm. This process refers to the product cycle, which begins from creativity, development and market introduction followed by a diffusion process supported by marketing strategies.
According to the Oslo manual (2018) process innovation refers to a new or improved process of one or more functions that changes significantly from the processes that the company has usually developed (OECD, 2018).
This article examines whether companies carry out process innovations permanently and continuously by involving people, suppliers, and clients to achieve process improvement. We analyze to determine whether leaders define, communicate, and train people in the application of processes in order to establish the relationship between these facilitating factors and the capacity for innovation (Fundibeq, 2015).
The following hypothesis is thus proposed.
H3 Processes significantly influence innovation capability.
Marketing capabilities
Marketing capabilities are guidelines of knowledge and activities through which firms transform inputs into value proposals demanded by clients (Morgan et al., 2012; Slotegraaf & Dickson, 2004). These capabilities are linked to other organizational and multifunctional activities. For example, a firm's market learning capability may be based on sales activities, branding, and customer service activities (Cannella et al., 2008; Day, 1994). Huhtala et al. (2014) affirm that market orientation, as part of marketing capabilities, significantly affects innovation capabilities.
Morgan et al. (2012) studied British companies and found out that firms with strong product development tend to seek efficiency. Efficient companies with strong product development capabilities demonstrate an exploratory trend towards marketing differentiation. These companies seem to have successfully combined efficiency and innovation (Hsu et al., 2013; Raisch & Birkinshaw, 2008).
In this study, the marketing capabilities refer to a company’s ability to develop innovative business practices to promote services and disseminate the corporate image through advertising (including aspects related to communication channels) in order to convey the value proposition and evaluate the impact of marketing strategies and commercial actions.
The following hypothesis is thus proposed.
H4 Marketing significantly influences innovation capability.
External Factors
The vision of innovation systems emphasizes the importance of the external environment when conceptualizing the innovation activities of firms as an integral part of the political, social, organizational, and economic systems (Edquist, 2010; Granstrand et al., 1997; Pavitt, 1995; Rothberg, 1995). These external factors can impact the firms´ incentives to innovate. External factors are also identified and evaluated in order to define a commercial strategy or a public policy with the participation of the government and other public interest groups (OECD, 2018).
According to the Manual (2018), the legal framework influences the decisions of firms to implement innovation processes, which motivate or discourage investments in innovation, while the tax system impacts the cost of the firms' activities. On the other hand, the public sector has an important role in supporting companies through public policies that encourage innovation. The public sector can also provide infrastructure services, macroeconomic policies, labor market policies and credit incentives with low interest rates (OECD, 2018).
In addition, regulation could include the application of standards by government authorities to influence market and the behavior of private sector (OECD, 1997). In that sense, regulations can impact the innovation activities of firms, including regulations on trade, tariffs, interest rates and employment (Blind, 2016). Economic policies implemented by governments influence the company's plans for its innovation activities (OECD, 2018).
Considering this approach, the following hypothesis is formulated.
H5 External factors significantly influence innovation capability
Research Methodology
Sample
The focus of this article is the tourism sector, focused on food and beverage establishments in Quito, the capital of Ecuador. In this context, 2,535,000 tourists traveled to Ecuador in 2018 according to data from the World Economic Forum (Kolb, 2018). In 2018, the tourism increased and reflected a positive balance of revenue and expenses of 1,332.3 million US dollars according to data obtained from the Balance of Payments at the Central Bank of Ecuador. In addition, tourism contributed 2,392 million dollars to the Ecuadorian economy, making it the country’s third-highest source of non-oil income after bananas and shrimp (Ministerio de Turismo, 2019).
According to the Ministry of Tourism, there are 5,073 tourist establishments related to accommodation activities, travel agencies, transportation, and food and beverage services. The study population of this research was made up of 3,422 food and beverage establishments— that is, 68% of tourist businesses.
As shown in Table 1, there are 10 large and medium-sized companies, 542 small companies, and 2,870 microenterprises. This information is relevant because our study focused on small and microenterprises that represent 99.7% of the total population. Based on the previous information, the sample was randomly calculated considering the food and beverage SMEs of the tourism sector, which is representative of the population.
| Table 1 Self-Weighted Population | |||
| Tourist activity | Large/Medium | Small | Microenterprises |
| Food and beverage | 10 | 542 | 2870 |
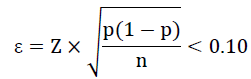
The calculation of the sample size is one aspect that needs to be specified in the early stages of a research project and determines the degree of credibility given to the obtained results. In this case, since surveys were conducted for data collection, we expected a margin of error when collecting the information. However, that margin was less than 10% (ε < 0.10) at 95% confidence, so the necessary sample size was conditioned by the following:
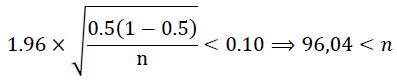
A sample size n = 137 was used, and after correcting the margin of error; since it is a finite population (N = 3422), our margin of error was 8.2%, which is acceptable for this type of study. Table 2 shows the distribution of the sample according to size.
| Table 2 Technical Data Sheet | ||
| Tourist activity | Small | Microenterprises |
| Food and beverage | 23 | 114 |
The chosen research methodology was a questionnaire that was validated by experts in the area. The data collection process was carried out between May and December 2018. During this time, the establishments were contacted to coordinate the visit. The data collection took place in person by visiting the establishments and obtaining responses from the managers or administrators. A total of 137 surveys were completed, which represents 100% of the sample size.
Measurement
The model used in this research was the Ibero-American Model of Management Excellence (Fundibeq) and the Oslo Manual. Fundibeq aims to evaluate the management of organizations by identifying their strengths and areas for improvement to establish progress plans and serve as information for development and strategic planning (Fundibeq, 2015). Meanwhile, the guidelines of the Oslo Manual were useful for determining the impact of certain environmental factors on the innovations of the establishments (OECD, 2005).
The Fundibeq Model proposes five facilitating processes:
1) leadership and management style;
2) strategy;
3) people development;
4) resources, suppliers, and alliances;
5) processes and clients
This research used the processes of leadership, strategy, and processes, and incorporated the marketing variable in order to discover the relationship between these variables and the innovation capability of organizations.
For these measured variables, people were surveyed to indicate how often the items raised in the questionnaire were carried out, using a response scale of 1 (never) to 5 (always and completely). With these answers, we aimed to determine how these facilitating processes affect the innovation capability of the establishments. Additionally, questions related to environmental factors were incorporated in order to determine those external factors that hinder innovation, for which a scale from 1 (high) to 3 (low) was established.
Structural Equations Modeling
Structural Equations Modeling (SEM) consists of several multivariate regression analysis techniques, which are used to establish models that allow one to analyze structural relationships. In essence, it is about making an estimate of the relationships that exist between variables whose measurements cannot be taken directly. They are called latent variables, but there are a series of criteria that describe them that can be directly measured (through surveys, for example), and these are called observable variables. This technique is the combination of factor analysis and multiple regression analysis and is used to analyze the structural relationship between measured variables and latent constructs.
The data was analyzed using SEM, a technique that has received great attention in recent years, especially in the area of health and social sciences. One of the reasons for this is that SEM estimates multiple and interrelated dependence in a single analysis (Esposito Vinzi et al., 2010; Henseler et al., 2009).
Table 3 presents a summary of the variables considered in this research by grouping the observable variables that were directly measured through the surveys with the corresponding latent variables.
| Table 3 Summary of the Variables | ||
| Abbreviation | Observable Variables | Latent Variables |
| Ex1 | Financing | External Factors |
| Ex2 | Qualified personnel | |
| Ex3 | Potential market | |
| Ex4 | Economy | |
| Ex5 | Social change | |
| Ex6 | Substitutes available | |
| L1 | Leadership: management system | Leadership |
| L2 | Leadership: flexible organizational structure | |
| L3 | Leadership: inspiring confidence | |
| L4 | Leadership: decisions based on reliable information | |
| S1 | Strategy: defining priorities | Strategy |
| S2 | Strategy: consistent | |
| S3 | Deploying the strategic objectives | |
| P1 | Process innovations | Processes |
| P2 | Stakeholders in process improvement | |
| P3 | Definition, communication, and training people | |
| M1 | Promotion | Marketing |
| M2 | Brand promotion | |
| M3 | Communication channels | |
| M4 | Impact of commercial actions | |
In this study, four structural equation models were proposed. The first of the models is shown in Figure 1, which states that innovation is determined by the facilitating factors of leadership, strategy, processes, and marketing. Given that these factors are internal to the company, they are independent of each other—that is, there are no relationships between them that affect their direct contribution to the variable of innovation.

Figure 1 Innovation Determined by Leadership, Strategy, Processes, and Marketing
For the second model, it was established that the variables are not necessarily independent. This has been reviewed in recent studies in which it has been shown that leadership influences the structural processes and strategies of an organization (Eva et al., 2018). Thus, a relationship between the variables of leadership, processes, and strategies was included in the model. Specifically, it was assumed that the strategies carried out by a company are influenced by both leadership and the effectiveness of the processes that are carried out. Figure 2 shows a schematic diagram for this model.

Figure 2 Innovation Determined by Leadership, Strategy, Processes, and Marketing, with the Relationship Between Leadership, Processes, and Strategies
Models 1 and 2 consider that innovation in an organization corresponds only to internal factors, and the variables that model it are inherent to internal processes. Nonetheless, there are a number of factors over which the organization does not have direct control, such as the country's economic policies or the presence of trained personnel in society. Instead, the company is only influenced by these factors and it adapts. Models 3 and 4 (Figures 3 & 4) are similar to Models 1 and 2 above, but we incorporated the perception of external factors as latent variables that affect innovation.

Figure 3 Innovation Determined by Leadership, Strategy, Processes, and Marketing, with the Influence of External Factors

Figure 4 Innovation Determined by Leadership, Strategy, Processes, and Marketing, with the Relationship Between Processes and Strategies, and the Influence of External Factors
The data was processed and ordered with SPSS software (version 20.0), and then the R software package (Rosseel, 2012), which provides an analysis of the SEM with a friendly syntax when running the models.
Results and Analysis
The process of analyzing structural equations can be explained as follows.
1. Two types of variables are assumed: observables xi y and latents Y.
2. Some latent variables are defined by observables.

3. A correlation is established between the latent variables, so that one of the variables is explained by the other variables.

In this study, we employed the following models:
In our first model, we propose that innovation is directly related to leadership, processes, strategies and marketing. For this model, we do not assume any kind of causality between the latent variables, and that the observed variables are not interrelated. The formulation of the model is given by:
Model 1: Innovation = Leadership + Processes + Strategies + Marketing
Leadership = L1 + L2 + L3 + L4
Processes = P1 + P2 + P3
Strategies = S1 + S2 + S3
Marketing = M1 + M2 + M3 + M4
For the second model, we maintain that innovation is directly related to leadership, processes, strategies and marketing. In addition, leadership and processes also have an indirect influence on innovation through the strategy; that is, we assume that causality exists between these latent variables The formulation of the model is given by:
Model 2: Innovation = Leadership + Processes + Strategies + Marketing
Leadership = L1 + L2 + L3 + L4
Processes = P1 + P2 + P3
Strategies = S1 + S2 + S3 + Leadership + Processes
Marketing = M1 + M2 + M3 + M4
For the third model that we considered, we added another variable to explain the innovation, one that refers to the external factors. In the region’s countries, for example Ecuador, macroeconomic policies exert a strong influence on all the managerial processes, since government changes usually imply changes to regulations and legal aspects. On the other hand, access to financing, qualified personnel in the labor market and social changes motivate or discourage innovation processes. Therefore, it is logical to incorporate the influence of external factors into this research:
Model 3: Innovation = Leadership + Processes + Strategies + Marketing + External Factors
Leadership = L1 + L2 + L3 + L4
Processes = P1 + P2 + P3
Strategies = S1 + S2 + S3
Marketing = M1 + M2 + M3 + M4
External Factors = Ex1 + Ex2 + Ex3 + Ex4 + Ex5 + Ex6
The last model that we considered is a modification of Model 3, in which we include an indirect influence of the processes on innovation through the strategies; that is, we assume causality between the variables of processes and strategies:
Model 4: Innovation = Leadership + Processes + Strategies + Marketing + External Factors
Leadership = L1 + L2 + L3 + L4
Processes = P1 + P2 + P3
Strategies = S1 + S2 + S3 + Processes
Marketing = M1 + M2 + M3 + M4
External Factors = Ex1 + Ex2 + Ex3 + Ex4 + Ex5 + Ex6
After performing the analyses in R for each of the proposed models, we obtained the results of convergence and adjustment for each model in order to determine how well the data are explained by the proposed models. Table 4 presents a summary.
| Table 4 Comparison of Convergence and Adjustment Between Models | ||||
| Model 1 | Model 2 | Model 3 | Model 4 | |
| Iterations to Ended Normally | 46 | 58 | 44 | 50 |
| Number of free parameters | 32 | 34 | 45 | 46 |
| Test statistic | 98.498 | 95.604 | 208.712 | 204.821 |
| Degrees of freedom | 73 | 71 | 165 | 164 |
| P-value (Chi-square) | 0.025 | 0.027 | 0.012 | 0.017 |
| Comparative fit index (CFI) | 0.986 | 0.986 | 0.978 | 0.98 |
| Root mean square error of approximation (RMSEA) | 0.05 | 0.05 | 0.044 | 0.042 |
Once the convergence of the models had been determined, a hypothesis test was carried out with two tails at a significance level of 0.05 in order to explain the correlation that exists between the innovation variable and the rest of the latent variables—that is, each one of the models is analyzed in order to determine to what extent innovation can be explained by leadership (Lea), processes (Pro), strategies (Str), marketing (Mark), and external factors (Ext). Table 5 presents the summary of comparison between the different models proposed, including the standard error (Std.Err).
| Table 5 Comparison Between Models for Innovation | ||||||||
| Latent Variables | Model 1 | Model 2 | ||||||
| Estimate | Std.Err | z-value | p-value | Estimate | Std.Err | z-value | p-value | |
| Lea | 1 | 1 | ||||||
| Pro | 0.941 | 0.118 | 7.952 | 0 | 0.911 | 0.229 | 3.978 | 0 |
| Str | 1.006 | 0.124 | 8.108 | 0 | -0.066 | 0.555 | -0.119 | 0.905 |
| Mark | 0.57 | 0.139 | 4.1 | 0 | 0.666 | 0.182 | 3.67 | 0 |
| Latent Variables | Model 3 | Model 4 | ||||||
| Lea | 1 | 1 | ||||||
| Pro | 0.933 | 0.117 | 7.98 | 0 | 0.68 | 0.136 | 5.001 | 0 |
| Str | 0.989 | 0.121 | 8.18 | 0 | 0.544 | 0.159 | 3.425 | 0.001 |
| Mark | 0.572 | 0.138 | 4.148 | 0 | 0.506 | 0.13 | 3.893 | 0 |
| Ext | -0.16 | 0.075 | -2.117 | 0.034 | -0.17 | 0.068 | -2.487 | 0.013 |
In Models 2 and 4, we proposed a causal relationship between the variables of strategy, processes, and leadership. It was assumed that strategy was influenced by both leadership and processes in Model 2, and only by processes in Model 4. Table 6 shows the results obtained.
| Table 6 Correlation Table Strategy: Processes and Leadership | ||||||||
| Strategy | Model 2 | Model 4 | ||||||
| Estimate | Std.Err | z-value | p-value | Estimate | Std.Err | z-value | p-value | |
| Pro | 0.358 | 0.18 | 1.994 | 0.046 | 0.308 | 0.109 | 2.824 | 0.005 |
| Lea | 0.533 | 0.299 | 1.783 | 0.075 | - | - | - | - |
Table 7 shows the statistical results of the variables involved.
| Table 7 Statistical Values from the Structural Equation Model Analysis | |||||
| Estimate | |||||
| Variables | Unstandardized | Standard | Variance | R2 | P(>|z|) |
| External Factors | |||||
| Ex1 | 1.000 | 0.584 | 0.399 | ||
| Ex2 | 1.206 | 0.634 | 0.838 | 0.402 | 0.000 |
| Ex3 | 1.033 | 0.616 | 0.676 | 0.380 | 0.000 |
| Ex4 | 0.701 | 0.488 | 0.610 | 0.238 | 0.000 |
| Ex5 | 1.063 | 0.598 | 0.787 | 0.358 | 0.000 |
| Ex6 | 1.281 | 0.705 | 0.643 | 0.497 | 0.000 |
| Leadership | |||||
| L1 | 1.000 | 0.388 | 0.726 | ||
| L2 | 1.142 | 0.907 | 0.291 | 0.822 | 0.000 |
| L3 | 0.695 | 0.733 | 0.430 | 0.537 | 0.000 |
| L4 | 0.744 | 0.759 | 0.419 | 0.577 | 0.000 |
| Process | |||||
| P1 | 1.000 | 0.236 | 0.821 | ||
| P2 | 0.953 | 0.882 | 0.281 | 0.778 | 0.000 |
| P3 | 0.753 | 0.670 | 0.756 | 0.449 | 0.000 |
| Strategy | |||||
| S1 | 1.000 | 0.402 | 0.661 | ||
| S2 | 1.099 | 0.894 | 0.238 | 0.799 | 0.000 |
| S3 | 1.049 | 0.851 | 0.330 | 0.723 | 0.000 |
| Marketing | |||||
| M1 | 1.000 | 0.479 | 0.777 | ||
| M2 | 1.095 | 0.942 | 0.254 | 0.887 | 0.000 |
| M3 | 1.149 | 0.978 | 0.100 | 0.957 | 0.000 |
| M4 | 1.132 | 0.980 | 0.090 | 0.960 | 0.000 |
| Innovation | |||||
| Lea | 1.000 | 0.289 | 0.719 | ||
| Pro | 0.933 | 0.771 | 0.440 | 0.595 | 0.000 |
| Str | 0.989 | 0.962 | 0.059 | 0.925 | 0.000 |
| Mark | 0.572 | 0.382 | 1.421 | 0.146 | 0.000 |
| Ext | -0.160 | -0.221 | 0.369 | 0.049 | 0.034 |
The structural equation model for the innovation is consistent with data, as shown in Figure 5, the graphical representation of the model with the unstandardized estimates for both observed and latent variables.

Figure 5 Innovation Determined by Leadership, Strategy, Processes, and Marketing, with the Influence of External Factors with Unstandardized Estimates
The external factors variable, as a latent variable that explains the innovation, presents an estimate of -0.221. The variables observed for this variable have a relatively high variance, in particular questions Ex2 and Ex5 that correspond to qualified personnel and social changes. This is explained by the differences in the types of establishments in the study. Likewise, the adjustment for the variable Ex4, which corresponds to the economy, stands out, since it presents the lowest value for R^2 (0.238). This corroborates that there is a high dispersion in the way different SMEs perceive how external factors affect them.
In the case of the variable “leadership”, its estimate is 1.000. The variance of the observables for this case is relatively lower, which indicates that among the companies in the study, there is a much more uniform criterion in terms of leadership. This highlights what was observed with L2 that refers to the flexibility of the organizational structure, whose R^2 is (0.822).
The variable “processes” has an estimated parameter of 0.771. In this case, the observable variables present little variance, except in the case of P3- related to the processes of communication- whose variance is 0.756 and R^2 is 0.449. This indicates that the communication is not standardized as part of the processes in the companies so there is greater variability from one company to another.
Regarding the strategies, the estimated value within the model for innovation is 0.962. The observables for this case present a relatively low variance, in particular S2 and S3, which indicates that having coherent strategies aligned with the objectives is fundamental.
Finally, the variable “marketing” presents an estimated parameter of 0.382. In this case, the observables present a low variance, in particular M3 and M4, which refer to the commercialization and impact of commercial actions. This indicates that the criteria of commercialization within the companies are quite uniform. Another observable that stands out is M1- related to promotion- which presents a variance of 0.479 and R^2 of 0.777, lower than the rest of the observables for this variable. This can be explained by the fact that companies have different criteria when establishing promotions as marketing strategies.
Discussion
This study offers a comprehensive understanding of the relationship between leadership, strategy, processes, marketing, external factors, and innovation in food and beverage SMEs.
In Table 4, regarding convergence of the models, we can see that the four models present p-values below 0.05, with Model 3 presenting the lowest value. As regards the number of iterations, for all the models, a fairly fast adjustment was reached before the 60 iterations. This indicates that the proposed models present good behavior, at least from a statistical point of view. However, particularly in the results shown in Table 4, it is evident that the four proposed models fit well with the prediction hypothesis of the innovation variable based on the rest of the latent variables. It is important to highlight two important values in the interpretation of the model. The first one is the comparative fit index (CFI), which reveals the fit of the proposed model by examining the discrepancy between the data and the hypothetical model. The CFI values ranged from 0 to 1, and the higher the value, the better the fit. The studies indicated that a value of 0.95 or higher is an indicator of good fit (Hu & Bentler, 1999).
When examining the CFI for the four proposed models, it is evident that the values are above 0.95, which indicates that all the models are well adjusted for predicting the innovation variable.
The second important value in Table 4 is the root mean square error of approximation (RMSEA). This index analyzes the discrepancy between the hypothetical model by estimating parameters chosen in the most advantageous way, and the sample covariance matrix, so it can infer if there is a problem in the sample size and the model. Values for the RMSEA ranged from 0 to 1, whereby smaller values indicated a better fit of the model; generally, a value less than 0.06 denoted that the model fit acceptably.
Upon examining the RMSEA, it was observed that the four models fit well for predicting innovation, especially Models 3 and 4, in which a latent variable of external factors was considered.
Table 5 shows in detail how the innovation variable behaved for each model. This variable is required for making predictions based on each of the latent variables—leadership, strategy, processes, and marketing. In the case of Model 1, it can be seen that, while all the variables are significant, only the marketing variable seems to have less influence, since it has a lower z value. Nevertheless, it is still a significant variable. These results are confirmed by Carreiro & Oliveira and Ding et al. (2019) who affirmed that the visions of leaders, combined with the ability to consider other’s feelings and personal needs, are related to the adoption of an important innovation. Similarly, the Oslo Manual mentions that process innovation, management, and strategy implementation capabilities can impact a company's ability to start innovation activities and create innovation results (OECD, 2018). Meanwhile, Huhtala et al. (2014) concluded that market orientation, as part of marketing capabilities, significantly impacts performance and innovation capabilities. In this way, Hypotheses 1, 2, 3, and 4 were corroborated.
Model 2 includes the relationship between strategy, processes, and leadership. The summary of this regression can be seen in Table 6, and it can be concluded that leadership does not have a significant relationship with strategy, but that processes and strategy are related. Hence, the p-value of the strategy variable in Model 2 is particularly high (0.905).
In Model 3, external factors were included as a variable that influences innovation. When reviewing the results for this model, Table 5 shows that all variables were significant when predicting innovation, including external factors whose p-value is 0.034. These findings are in line with those cited by Blind (2016), who indicated that regulations on product markets, financial affairs, and the labor market can affect the innovation activities of companies and industries (Blind, 2016). Likewise, the Oslo Manual indicates that the economic policies implemented by governments impact the firm's plans for its innovation activities (OECD, 2018).
Lastly, in Model 4, external factors were included, and it was also established that there was a relationship between strategies and processes. Table 6 shows how the relationship between strategy and processes was significant with a p-value of 0.005. On the other hand, in Table 5, the p-values show that all the variables involved were significant when predicting innovation. In this case, the strategy was related to the processes, and it could be supposed that it is not significant. Surprisingly, the model shows that it actually was. Likewise, external factors were more relevant for innovation in this case than in Model 3. Therefore, Hypothesis 5 was confirmed.
After analyzing the results obtained for each model, we can affirm that all the models have a good fit as models that describe the innovation. However, when observing the comparative tables (Tables 4 and 5), Model 3 stands out for presenting a better performance, so it will be developed into a structural equation model for the innovation capability of small business approaches focused on food and beverage SMEs in the tourism industry.
The management strategies applied in this type of company are strongly influenced by external factors, which is especially true in countries in this region where macroeconomic policies and adjustments in legislation are volatile in the short, medium and long term, affecting the innovation process in organizations, mainly SMEs.
In the context of food and beverage SMEs, the results of this study provide several managerial implications. First, these SMEs must review internal opportunities for innovation, principally in areas related to market strategies, such as promotion and communication, and also prepare to deal with changes from external factors.
Conclusion
The studies of the food and beverage sector have focused on Europe, Asia, and North America, whereas those exploring developing countries are scarce. This research in Ecuador represents an academic contribution to the field of innovation capability in SMEs.
A change in the world implies that firms in Latin America must reformulate their growth strategy. They must innovate processes to enhance firms’ productivity. This requires an important review of public policy, especially regarding factors that contribute to a firm’s productivity and growth, such as innovation, entrepreneurship, and investment in human capital.
Regarding the role of governments, they can implement the necessary measures to protect SMEs and enable them to deal with environmental factors related to the economy, financing, and market and social change. In this matter, access to credit is essential because it improves firms’ liquidity so that they can provide innovative services.
The next lines of research should not only analyze and evaluate the effectiveness of different policy measures on business activity, but also attempt to understand the effect of the response to economic crises.
Regarding the role of SMEs in the food and beverage sector, they have an opportunity in terms of innovation to redesign their strategies, processes, and marketing that permit them to innovate their business model according to the new reality and market needs. Additionally, companies can be successful in developing innovation by investing in human capital and establishing systems that allow the members of the organization to participate, which simultaneously motivates and rewards the process of generating ideas and creativity.
Future lines of research could generate knowledge about innovation and evaluate how innovation affects companies’ performance and results.
References
- Battor, M., & Battor, M. (2010). The impact of customer relationship management capability on innovation and performance advantages: testing a mediated model. Journal of Marketing Management, 26(9-10), 842-857.
- Blind, K. (2016). The impact of standardisation and standards on innovation. In Handbook of Innovation Policy Impact. Edward Elgar Publishing.
- Branzei, O., & Vertinsky, I. (2006). Strategic pathways to product innovation capabilities in SMEs. Journal of Business Venturing, 21(1), 75-105.
- Cannella, B., Finkelstein, S., & Hambrick, D.C. (2008). Strategic leadership: Theory and research on executives, top management teams, and boards. Oxford University Press.
- Carayannis, E.G., & Provance, M. (2008). Measuring firm innovativeness: towards a composite innovation index built on firm innovative posture, propensity and performance attributes. International Journal of Innovation and Regional Development, 1(1), 90-107.
- Carreiro, H., & Oliveira, T. (2019). Impact of transformational leadership on the diffusion of innovation in firms: Application to mobile cloud computing. Computers in Industry, 107, 104-113.
- Day, G.S. (1994). The capabilities of market-driven organizations. Journal of Marketing, 58(4), 37-52.
- Ding, W., Choi, E., & Aoyama, A. (2019). Relational study of wise (phronetic) leadership, knowledge management capability, and innovation performance. Asia Pacific Management Review, 24(4), 310-317.
- Durán-Sánchez, A., Álvarez-García, J., del Río-Rama, M.D.L.C., & Rosado-Cebrián, B. (2019). Science mapping of the knowledge base on tourism innovation. Sustainability, 11(12), 2015-2030.
- Ebrahimi, P., Moosavi, S.M., & Chirani, E. (2016). Relationship between leadership styles and organizational performance by considering innovation in manufacturing companies of Guilan Province. Procedia-Social and Behavioral Sciences, 230, 351-358.
- Edquist, C. (2010). Systems of innovation perspectives and challenges. African Journal of Science, Technology, Innovation and Development, 2(3), 14-45.
- Eide, A.E., Saether, E.A., & Aspelund, A. (2020). An investigation of leaders’ motivation, intellectual leadership, and sustainability strategy in relation to Norwegian manufacturers’ performance. Journal of Cleaner Production, 254, 120053.
- Esposito Vinzi, V., Chin, W.W., Henseler, J., & Wang, H. (2010). Handbook of partial least squares: Concepts, methods and applications. Heidelberg, Dordrecht, London, New York: Springer.
- Eva, N., Sendjaya, S., Prajogo, D., Cavanagh, A., & Robin, M. (2018). Creating strategic fit: Aligning servant leadership with organizational structure and strategy. Personnel Review, 47(1), 166-186.
- Forsman, H. (2011). Innovation capacity and innovation development in small enterprises. A comparison between the manufacturing and service sectors. Research policy, 40(5), 739-750.
- Fundibeq. (2015). Retrieved February 20, 2020, from https://www.fundibeq.org/modelo-excelencia
- Gault, F. (2018). Defining and measuring innovation in all sectors of the economy. Research Policy, 47(3), 617-622.
- Granstrand, O., Patel, P., & Pavitt, K. (1997). Multi-Technology corporations: Why they have distributed rather than distinctive core competencies. California Management Review, 39(4), 8-25.
- Henseler, J., Ringle, C.M., & Sinkovics, R.R. (2009). The use of partial least squares path modeling in international marketing. In New challenges to international marketing. Emerald Group Publishing Limited.
- Hogg, M.A. (2001). A social identity theory of leadership. Personality and Social Psychology Review, 5(3), 184-200.
- Hongdao, Q., Bibi, S., Khan, A., Ardito, L., & Nurunnabi, M. (2019). Does what goes around really comes around? The mediating effect of CSR on the relationship between transformational leadership and employee’s job performance in law firms. Sustainability, 11(12), 3366.
- Hsu, C.W., Lien, Y.C., & Chen, H. (2013). International ambidexterity and firm performance in small emerging economies. Journal of World Business, 48(1), 58-67.
- Hu, L., & Bentler, P.M. (1999). Cutoff criteria for fit indexes in covariance structure analysis: Conventional criteria versus new alternatives. Structural Equation Modeling, 6(1), 1-55.
- Huhtala, J.P., Sihvonen, A., Frösén, J., Jaakkola, M., & Tikkanen, H. (2014). Market orientation, innovation capability and business performance: Insights from the global financial crisis. Baltic Journal of Management, 9(2), 134-152.
- Jørgensen, F., & Ulhøi, J.P. (2010). Enhancing innovation capacity in smes through early network relationships. Creativity and Innovation Management, 19(4), 397-404.
- Jung, D.I. (2001). Transformational and transactional leadership and their effects on creativity in groups. Creativity Research Journal, 13(2), 185-195.
- Khan, A., Bibi, S., Lyu, J., Garavelli, A.C., Pontrandolfo, P., & Perez Sanchez, M.D.A. (2020). Uncovering Innovativeness in Spanish Tourism Firms: The Role of Transformational Leadership, OCB, Firm Size, and Age. Sustainability, 12(10), 3989.
- Kim, M.K., Park, J.H., & Paik, J.H. (2018). Factors influencing innovation capability of small and medium-sized enterprises in Korean manufacturing sector: facilitators, barriers and moderators. International Journal of Technology Management, 76(3-4), 214-235.
- Kolb, R.W. (2018). The Sage encyclopedia of business ethics and society. SAGE Publications.
- Li, J., Feng, Y., Li, G., & Sun, X. (2020). Tourism companies' risk exposures on text disclosure. Annals of Tourism Research, 84, 102986.
- Liu, X., Shou, Y., & Xie, Y. (2013). The role of intermediary organizations in enhancing the innovation capability of MSMEs: evidence from a Chinese case. Asian Journal of Technology Innovation, 21(sup2), 50-61.
- Ministerio de Turismo. (2019). Retrieved from February 4, 2019, from http://www.turismo.gob.ec/ejes-estrategicos/
- Mohd Noor, N.A., Muhammad, A., Aljanabi, A.Q.A., & Ku Ishak, A. (2017). The significant role of entrepreneurial orientation in fostering technological innovation capabilities among small and medium-sized manufacturing enterprises.
- Morgan, N.A., Katsikeas, C.S., & Vorhies, D.W. (2012). Export marketing strategy implementation, export marketing capabilities, and export venture performance. Journal of the Academy of Marketing Science, 40(2), 271-289.
- MSCI. (2018). Retrieved from https://www.msci.com/gics
- Muller, A., Välikangas, L., & Merlyn, P. (2005). Metrics for innovation: Guidelines for developing a customized suite of innovation metrics. Strategy and Leadership, 33(1), 37-45.
- OECD. (2018). Presentación Oslo Manual 2018. Retrieved from https://www.oecd.org/sti/inno/oslo-manual-2018-info.pdf
- OECD. (1997). The OECD report on regulatory reform. Retrieved from https://doi.org/10.1787/9789264189751-en
- OECD. (2005). Oslo Manual. Retrieved from https://doi.org/10.1787/9789264013100-en
- Pavitt, K. (1995). National Systems of innovation: Towards a theory of innovation and interactive learning: Bengt-Ake Lundvall. Research Policy, 24(2), 320-320.
- Raisch, S., & Birkinshaw, J. (2008). Organizational ambidexterity: Antecedents, outcomes, and moderators. Journal of Management, 34(3), 375-409.
- Rosseel, Y. (2012). Lavaan: An R package for structural equation modeling and more. Journal of Statistical Software, 48(2), 1-36.
- Rothberg, R. (1995). National innovation systems: A comparative analysis by Richard R. Nelson, Editor. New York: Oxford University Press.
- Saunila, M., & Ukko, J. (2014). Intangible aspects of innovation capability in SMEs: Impacts of size and industry. Journal of Engineering and Technology Management, 33, 32-46.
- Slotegraaf, R.J., & Dickson, P.R. (2004). The paradox of a marketing planning capability. Journal of the Academy of Marketing Science, 32(4), 371-385.
- UNWTO. (2018). UNWTO. Retrieved July 5, 2020, from https://www.unwto.org/es/glosario-terminos-turisticos