Research Article: 2019 Vol: 22 Issue: 3
The Perception of Poor People from the Canton of Cuenca-Ecuador on Corruption (2010-2017 Period)
Luis Tobar-Pesántez, Universidad Politécnica Salesiana del Ecuador
Santiago Solano-Gallegos, Universidad Politécnica Salesiana del Ecuador
Abstract
Historically, poverty has been discussed around the world from different perspectives. However, we all agree that poverty does not only mean a lack of monetary resources which impede people and their families to acquire goods and services to meet their primary needs, its definition goes beyond that, it is about discovering if families have access to health, basic services, good education, a decent home, if they are exposed to insecurity, if they are affected by corruption, and so on. In this regard, since 2010 Universidad Politécnica Salesiana in partnership with Universidad Silva Enriquez de Chile has conducted research about poor people’s perception of a group of fourteen rights and needs in the city of Cuenca-Ecuador. This research presents, according to the country’s current situation, the results of the indicator that measures the perception of corruption. The longitudinal study is based on the application of a structured survey on a representative sample with a high confidence level. The analysis demonstrates that vulnerable sectors have historically been affected by corruption both in the public and private sector.
Keywords
Corruption, Poverty, Cuenca, Ecuador.
Introduction
Commonly, the most vulnerable sectors are the least examined in public policies and are not taken into account to analyze their most relevant problems and learn more about what mainly affects them. Although poverty levels in Ecuador have decreased, it still affects a big part of the population. Since Universidad Politécnica Salesiana’s research group on the perception of the socioeconomic reality in Cuenca (IPSEC for its acronym in Spanish) annually monitors the perception of people from poor sectors in the city regarding fourteen indicators. One of the indicators is “corruption”, which will be studied in this paper (Salama & Valier, 1995).
Income poverty is a synonym of scarcity and deprivation that limits a person to having a minimum standard of living. In this context, it is possible to define a poor person as someone whose total per capita income is lower than the poverty threshold or poverty line, which is considered the minimum level of income a person needs in order to be considered poor.
In June 2018, Ecuador, a country with over 16 million inhabitants (INEC, 2017), had an income poverty rate of 24.5% and extreme poverty 9%. This data demonstrates a decrease since the year 2010, when the income poverty rate was 32.8% and extreme poverty 13.1% (INEC, 2018).
On the other hand, the city of Cuenca has been declared the canton with the best living standards in the country (INVEC, 2013). Its population is approximately 600,000 inhabitants (INEC, 2017). The income poverty rate indicators decreased from 9.7% in 2010 to 2.1% in June 2018 and the extreme poverty rate from 2.9% to 0.2% during a similar period (INEC 2018).
For the purpose of this study, if a person earns $84.72 a month, they are considered poor. If they receive $47.74 a month, they are considered extremely poor people (INEC, 2018). Accordingly, for eight years our research has been conducted in homes belonging to this part of the population; in average they are made up of 4 people with the conditions described above.
Additionally, in this segment of the population we have thoroughly analyzed the perception of corruption from different aspects: the general perception of corruption in the country, the main causes of corruption, its consequences and the most affected sectors, institutions affected by corruption in the public and private sector and alternatives to confront it. All this, we repeat, from the perspective of the most vulnerable sectors.
It is clear that poverty is neither a local nor regional, not even a national, phenomenon. The plague of corruption reaches global proportions and its effects are undoubtedly devastating, to the degree of bringing down people’s dignity and making they commit inappropriate actions. A corrupt person does not respect any type of ethical norm, even if it affects his/her own dignity and has negative effects in the environment that surround him/her. Corruption is every day news in the media; it is a conversation topic in offices and companies, where everyone from workers to directors make a comment.
Corruption is not exclusive of the public sector. However, since it is considered a crime against public trust, its impact on the media is much more evident due to accusations from different bodies, especially those of political convenience. Nevertheless, the private sector is not free from corruption and its implications are no less dramatic, even though the impact on the media is much lower and its effects are more focused.
Literature Review
A topic which is constantly debated on at every level is unquestionably corruption, which in general terms can be understood as a violation of a commitment or an obligation by someone with decision making capacity in order to obtain personal benefit (Lopez, 1999). In this regard, many authors have analyzed the problem of defining corruption, classifying corrupt practices and measuring the impact of corruption in a specific society. Other authors have focused on corruption as a variable that affects general wellbeing and so they have studied the effect of this phenomenon in different economic variables (Arjona, 2002). Several studies state that corruption has a direct relation with the functioning of economic systems.
The negative effect of corruption in economic development is evident. However, there is no clear evidence that shows the exact reason it occurs. In his research, Lambsdorff (2003) analyzed how corruption affects capital flows and how this affects productivity (Sanchez, 2007).
Corruption affects a country’s economy because it limits foreign investment due to the lack of confidence in institutions. Furthermore, there is the certainty that corruption affects all and particularly the most vulnerable sectors, in other words, the poorest people.
Other studies point out the
“Relationship between corruption and economic growth, a variable which alone does not explain the reduction of poverty, but is a good indictor to compare the results of the improvement of wellbeing. According to the World Bank, when a country has a lower impact of corruption (higher index), it does not necessarily mean it is doing better than countries with a higher impact of corruption” (Dinero, 2015)
But it will probably have greater opportunities of growth. In this context, there are a number of worldwide organizations that study corruption and develop a series of indicators that enable comparisons within a same country in a specific period, as well as between countries of common regions. This is useful to deepen interrelationships. We will now review some of these organizations.
Transparency International: This organization, created in 1995, measures the perception of corruption that exists in the public sector of different countries by calculating an index that provides a score between 0 (most corrupt) and 100 (least corrupt). To collect data, it uses surveys that gather analyses of experts and company directors of each country. In 2017, it studied 180 countries (Transparency International, 2018).
This index faces a controversy regarding diversity in terms of the origin of the data and the analysis methodology, which did not enable comparisons in 2012 (Sánchez, 2017 & 2007). However, this index is a global benchmark indicator on corruption and to some extent its results are related to the findings of this research. A summary of this index with respect to countries from this region is presented in Table 1 below: Index of the perception of corruption.
| Table 1: Corruption Perception Index Of South American Countries Period 2010-2017 | ||||||||
| Country | 2010 | 2011 | 2012 | 2013 | 2014 | 2015 | 2016 | 2017 |
| Uruguay | 24 | 25 | 20 | 19 | 21 | 21 | 21 | 23 |
| Chile | 21 | 22 | 20 | 22 | 21 | 23 | 24 | 26 |
| Brazil | 69 | 73 | 69 | 72 | 69 | 76 | 79 | 96 |
| Colombia | 78 | 80 | 94 | 94 | 94 | 83 | 90 | 96 |
| Argentina | 123 | 129 | 105 | 106 | 107 | 107 | 95 | 85 |
| Peru | 78 | 80 | 83 | 83 | 85 | 88 | 101 | 96 |
| Bolivia | 110 | 118 | 105 | 106 | 103 | 99 | 113 | 112 |
| Ecuador | 127 | 120 | 118 | 102 | 110 | 107 | 120 | 117 |
| Paraguay | 146 | 154 | 150 | 150 | 150 | 130 | 123 | 135 |
| Venezuela | 164 | 172 | 165 | 160 | 161 | 158 | 166 | 167 |
Data organized according to the 2017 results
Source: Transparency International
Created by: The authors
On the hand, Verisk Maplecroft, a global risk and strategic consulting firm, evaluated and classified 198 economies on the prevalence of bribery and the effectiveness of the efforts to fight against it. The firm classifies countries with the best and worst performance through a corruption index, which is an important tool that allows investors to have an overview of corruption worldwide (Verisk, 2017).
The World Bank also analyzes global corruption through an index of transparency, accountability and corruption in the public sector. In 2017, it analyzed 113 countries and according to its calculations corruption adds 10% to business costs worldwide, which is equal to 1 billion dollars in bribery a year (World Bank, 2017).
The Business Pulse survey, applied to over 600 executive directors in Latin America, revealed that one of the main concerns of business people in the region is corruption, which they believe is one of the factors that hinders the development of companies. It also presented the deficiencies of democratic institutions in general (Espectador, 2017).
In the country there only a few studies on corruption based on the perception of people from the most vulnerable sectors of society. The Study Center for bribery, extortion and coercion in Quito, led by Bruce Horowitz, promotes ideas to stop corruption and in a recent study on "rural women in situations of extortion by public officials", among other results of the survey that was applied to 308 Ecuadorian women in rural areas, it showed that 56.8% had been extorted at least once by a public official and 77% of them considered that extortion is a problem in their lives (Santos, 2018).
The accusations regarding corruption have reached alarming levels in the country and have become worse day after day; there is much estimation on the costs of this wrongdoing. It is estimated that in the last 10 years, the cost is well over 35,000 million dollars as a result of bribes, over pricing in public contracts, tax evasion, commissions on oil exports and imports of derived products, public debt and current expenditure, and others (Universo, 2017).
These estimations stand out since historically poor sectors have been the most affected by corruption, not only in Ecuador but worldwide.
Methodology
The sampling unit is defined by homes, where at least one person who is 15 or older lives in conditions of poverty, located in urban sectors of the city of Cuenca. Members of the Research Group on the Perception of the Socioeconomic Reality in the city of Cuenca (IPSEC for its acronym in Spanish), from Universidad Politécnica Salesiana, is in charge of collecting the information.
The sample size amounts to 400 observations, calculated with a confidence level of 95% and with an error tolerance level of +/-4.7%, based on the following formula (Hernández et al., 2014):
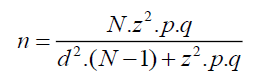
Where:
n: simple size.
N: population.
z: security coefficient (variance).
p: expected proportion.
q: (1-p) confidence percentage.
d: maximum tolerable error.
A survey with 40 questions (direct and indirect, with spontaneous and assisted responses), was applied by interviewers on weekends in each of the randomly selected homes. Simultaneously, the information was verified through an on-site supervision process. Subsequently, monitoring is done by telephone, and this exceeds 70% of the effective verification of the sample. The total of the identified data and characterization of the subjects are audited, in addition to a representative percentage of the survey questions (Yañez, 2014). The surveys are applied annually in the month of November.
To analyze each one of the questions, the instrument was applied to the same number of survey respondents (400 observations).
Results
The most relevant results are:
General Results
The results presented in the following tables have been organized in a descending manner according to the year that was reviewed last (2017).
Question 1. Current corruption level in Ecuador
The answers to this first question are evident and maintain their trend during the analyzed period; most respondents perceive that the level of corruption in the country is high and very high standing at 81.1% in 2017, having evolved from 2010 with 78.8%. On the other hand, only 2.8% of respondents feel that it is low and very low (Table 2).
| Table 2: Current Corruption Level In Ecuador | |||||||||
| Year | 2010 | 2011 | 2012 | 2013 | 2014 | 2015 | 2016 | 2017 | |
| Very high | 36,1% | 34,1% | 25,0% | 29,5% | 28,9% | 29,3% | 37,2% | 44,0% | |
| High | 42,7% | 43,0% | 53,5% | 35,7% | 39,8% | 42,2% | 36,9% | 37,1% | |
| Neither high nor low | 11,2% | 16,9% | 12,3% | 22,3% | 20,9% | 20,8% | 18,3% | 15,3% | |
| Low | 5,6% | 5,1% | 6,5% | 8,9% | 6,2% | 5,5% | 5,7% | 2,0% | |
| Very low | 1,6% | 0,5% | 1,8% | 1,9% | 2,1% | 0,3% | 1,3% | 0,8% | |
| Doesn’t know | 2,8% | 0,5% | 0,8% | 1,7% | 2,1% | 1,9% | 0,5% | 0,8% | |
| High and very high | 78,8% | 77,1% | 78,5% | 65,2% | 68,7% | 71,5% | 74,1% | 81,1% | |
| Low and very low | 7,2% | 5,6% | 8,3% | 10,8% | 8,3% | 5,8% | 7,0% | 2,8% | |
Source: Surveys from 2010-2017
Created by: The authors
In this country, corruption is the subject of debates and accusations in several political sectors on a daily basis. Just recently, in March 2018 the National Assembly denied the intervention of the UN to investigate corruption of the last ten years, despite the offer of the current president to request the United Nations the creation of a commission for this purpose. (Universo, 2018).
Question 2. Activities that can be considered corruption
Question 2 asked respondents about the activities they considered were corrupt. According to the results from Table 3, every year except for 2012 the main practice of corruption perceived by people was influence peddling in the judicial system, where it is possible to manipulate court decisions. This coincides with the statements from a former legal secretary who was asked to testify in the National Assembly and said that:
| Table 3 : Activities That Can Be Considered Corruption | |||||||||
| Year | 2010 | 2011 | 2012 | 2013 | 2014 | 2015 | 2016 | 2017 | |
| Having a friend in court to help with court decisions | 76,1% | 55,8% | 34,2% | 48,8% | 47,8% | 42,8% | 34,4% | 51,3% | |
| A politician that proposes a law to benefit a company or his/her own interests | 69,3% | 46,1% | 30,7% | 31,5% | 32,9% | 31,9% | 33,3% | 40,3% | |
| Provide privileged information to companies in return for money | 67,2% | 41,1% | 24,5% | 28,1% | 25,6% | 28,6% | 23,9% | 36,7% | |
| That a public servant hire a family member for a public position | 71,4% | 47,1% | 29,1% | 29,1% | 29,5% | 38,3% | 29,7% | 33,3% | |
| Using state owned goods such as cars, departments, etc. for personal purposes | 71,0% | 40,1% | 38,3% | 24,8% | 32,1% | 33,1% | 25,6% | 32,8% | |
| That a public servants create favorable working conditions for themselves or third parties | 65,3% | 39,1% | 29,1% | 20,7% | 25,6% | 31,7% | 26,1% | 29,5% | |
| That a police officer or a judge ask people for money and not fairly apply the law | 69,1% | 47,6% | 35,1% | 31,0% | 21,7% | 24,4% | 27,2% | 28,5% | |
| That a public servant influences the purchase of goods or services to benefit third parties | 70,5% | 42,5% | 25,3% | 19,7% | 19,8% | 23,6% | 16,9% | 28,2% | |
| That a public servant receives money or gifts to facilitate processes | 69,3% | 53,9% | 25,5% | 25,2% | 30,0% | 23,9% | 25,8% | 24,4% | |
| Having a friend who is doctor and provides certificates when people want to be absent from work | 65,6% | 44,2% | 26,1% | 20,7% | 24,5% | 23,9% | 20,0% | 24,4% | |
| Other | 0,7% | 1,7% | 10,9% | 3,8% | 0,8% | 0,8% | 1,4% | 4,1% | |
Source: Surveys from 2010-2017
Created by: The authors
“There has been judicial corruption in the last decade, which has harmed the national government and is something to worry about” (Telégrafo, 2018).
Other corrupt activities perceived by people who were surveyed were: political favors, access to privileged information, public contracts with friends and family and the use of public resources.
The truth is that almost all the questions are about corruption in the public sector. However, it worth highlighting the last question, which although has the lowest percentage, is significant and deals with corruption activities which do not necessarily involve the public sector; 24.4% of the people who were surveyed (2017) believe that obtaining fake medical certificates to be absent to work is corruption.
Question 3. Causes of corruption in Ecuador
Question 3 is about the causes of corruption in Ecuador. Table 4 presents the main causes of corruption: ambition, lack of values and transparency. Other respondents, with lower percentages, believe the origin of corruption is due to low wages, concentration of business power and the lack of control. In 2000 for example, in the midst of one of the greatest financial crisis of Ecuador which resulted in dollarization, Transparency International placed Ecuador in the “unfortunate first place” as the most corrupt country in Latin America after a number of corruption cases that involved family members and close collaborators of the then president went public (Ruiz, 2017).
| Table 4: Causes Of Corruption In Ecuador | ||||||||
| Year | 2010 | 2011 | 2012 | 2013 | 2014 | 2015 | 2016 | 2017 |
| Personal ambition | 43,9% | 46,3% | 35,3% | 37,6% | 42,1% | 40,3% | 39,9% | 46,4% |
| Lack of values | 50,5% | 42,4% | 41,6% | 41,6% | 43,3% | 36,4% | 39,9% | 37,0% |
| Lack of transparency in political decisions | 22,2% | 15,9% | 11,1% | 20,3% | 25,1% | 23,6% | 26,9% | 31,6% |
| Inefficient judicial system | 31,5% | 34,9% | 7,7% | 24,2% | 26,7% | 24,9% | 23,4% | 31,1% |
| Lack of transparency in money accounts | 16,6% | 9,0% | 4,8% | 18,2% | 19,2% | 15,9% | 19,6% | 28,6% |
| Lack of control in the public sector | 24,1% | 17,1% | 8,8% | 23,0% | 14,9% | 15,1% | 16,6% | 22,7% |
| Too much power of businesses | 17,3% | 14,4% | 7,2% | 12,9% | 13,1% | 14,2% | 12,2% | 17,6% |
| Low wages of public servants | 13,8% | 12,9% | 4,0% | 10,0% | 15,9% | 14,0% | 14,7% | 11,2% |
| Others | 2,3% | 0,5% | 4,5% | 1,0% | 0,3% | 0,8% | 1,6% | 1,3% |
Source: Surveys from 2010-2017
Created by: The authors
Despite the efforts of the Internal Revenue Service (IRS) to reduce the levels of tax evasion during the last two decades by applying reforms and implementing controls for the “biggest taxpayers” with the use technological platforms to make information more transparent (Solano-Gallegos & Tobar-Pesántez, 2017), the Figures are very concerning.
"According to the IRS, 215 economic groups owe the state $2.260 million; $655 million owed by fictitious companies, $4.700 million were placed in tax havens (…), there are false invoices in customs for almost $2.000 million.” (Paz, 2017)
The Economists Association of Pichincha:
“Calculates that the level of annual tax evasion is around $300 and $400 million a year and that in 16 years the amount of evasion would be $4.500 million, money which would more likely be deposited in tax havens and foreign banks” (Cornejo, 2017).
Question 4. Consequences of corruption in Ecuador
The results of question four regarding the consequences of corruption in Ecuador are presented in Table 5. The results indicate that the main consequence of corruption is poverty, followed by a loss of confidence, credibility and prestige especially in politics.
| Table 5:Consequences Of Corruption In Ecuador | ||||||||
| Year | 2010 | 2011 | 2012 | 2013 | 2014 | 2015 | 2016 | 2017 |
| More poverty | 40,6% | 48,7% | 34,1% | 37,0% | 36,7% | 34,9% | 33,2% | 43,8% |
| Loss of confidence in institutions | 40,3% | 32,7% | 13,9% | 31,5% | 34,6% | 31,9% | 34,9% | 33,3% |
| Political instability | 20,3% | 16,9% | 12,3% | 17,5% | 18,1% | 23,4% | 26,7% | 29,2% |
| Discredit of the country | 31,1% | 23,5% | 8,5% | 16,6% | 23,0% | 21,8% | 15,0% | 27,9% |
| Moral decline | 30,2% | 27,1% | 24,8% | 21,9% | 24,5% | 27,5% | 24,8% | 25,8% |
| Loss of equality in the law | 22,6% | 17,2% | 14,9% | 20,7% | 27,1% | 27,2% | 26,7% | 25,5% |
| Loss of credibility in politicians | 29,7% | 20,3% | 12,8% | 20,7% | 16,3% | 18,5% | 20,4% | 25,3% |
| Other | 1,7% | 1,5% | 2,4% | 0,5% | 0,3% | 0,0% | 1,6% | 1,3% |
Source: Surveys from 2010-2017
Created by: The authors
Question 5. Who is affected by corruption?
Question 5 is about the impact of corruption in society. According to Table 6, there is a general agreement that corruption mainly affects the poorest people (49%). However, 30% of respondents said that corruption affects everyone to a greater or lesser extent. On the other hand, the results show that the business sectors associated with the wealthy class are the least affected by corruption.
| Table 6 : Who Is Affected By Corruption | ||||||||
| Year | 2010 | 2011 | 2012 | 2013 | 2014 | 2015 | 2016 | 2017 |
| The poor | 39,3% | 48,3% | 31,2% | 52,0% | 55,7% | 37,1% | 52,5% | 48,8% |
| Everybody | 56,0% | 42,0% | 48,3% | 35,1% | 23,4% | 42,8% | 24,6% | 29,9% |
| Middle class | 4,2% | 12,7% | 5,9% | 16,5% | 18,5% | 17,3% | 25,4% | 19,9% |
| The State | 4,4% | 6,1% | 5,9% | 9,3% | 13,5% | 8,1% | 10,1% | 11,8% |
| Businesspeople | 2,6% | 3,2% | 5,3% | 3,3% | 9,9% | 6,2% | 9,6% | 9,4% |
| Public companies | 1,4% | 1,5% | 4,0% | 2,1% | 6,3% | 5,7% | 7,1% | 5,5% |
| The rich | 2,3% | 6,6% | 2,7% | 4,3% | 8,6% | 7,3% | 4,6% | 5,0% |
| Private companies | 2,6% | 1,7% | 1,3% | 2,1% | 5,2% | 4,1% | 4,9% | 3,7% |
| Others | 0,5% | 0,5% | 0,0% | 0,2% | 0,5% | 0,3% | 0,8% | 0,8% |
Source: Surveys from 201-2017
Created by: The authors
The perception that corruption mostly affects the poor could mean that corruption is a scourge of underdeveloped economies. However, corruption is a characteristic of predatory as well as developmental states (Dinero, 2015).
Perhaps, the poor population perceives corruption with more intensity since it is its main victim, overpricing of million dollar contracts directly affects the budget of the most vulnerable sectors such as health and education. Additionally, the influence of the private sector in economic, fiscal and work policies is equally troublesome in countries that face a serious crisis as well as in countries with sustainable growth. In Ecuador, there is a debate of the state budget due to cutbacks on social spending, there is also the pressure of businesspeople to have greater flexibility in the hiring, the elimination or reduction of subsidies and capital gain taxes.
Question 6. People do not report the corrupt because they fear retaliation
According to this study, Table 7 shows people’s perception regarding their fear of retaliation when reporting cases of corruption. 61% of respondents believe that the fear of retaliation allows corruption. Other results of this study back up this statement, people believe that there is not much we can do to prevent corruption (38%) and that corruption is not punished as it should be (40%).
| Table 7: People Do Not Report The Corrupt Because They Fear Retaliation | ||||||||
| Year | 2010 | 2011 | 2012 | 2013 | 2014 | 2015 | 2016 | 2017 |
| Agree | 74,6% | 75,0% | 67,6% | 72,4% | 49,3% | 56,4% | 43,5% | 61,4% |
| Neither agree nor disagree | 11,5% | 15,5% | 19,2% | 16,3% | 29,4% | 32,1% | 43,5% | 22,1% |
| Disagree | 13,9% | 9,5% | 13,2% | 11,3% | 21,3% | 11,5% | 12,9% | 16,5% |
Source: Surveys from 2010-2017
Created by: The authors
In 2018, studies from Latinobarometro reported that people in Latin America have different thoughts about keeping silence when faced with corruption. In the case of Ecuador, 47% of people prefer to remain silent. However, the same report presented a contradiction to this question when people were asked about their complicity when not reporting corruption; 74% of people in Latin America said there was complicity while in Ecuador only 57% thought there was complicity. This is probably due to the fact that 44% are willing to pay the price of corruption in return for solutions to national problems.
Question 7. Corruption is higher among people with more resources than among the poor
Table 8 shows the results of question 7 on the perception of corruption between the rich and the poor. 66% of the sample believe that the rich are more corrupt. It is possible that this perception is based on the capacity that this economic power has to exercise pressure on society. Several studies have sought the relationship between wealth and corruption, for example the Spanish University of La Laguna discovered that 88% of corruption cases in Spain were related to people with great fortunes.
| Table 8: Corruption Is Higher Among People With More Resources Than Among The Poor | ||||||||
| Year | 2010 | 2011 | 2012 | 2013 | 2014 | 2015 | 2016 | 2017 |
| Agree | 71,3% | 64,8% | 68,0% | 65,4% | 45,3% | 50,7% | 46,1% | 60,6% |
| Neither agree nor disagree | 13,6% | 23,1% | 20,9% | 20,3% | 35,6% | 34,0% | 39,2% | 25,0% |
| Disagree | 15,1% | 12,1% | 11,0% | 14,2% | 19,1% | 15,3% | 14,6% | 14,1% |
Source: Surveys from 2010-2017
Created by: The authors
The Proceeding of the National Academy of Sciences conducted an experimental study on the relationship between the level of wealth and non-ethical practices and determined that in fact high classes had least ethical actions than people with less purchasing power (Piff et al., 2012). From a psychological point of view, there is evidence that high classes have a tendency to be diagnosed with Narcissistic personality; they are frequently arrogant and believe to have more rights and privileges than the rest of their fellow citizens from lower social classes (Piff, 2014).
Although underdeveloped countries have frequently been declared the most corrupt because of economic crises, lack of control, biased justice and greedy politicians, first world economies have also had shocking corruption cases.
In any case, in both cases, the corrupters have often been large companies with international capital and influential in political power. In recent years, perhaps the most representative case is Odebrecht, the Brazilian multinational founded in 1944 and dedicated mainly to the engineering and construction of civil works on a large scale. The company obtained its reputation in 2016 after it was syndicated by the US Department of Justice for bribery and bribes to government officials from 12 countries, including Ecuador, for more than 20 years in order to obtain millionaire public contracts. Corruption within this organization was institutionalized in such a way that they discovered the existence of a bribery department under the title "Sector of Strategic Relations". In this context, in a recent IDB study, it is estimated that the waste of public funds in bribes and bulky budgets is very high, it can even reach up to 26% of the cost of the projects, which is extremely serious (IDB, 2018).
Question 8. There would not be corruption in the public sector, if there were no private companies to provoke it
Question 8 refers to the co-responsibility of corruption between the public and private sectors. Table 9 shows a tendency in the perception of this co-responsibility. In 2017, and even more in 2016, for people the influence of companies on corruption in the public sector is indifferent.
| Table 9: There would not be corruption in the public sector, if there were no private companies to provoke it. | ||||||||
| Year | 2010 | 2011 | 2012 | 2013 | 2014 | 2015 | 2016 | 2017 |
| Agree | 52,9% | 42,1% | 51,1% | 43,5% | 44,1% | 40,2% | 31,0% | 33,2% |
| Neither agree nor disagree | 22,1% | 28,7% | 27,8% | 30,6% | 38,0% | 39,9% | 51,0% | 37,5% |
| Disagree | 25,0% | 29,2% | 21,1% | 25,9% | 17,9% | 19,9% | 18,0% | 29,2% |
Source: Surveys from 2010-2017
Created by: The authors
In this regard, the Ecuadorian historian Paz (2018) believes that in Ecuador “public corruption and not private one has been privileged, private corruption appears inexistent”. In addition, he adds that people make "illicit payments" to officials and in return they receive the favor they have requested and presents the example of "collusion between banks and insurance companies" to make "illicit charges" to customers, which caused the bank to return 1.2 million dollars as a result of about 51 thousand accusations processed through October 2018.
Question 9. Means through which people have received information about corruption in Ecuador
The answers to question 9 are about the different means through which corruption cases are reported. Table 10 shows that 47% corresponds to the media. Indeed, the media has played a leading role in the dissemination of corruption cases. However, they are criticized for taking sides and supporting certain interests. In fact, in an interview on national television a renowned Ecuadorian journalist recognized that journalists have certain power to influence political issues, likewise he admitted that they intervened actively in politics by being protagonists, and he even said "we dictated sentences (...) from the microphones, from the cameras "(Carrión, 2018).
| Table 10: Means Through Which People Have Received Information About Corruption In Ecuador. | ||||||||
| Year | 2010 | 2011 | 2012 | 2013 | 2014 | 2015 | 2016 | 2017 |
| The media | 51,4% | 57,1% | 42,9% | 41,9% | 43,3% | 45,5% | 37,3% | 47,4% |
| Family members | 4,0% | 3,9% | 3,9% | 13,2% | 17,9% | 14,3% | 19,6% | 20,7% |
| None | 34,7% | 25,9% | 31,3% | 27,0% | 10,6% | 10,5% | 12,3% | 16,1% |
| Neighborhood meetings | 3,3% | 5,9% | 3,2% | 10,8% | 19,0% | 16,0% | 11,2% | 15,0% |
| National Police | 3,5% | 2,2% | 1,8% | 7,7% | 21,6% | 10,5% | 20,2% | 13,7% |
| Municipality | 2,1% | 3,9% | 0,8% | 4,5% | 12,4% | 8,5% | 14,2% | 10,1% |
| Sports clubs | 3,3% | 3,7% | 2,4% | 2,9% | 11,1% | 6,1% | 8,7% | 5,7% |
| Courts | 1,4% | 2,4% | 0,3% | 3,8% | 7,9% | 2,2% | 5,7% | 5,2% |
| Ministry of justice and human rights | 1,9% | 1,2% | 5,0% | 3,1% | 7,1% | 6,6% | 14,2% | 5,2% |
| Health centers | 3,1% | 3,9% | 5,8% | 3,3% | 10,0% | 6,9% | 8,7% | 5,2% |
| Other | 10,0% | 8,2% | 12,4% | 5,7% | 6,6% | 4,0% | 4,9% | 7,8% |
Source: Surveys from 2010-2017
Created by: The authors
On the other hand, the use and popularity of social networks have enabled all types of open debates. Many corruption cases have gone viral through social networks and have exercised such pressure that legal proceedings were inevitable. In Ecuador, for example, several cases of femicides and sexual abuse to children became a tendency, which many people considered media lynching, a very controversial legal figure, which had influenced court decisions.
It is also interesting that respondents did not mention institutions of control, State comptroller, superintendence, prosecutors, national assembly, among others, as the source of reporting cases of corruption. Rather, politicians who want to become protagonists have made most corruption cases public by being sponsored by different media and have found a way to make themselves known publicly.
Question 10. Institutions where there is less corruption
Question 10 identifies institutions with the highest credibility in society. Table 11 presents public and private institutions which people believe have the least corruption. Fire departments, universities, high schools and neighborhood associations are thought to be the least corrupt, while municipalities, autonomous decentralized governments, the assembly and ministries are seen as the most corrupt according to this research.
| Table 11: Least Corruption | |
| Fire departments | 54% |
| Universities/high schools | 37% |
| Neighborhood associations | 33% |
| Military forces | 27% |
| Hospitals | 27% |
| Internal Revenue Service | 26% |
| Private companies | 20% |
| National Police | 20% |
| The government | 18% |
| Suupreme court | 18% |
| Judicial police | 17% |
| Comptroller general of the country | 17% |
| Public companies | 16% |
| Courts | 16% |
| Ministries | 15% |
| Assemblymen | 15% |
| Municipalities | 13% |
Source: Surveys from 2010-2017
Created by: The authors
The only public institution that surpasses 20% of credibility is the Internal Revenue Service. Since it was completely restructured 18 years ago, it has gained a positive image and has positioned itself as being transparent. On the other hand, the military forces, also a benchmark for its function of defending sovereignty, has seen its image diminished due to a series of recent corruption scandals that link it with terrorism and drug trafficking.
In Latin America, trust in military forces and the police represent 44 and 35% respectively, while congress represented 21%. In Ecuador this perception is less optimistic (Latinobarómetro, 2018), 58% of Ecuadorians believe the police is involved in acts of corruption.
Conclusion
Historically, the perception of corruption in Ecuador has been alarming. According to data from Transparency International, since 2010 Ecuador has ranked in the last places, 117th out of 180 countries in 2017, just above Venezuela and Paraguay regarding South American countries. However, the tendency shows that the situation improved since 2010 and was ranked 102nd in 2013, with an index of 35. From then on, the problem has gotten worse once again, as presented by the 2018 Latinobarometro Report (2018) where it states that 56% of Ecuadorians believe corruption increased with respect to last year.
The transparency report also reveals that the perception of corruption in the public sector in Latin American countries remains very high, but it does acknowledge certain progress such as the creation of stronger legislation in Chile and the declaration of the fight against corruption in countries like Peru and Ecuador where they have begun legal proceedings against senior government officials, although these people have said they are under political prosecution. In Ecuador, the historian Paz (2018) presented cases such as the one from former president L. Febres Cordero who in the 1980s created an office specialized in prosecuting O. Hurtado (his predecessor) and his officials.
In general terms, the perception of corruption could be related to different social and economic strata and influenced by a cultural and political background. The poor population is likely to be more sensitive to corruption when the economic situation of the country deteriorates because they suffer the devastation of the crisis and its adjustments in economic and social matters directly and with greater force. An example of this can be seen in social networks where almost everything that happens in the community, including of course corruption, is widely discussed. The discussion in social networks, supports the debate, probably because its users are more schooled and younger or because of the variety of critical views that oppose or support each other.
The data empirically demonstrates that the poor population does not trust controlling bodies to fight corruption. On the contrary, they believe that justice, the government, police, comptrollers are among the most corrupt. They also believe that these institutions do not report corruption cases.
Since this is a longitudinal study, the current results will be useful for future comparative studies. Furthermore, future reports will intend to establish the degree of correlation, if there is any, between the different indicators of poor people’s perception of: food, housing needs, personal rights, public safety, labor market, the environment, basic services, health care, culture and education, all which are part of the overall study about poor people’s perceptions in the city of Cuenca.
References
- Arjona, A. (2002). Political corruption: A review of the literature. Madrid: Carlos III University.
- Carrión, A. (2018). All rights reserved: EcuadorTV. Retrieved November 15, 2018, from https://www.youtube.com/watch?v=5P829WHNA_w
- Cornejo, G. (2017). Quantifying evasion is a pending task not only in Ecuador but throughout Latin America. Obtained from The Conversation. Retrieved fromhttps://laconversacion.net/2017/09/cuantificar-la-evasion-es-una-tarea-pendiente-no-solo-en-ecuador-sino-en-toda-america-latina/
- Dinero, T. (2015). The fight against corruption will not reduce poverty. Retrieved July 20, 2018, from https://www.dinero.com/economia/articulo/relacion-entre-pobreza-corrupcion/212352
- Espectador, E. (2017). What is most worrying to entrepreneurs in Latin America? Retrieved July 21, 2018, from https://www.elespectador.com/economia/que-es-lo-que-mas-preocupa-los-empresarios-en-america-latina-articulo-714971
- Hernández, R., Fernández, C., & Bapista, P. (2014). Investigation methodology. México: McGraw-Hill.
- IBD. (2018). Better spending for better lives. Retrieved from https://flagships.iadb.org/es/DIA2018
- INEC. (2017). Let's know Cuenca through its figures. Retrieved July 1, 2018, from http://www.ecuadorencifras.gob.ec/conozcamos-cuenca-a-traves-de-sus-cifras/
- INEC. (2018). Poverty due to income. Retrieved July 1, 2018, from http://www.ecuadorencifras.gob.ec/pobreza-junio-2018/
- INEC. (2018). Report of poverty and inequality. Quito: Innovation management in metrics and information analysis.
- INVEC. (2013). Competitive basin information platform. Retrieved July 2, 2013, from http://www.invecdata.com/menu_seccion.aspx?men_id=4.2.13
- Lambsdorff, G. (2003). How corruption affects productivity. Kyklos.
- Latinobarómetro. (2018). Report of 2018. Buenos Aires.
- Lopez, J. (1999). Corruption and change. México: Facultad Latinoamericana de Ciencias.
- Paz, Y.M.C. (2017). And the gigantic tax evasion? The Telegraph. Retrieved from https://www.eltelegrafo.com.ec/noticias/columnistas/1/y-la-gigantesca-evasion-tributaria
- Paz, Y.M.C. (5 de Noviembre de 2018). Corrupción y corruptores. Recuperado el 14 de Noviembre de 2018, de Historia y Presente: http://www.historiaypresente.com/corrupcion-y-corruptores/
- Piff, P.K. (2014). Wealth and the inflated self: Class, entitlement and narcissism. Personality and Social Psychology Bulletin, 40(I), 34-43.
- Piff, P.K., Stancato, D.M., Côté, S., Mendoza-Denton, R., & Keltner, D. (2012). Higher social class predicts increased unethical behavior. PNAS, 11(1), 4086-4091.
- Ruiz, A.M.A. (2017). Pattern of reproduction of capital and social classes in Ecuador (Doctor's Thesis). National Autonomous University of Mexico.
- Salama, P., & Valier, J. (1995). Corruption and poverty. Espiral, 21(2), 45-67.
- Sánchez, M. (2007). The highest control body and the state institute for transparency and access to public information, elements inherent to democracy, for combating corruption in the government sector. Oaxaca: Benito Juárez Autonomous University.
- Sánchez, R. (2017). The index of corruption that does not really measure corruption. Retrieved from https://www.eldiario.es/politica/indice-corrupcion-realmente-mide_0_607889783.html
- Santos, T. (2018). The power of a few honest. Vistazo, 12(1), 32-33.
- Solano-Gallegos, S., & Tobar-Pesántez, L. (2017). Characterization of the large economic groups in Ecuador according to the SRI Internal Revenue Service in 2015. Observatory Journal of the Latin American Economy, Ecuador.
- Telégrafo, E. (2018). Mera recognizes that there was corruption in the Correa era of justice. Retrieved October 15, 2018, from https://www.eltelegrafo.com.ec/noticias/judicial/12/alexis-mera-corrupcion-justicia-asamblea-ecuador
- Transparency International. (2018). Corruption perceptions index 2017. Retrieved from https://www.transparency.org/news/feature/corruption_perceptions_index_2017
- Universo, E. (2017). More than $ 35 billion is estimated to be detrimental to the country. Retrieved from https://www.eluniverso.com/noticias/2017/12/14/nota/6525505/mas-35-mil-millones-se-estima-perjuicio-pais
- Universo, E. (2018). Assembly denies intervention to the UN to investigate corruption in Ecuador. Retrieved from https://www.eluniverso.com/noticias/2018/03/07/nota/6655642/asamblea-niega-intervencion-onu-investigar-corrupcion-ecuador
- Verisk, M. (2017). Corruption: Global index. Retrieved from https://www.maplecroft.com/.../global-corruption-ranking-which-countries-pose-highest
- World Bank. (2017). Qualification of transparency, responsibility and corruption in the public sector. Retrieved from https://datos.bancomundial.org/indicador/IQ.CPA.TRAN.XQ?view=map.
- Yañez, M. (2014). Evolution of the level of satisfaction of vulnerable people in Santiago de Chile 2007-2014. Oikos, 38(18), 142-159.