Research Article: 2018 Vol: 19 Issue: 3
A Level Playing Field Competitive Balance In the North woods League
Nancy J. Burnett, University of Wisconsin Oshkosh
Lee J. Van Scyoc, University of Wisconsin Oshkosh
Abstract
Keywords
Competitive Balance, Minor League Internship, Major Leagues.
Introduction
As sports fans we like to see close games. Fans rapidly grow bored during a lopsided game, while a closely contest between well matched teams engenders far more excitement. Indeed, many fans dislike seeing the same teams winning championships year after year. Most sports have instituted policies to prevent this type of domination. For instance, in most major league sports new players are drafted by teams in inverse order of team standing so that the team with the worst record has the first choice of incoming players, suggesting that poorly performing teams get the best incoming talent, in an attempt to even out talent distribution. Additionally, the is an effect of large market teams with the increased revenue from market size allowing these teams to essentially “buy” championships with large payrolls (including paying players and staff) and better facilities. Many professional sports leagues have introduced revenue sharing to reduce this advantage.
This paper focuses on the Northwoods Baseball League. This league is one in which we should see as close to true competitive balance as can be found anywhere in sports today, given the very strict rules under which the league operates. It is a collegiate league, made up of college players who play during their summer break and cannot lose college (amateur) status. The players have what is called a “Minor League Internship”, rather than act as paid talent so that rich teams cannot “buy” talent. The teams also are only able to have, and train, players during the summer months when players are not actively in college, so the short duration of coaching and training are unlikely to make huge differences across teams. Additionally, each player will have only a small number of years in which they are eligible to play for this league as they will move on after college either to play baseball professionally or drop out of the sport entirely. Therefore, teams are unlikely to be able to build fan loyalty to a particular player, since players are available for a very small number of seasons. With this turnover of players, short seasons, and inconsistent team compositions, this particular league should experience as close to perfect competitive balance as possible in sports today.
The concept of competitive balance was first introduced by Rottenberg (1956), has been discussed and refined in the literature for many years (Schmidt, 2001; and Humphreys, 2002; among many others). This paper examines several measures of competitive balance for an amateur baseball league.
Methodology
There are several ways to measure competitive balance. If teams were completely evenly matched, each team would have a 50% chance to win each game, and championships would, therefore, be randomly distributed across teams. Therefore, various measures of competitive balance consist of examining the dispersion from that true competitive balance winning ratio of 50%.
The first of these measures computes the dispersion of winning percentages across all teams within a given year (Within Season Winning Variation or σw,t). This is the deviation of each team’s winning percentage relative to a competitively ideal winning ratio of 50% (0.500). The closer to zero this variation is, the closer to true competitive balance the league would be. The formula for σw,t for a given year t is given below:
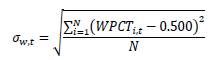
where WPCTi,t is team i’s winning percentage in year t, and N is the number of teams in the league.
The σw,t is not a perfect measure, as it will be affected by the number of games played. It will tend to be larger the fewer games played, as random strings of wins or loses significantly affect the outcome. However we can compute the Ideal Standard Deviation or σI that reflects the deviation if each team has a 50% (0.500) winning record. This is
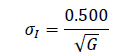
where G is the number of games played.
Employing a ratio of the σw,t to the σI forms the Ratio of Within Season Winning Variation, or R. This ratio enables direct comparisons across leagues regardless of the number of games played. The closer to one this ratio is the more competitive balance.

Another measure of competitive balance is the Between Season Winning Variation or σI,T for each team across all seasons. Teams that are consistent (either consistently winning or consistently losing) will have small values whereas teams that are less consistent will have large values in this measure. Therefore, the larger this measure, the less competitive balance. Each team will have a σI,T as measured by the following formula:
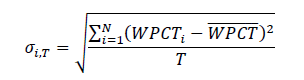
where T is the number of season’s team i has been in the league and  is that team’s average winning percentage over those T seasons.
Another common measure of competitive balance is the Hirfindahl-Hirschman Index, or HHIi. The HHI was first developed to measure market but is also commonly used to measure concentrations of championships relative to the number of teams within a league as follows:
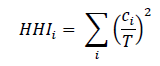
where ci is the number of first-place finishes for team i, and T is the number of seasons.
The minimum level of HHI demonstrates a situation where championships are randomly distributed across teams. When the number of years is greater than the number of teams in the league (i>T) the minimum value of the HHI is  where N is the number of teams, for shorter periods this measure has a minimum of where T is the number of seasons. The closer to the minimum, the more competitive the league while a value of 1 suggests perfect imbalance (one team winning all of the championships).
Data And Results
Baseball league was created in 1994 with 5 teams. Each team has a home stadium, and creates revenue The Northwoods mainly from entrance fees and concessions with no games being televised (unlike major league sports). The league expanded to its current 16 teams in 2010, though many of these teams have changed names over time. All told, across the years, there have been 22 locations with teams. We categorize teams by location, regardless of name. Championships have been won by eight of these locations. Table 1 shows the locations (including team names), winning percentages and championships. The most dominant team, the Rochester Honkers, has the highest winning percentage and most league championships and is tied with one other team for the longest tenure in the league.
| Table 1 Northwoods League Teams, Years In League And Champion Years |
|||
| Team | Years in League (Total) | Regular Season Winning Percentage | League Champions |
| Rochester Honkers | 1994–Present (18) | 0.569 | 1994 1997 1999 2006 2009 |
| St. Cloud River Bats | 1997-Present (15) | 0.557 | 1998 2000 2007 |
| Willmar Stingers | 2010-Present (2) | 0.557 | |
| Madison Mallards | 2001-Present (11) | 0.546 | 2004 |
| Kenosha Kroakers | 1994-1998 (5) | 0.545 | |
| Green Bay Bullfrogs | 2007-Present (5) | 0.553 | |
| Eau Claire Express | 2005-Present (7) | 0.526 | 2010 |
| Waterloo Bucks | 1995-Present (17) | 0.511 | 1996 2002 |
| La Crosse Loggers | 2003-Present (9) | 0.504 | |
| Thunder Bay Border Cats | 2003-Present (9) | 0.484 | 2005 2008 |
| Wausau/Wisconsin Woodchucks | 1994-Present (18) | 0.480 | 2001 2003 |
| Duluth Huskies | 2003-Present (9) | 0.484 | |
| Mankato Mashers/MoonDogs | 1999-Present (13) | 0.493 | |
| Alexandria Beetles | 2001-Present (11) | 0.498 | |
| Brainerd Mighty Gulls/Blue Thunder/Lunkers | 1998-2002 and 2005-Present (12) |
0.450 | |
| Manitowoc Skunks | 1994-1997 (4) | 0.439 | |
| Battle Creek Bombers | 2007-Present (5) | 0.443 | 2011 |
| Dubuque Mud Puppies | 1994-1996 (3) | 0.346 | |
| Minot Greenheads | 2000 (1) | 0.344 | |
| Grand Forks Channel Cats | 1998-2000 (3) | 0.335 | |
| Austin Southern Minny Stars | 1998-1999 (2) | 0.325 | |
| Wisconsin Rapids Rafters | 2010-Present (2) | 0.314 | |
Note: Data from Northwoods League (2013, May).
The Within Season Winning Variation or σw, the Ideal Standard Deviation σI and the Ratio of within Seasons Winning Variation R for each year the league has been in existence is shown in Tables 2A & 2B. The Northwoods league only runs for 2 ½ months, and consists of roughly 65-70 games in recent seasons with as few as 50 games played during the league’s inaugural season in 1994, so that the R measure of competitiveness will be more indicative of true competitiveness in this league than σw. R shows some large swings, becoming less competitive as expansion teams were added but rapidly converging toward greater balance after the expansion confirming the suggestion by Schmidt (2001) in expanding leagues. In 2002 R reached a low of 1.038, five years after the league expanded from 5 teams to 8 (allowing time for the new teams to become competitive). The expansion at the end of 2009 from 14 to 16 teams saw a jump from R=1.344 to R=1.765, but with a fairly rapid decline to 1.576 by 2011. The Northwoods league shows it is relatively competitive compared to major league sports even in 2011 (shortly after the most recent team expansion) as shown in Table 3, though we note a small R in the English Premier League which represents a small number of very dominant teams.
| Table 2A Northwoods League: Within Season Winning Variation, Ideal Standard Deviation, Ratio Of Within Season Winning Variation And Team Count, By Year |
|||||||||
| Year | 1994 | 1995 | 1996 | 1997 | 1998 | 1999 | 2000 | 2001 | 2002 |
| σw | 0.111 | 0.153 | 0.112 | 0.148 | 0.133 | 0.157 | 0.134 | 0.081 | 0.065 |
| σI | 0.072 | 0.066 | 0.065 | 0.063 | 0.063 | 0.063 | 0.063 | 0.063 | 0.063 |
| R | 1.546 | 2.308 | 1.723 | 2.352 | 2.112 | 2.487 | 2.123 | 1.298 | 1.038 |
| Team | 5 | 6 | 6 | 6 | 8 | 8 | 8 | 8 | 8 |
| Table 2B Northwoods League: Within Season Winning Variation, Ideal Standard Deviation, Ratio Of Within Season Winning Variation And Team Count, By Year |
|||||||||
| Year | 2003 | 2004 | 2005 | 2006 | 2007 | 2008 | 2009 | 2010 | 2011 |
| σw | 0.104 | 0.086 | 0.099 | 0.103 | 0.084 | 0.085 | 0.082 | 0.106 | 0.095 |
| σI | 0.063 | 0.063 | 0.061 | 0.061 | 0.061 | 0.061 | 0.061 | 0.06 | 0.06 |
| R | 1.66 | 1.37 | 1.638 | 1.7 | 1.37 | 1.404 | 1.344 | 1.765 | 1.576 |
| Team | 10 | 10 | 12 | 12 | 14 | 14 | 14 | 16 | 16 |
| Table 3 Within Season Winning Variation, Ideal Standard Deviation, And Ratio Of Within Season Winning Variation In Selected Major League Sports And Northwoods League For 2011 |
|||
| League | Within Season Winning Variation σw |
Ideal Standard Deviation σI |
Ratio of Within Season Winning Variation R |
| Northwoods | 0.094 | 0.059 | 1.57 |
| MLB | 0 .069 | 0.039 | 1.77 |
| NFL | 0.201 | 0.125 | 1.61 |
| NBA | 0.158 | 0.056 | 2.82 |
| NHL | 0.080 | 0.056 | 1.43 |
| English Premier League | 0.109 | 0.081 | 1.34 |
Note: Data for Northwoods League from Northwoods (2013, May), remainder from Leeds and von Allmen (2014, page 163).
Perhaps a more accurate measure of competitive balance, given the recent expansion activity in this league, is likely to be the Between Season Variation or  This measure’s advantage is that it computes each team separately across time. The smaller this variation, the more consistent the teams winning/losing record over time. If all wins were randomly distributed, then all teams would have little variation across time. Teams that were in the league for a very small number of years will have skewed results however, for instance the Minot Greenheads who were only in the league for a single year have a 0.00 variation. The longer the teams were in existence the more consistent this measure will be. Table 4 shows quite small winning variations in general, though another caveat for this measure is that it only measures consistency, so that a team that always wins will also have a very small variation leading us to examine the last measure of competiveness, the HHI that measures the distribution of championships.
| Table 4 Northwoods League Between Season Winning Variation (σi,T) By Team |
|
| Team | Between Season Variation (σi,T) |
| Rochester Honkers | 0.162 |
| St. Cloud River Bats | 0.238 |
| Willmar Stingers | 0.000 |
| Madison Mallards | 0.077 |
| Kenosha Kroakers | 0.266 |
| Green Bay Bullfrogs | 0.066 |
| Eau Claire Express | 0.091 |
| Waterloo Bucks | 0.238 |
| La Crosse Loggers | 0.075 |
| Thunder Bay Border Cats | 0.085 |
| Wausau/Wisconsin Woodchucks | 0.098 |
| Duluth Huskies | 0.085 |
| Mankato Mashers/MoonDogs | 0.079 |
| Alexandria Beetles | 0.073 |
| Brainerd Mighty Gulls/Blue Thunder/Lunkers | 0.058 |
| Manitowoc Skunks | 0.298 |
| Battle Creek Bombers | 0.124 |
| Dubuque Mud Puppies | 0.104 |
| Minot Greenheads | 0.000 |
| Grand Forks Channel Cats | 0.051 |
| Austin Southern Minny Stars | 0.008 |
| Wisconsin Rapids Rafters | 0.028 |
Table 5 shows the distribution of championships in a selection of major league sports and the Northwoods league over a 10 year period, suggesting a minimum HHI=0.10. The Premier Soccer League has the highest concentration of winners and HHI=0.38 while the NHL has the lowest with HHI=0.13, though the Northwoods league is quite competitive with an HHI=0.14 (over the entire existence of this league the HHI measures .0138). In terms of the Northwoods league, with its changing composition of teams, it is no real surprise that the teams that have been in the league the longest tend to have the best winning records and amass the most championships.
| Table 5 Distribution Of Championships And Hirfindahl-Hirschman Index By League, 2001-2 To 2011-2 |
|||||
| National Basketball Association NBA |
National Hockey League NHL* |
National Football League NFL |
Major League Baseball MLB |
Premier League | Northwoods League |
| Spurs–3 Lakers–3 Celtics–1 Heat–1 Pistons–1 Mavericks–1 |
Red Wings–2 Devils–1 Avalanche–1 Ducks–1 Hurricanes–1 Lightning–1 Bruins–1 Blackhawks–1 Penguins–1 |
Patriots-2 Giants–2 Steelers–2 Bucs–1 Colts-1 Saints–1 Packers–1 |
Red Sox–2 Cardinals–2 Angels–1 Yankees–1 Giants–1 White Sox–1 Marlins–1 Phillies–1 |
Manchester Unite –5 Chelsea–3 Arsenal–2 | Rochester–2 Thunder Bay-2 Wisconsin–1 Waterloo–1 Eau Claire–1 Madison–1 St Cloud–1 Battlecreek–1 |
| HHI=0.22 | HHI=0.13 | HHI=0.16 | HHI=0.15 | HHI=0.38 | HHI=0.14 |
Notes: Data begins in 1997-1998, no NHL championship in 2004-2005.
Data for Northwoods League from Northwoods (2013, May), remainder from Leeds and Von (2014).
Concluding Remarks
Our results support Schmidt (2001) showing that expansion within a league leads to increased levels of competitiveness. Table 2 shows that expansion in the Northwoods league, particularly three or more years after a team is added that R (Ratio of Within Season Winning Variation) falls toward 1 (perfect competition). In the history of this league, jumps at the end of 1997, 2002, 2005 and again at 2006 and 2009 all showed this pattern. By comparison to other leagues, the Northwoods league is more competitive, according to this R as well as the HHI (or Hirfindahl-Hirschman Index) than all but the National Hockey League through 2012.
We conclude that the Northwoods league shows strong levels of competitive balance as compared to major league sports and confirms the results of Schmidt (2001) suggesting that expansion within a league leads to increased levels of competitiveness.
References
- Humphreys, B. R. (2002). Alternative measures of competitive balance in sports leagues. Journal of sports economics, 3(2), 133-148.
- Leeds, M. A., & von Leeds, P. (2014). The Economics of Sports, 5th edition. Pearson, Boston MA.
- Northwoods League (2013). Northwoods Stats. Retrieved from http://northwoodsleague.com/pdf/nw/recordbook.pdf.
- Rottenberg, S. (1956). The baseball players' labor market. Journal of political economy, 64(3), 242-258.
- Schmidt, M. B. (2001). Competition in Major League Baseball: the impact expansion. Applied Economics Letters, 8(1), 21-26.