Review Article: 2022 Vol: 26 Issue: 4
A Study on the Factors that Influence the Experience of an E-Bike to Its User
Kishore Babu M, Koneru Lakshmaiah Education Foundation (Deemed to be University)
Annavarapu Vamsidhar Gupta, Koneru Lakshmaiah Education Foundation (Deemed to be University)
Kanamarlapudi Raja Manikanta Rithvik Kumar, Koneru Lakshmaiah Education Foundation (Deemed to be University)
Durga Prasad Navulla, Koneru Lakshmaiah Education Foundation (Deemed to be University)
Citation Information: Kishore Babu, M., Vamshdhar Gupta, M., Manikanta, K.R., & Prasad Navulla, D. (2022) A study on the factors that influence the experience of an E-bike to its user. Academy of Marketing Studies Journal, 26(4), 1-9.
Abstract
With the rise in demand for an eco-friendly and environment friendly atmosphere, the market has materialized the e-bikes for a sustainable environment. The manufacturers are competitive in providing with the design, comfort, performance and safety that the consumers are looking forward. From the mid of 2021, phase-2 of the e-bike surge was observed and the willingness to purchase e-bikes among traditional 2-wheeler users has started. Objective: To understand and analyze the factors that influence the customer experience towards the purchase of an E-bike. Methodology: The research is conducted through a structured questionnaire. Data Analysis and Interpretation carried with 233 responses is presented through Bar Charts, Correlation and Anova (SPSS). Findings: The study identified that there are more female users than male in the age bracket of 21-35 years. Along, it is observed that the working class is finding this as an alternative more performance efficient and price efficient considering the current rise in petroleum prices and its subsidiary products. Maximum users fall under the 5 lakhs to 10 lakhs annual income families. Irrespective of the age group the users are looking forward to ride an e-bike for economical and for sustainable reasons.
Keywords
Performance, Utility Function, Customer Experience, E-Bikes, Post-Purchase.
Introduction
India is a rural country with the world's third-largest street community. In India, road trips proved to be a popular pastime, with over 60% of the population commuting in their own or shared vehicles Anifa (2018). Conventional autos are a major contributor to global warming and air pollution. Dirt is produced by all types of cars due to brakes, tires, and road wear. The typical diesel vehicle has a worse impact on air quality than the ordinary gas vehicle. However, both gas and diesel vehicles destroy the environment more than electric vehicles. (European Economic Area, 2018) Governments began to utilize economic strategies, as well as street charge, to discourage the purchase and use of high carbon emission vehicles Bhalla et al. (2018). After re-registering, green fee is charged post 15 years. Fuel taxes can be used to encourage development of more eco-friendly, less polluting automobiles and the development of alternative fuels. High gas prices or cultural shifts can also be effective incentive to customers to choose user-friendly, compact, gas-efficient engines or to stop driving altogether. Zero-emission vehicles (ZEVs) is still in new technology in India, the infrastructure necessary for them are still in their early phases of development. EVs are relatively high priced than their equivalent counter-part which are conventional vehicles due to the high cost of making those batteries. Norway, is the world's largest EV market, has observed high market penetration of EVs through a wide package of benefits like free parking, road tax exemption, and more, but they also found that it is necessary to reduce the cost difference between CVs and EVs, as consumers will have to get convinced that it is a better option than Dutta & Hwang (2021).
The Ministry of Heavy Industries and Public Enterprises created FAME in 2015 to promote the manufacture and promotion of green cars such as electric and hybrid automobiles. The National Electric Mobility Mission Plan (NEMMP) 2020 is a National Mission report that gives a vision and, as a result, a roadmap for the faster adoption and manufacture of electric cars (Jose, 2018). This plan intends to increase national gas security, offer low-cost and environmentally friendly transportation, and position India's automobile sector as a global manufacturing leader the year 2013 Gujarathi et al. (2018).
Review of Literature
According to a forecast by the India Energy Source Alliance (IESA), the Indian electric vehicle industry would develop at a compound annual growth rate of 36% through 2026. The car sector accounts for 7.1 percent of India's GDP, with electric vehicles accounting for up to 2% of that Hidrue et al. (2018). There has been no significant research on consumer experience after the years 2020-2021, when more brands and efficient automobiles appeared, and people began to favor electric vehicles over traditional two-wheelers. According to research by consulting company RBSA Advisors, "India's electric vehicle (EV) industry is predicted to develop at a compounded annual growth rate (CAGR) of 90% in this decade, reaching $150 billion by 2030." In terms of penetration, electric car sales in India will account for only 1.3 percent of total vehicle sales in 2021. The market, on the other hand, is fast expanding and is predicted to rise in value. By 2030, India's transition to shared, electrified, and connected mobility may save roughly one gigaton of carbon dioxide emissions. In the following days, electric vehicle sales are expected to skyrocket Imthiyaz & Ayub (2020). “The only certainty over the future prices of diesel/petrol being that they are unlikely to reduce soon, more choices being made available to the consumer in terms of electric vehicles and initiatives by the Central and State Governments, the sector is expected to attract huge investments as well. Each of the last three years have seen double digit deals and we expect this trend to continue,” Rajeev R. Shah, Managing Director & CEO, RBSA Advisors, said Mohamed et al. (2018).
Significance of Study
To understand and analyze the factors that influence the customer experience in purchase of e-bikes among its users. The study will be helpful for manufacturers to understand:
1. Which demographic audience are using their product more and why?
2. How audience are reacting to the product in regards to performance, utility, and pricing?
3. What are some aspects that needs to modified / upgraded/ installed to meet the desired expectations of the existing users or to gain new users?
Methodology
The research is conducted through a structured questionnaire & survey method. Entire data used for study is primary data collected from people around by spreading questionnaire through offline (in-person survey) and online (google form) medium to 233 participants across all demographics. Data Analysis and Interpretation presented through Excel Charts and SPSS Figures 1-6.
Analysis
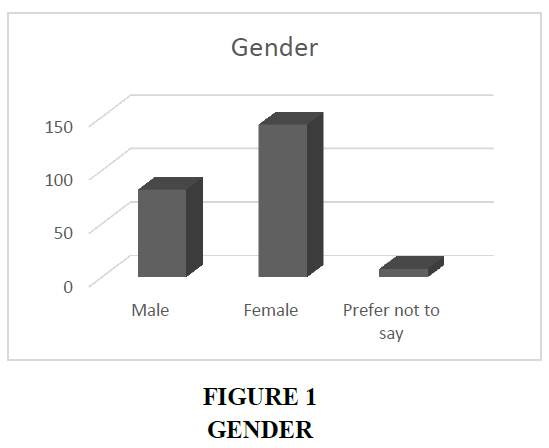
| Gender | Respondents |
| Male | 82 |
| Female | 143 |
| Prefer not to say | 8 |
Analysis
The ease of maintenance and handling comfort that e-bikes provides along with their light weight body make it more convenient than that of a traditional higher performance petrol run moped and thus female find it user friendly in the long run.
Age
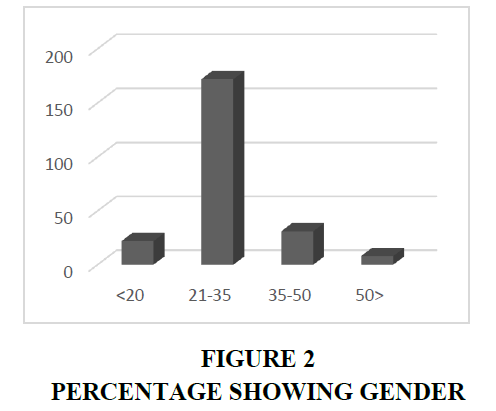
| Age in years | Respondents |
| <20 | 22 |
| 21-35 | 172 |
| 35-50 | 31 |
| 50> | 8 |
The age group of 21-35 comprises, under graduate level students, graduate level students, working class employees, newly wedded small nuclear families. Even in this categorization, the under graduate level students are dependent on their working-class parents who are the ones that spend money to make these purchases and their average age bracket falls under 45-55 years of age.
Occupation
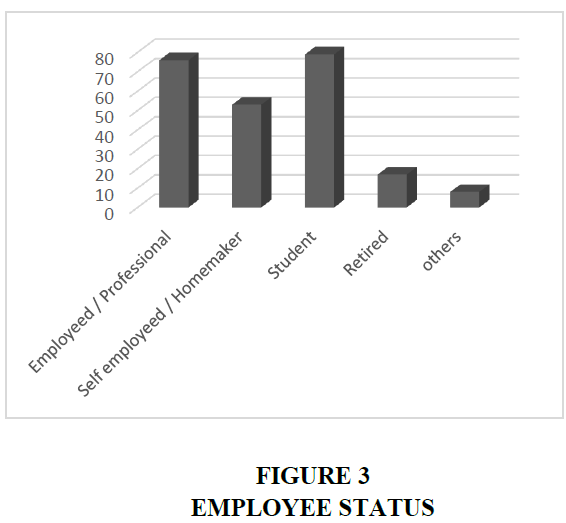
| Occupation | Respondents |
| Employed / Professional | 76 |
| Self-employed / Homemaker | 53 |
| Student | 79 |
| Retired | 17 |
| others | 8 |
As discussed above, students who are dependent on their parents and have a comfortable annual income to spend or experiment have owned and used E-bike. The common philosophy behind it is that, they have convenience of usage and maintenance and cost effective at the same time. The self-employed and home maker looks for the maximum utility function and cost-effective options while spending around one lakh.
Annual Income Band
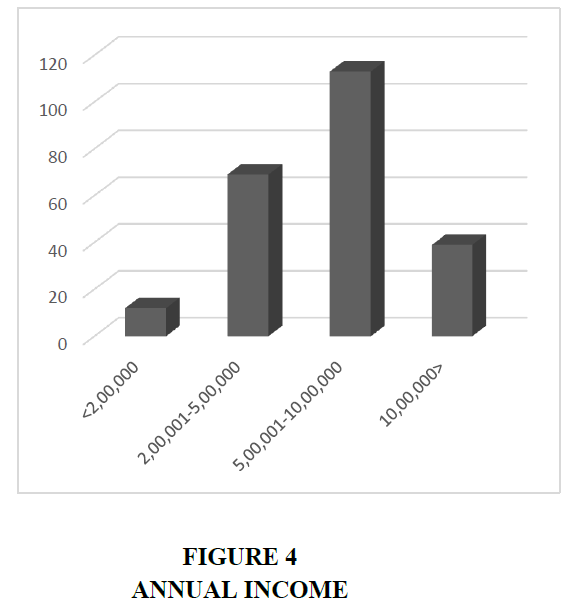
| Income in INR | Respondents |
| <2,00,000 | 12 |
| 2,00,001-5,00,000 | 69 |
| 5,00,001-10,00,000 | 113 |
| 10,00,000> | 39 |
The annual income a family makes a huge impact on the purchase decision and defines the segment a person might make a purchase. There can be exception in this aspect but is largely similar. The graph helps us understand that majorly the middle-income groups that either look for optimum utilization of resources at the least cost possible without compromising on the utility function that products offer.
Brand of E-bike
| Brand | Respondents |
| Avera | 23 |
| Pure | 29 |
| Ola | 33 |
| TVS | 34 |
| Bajaj | 21 |
| Revolt | 15 |
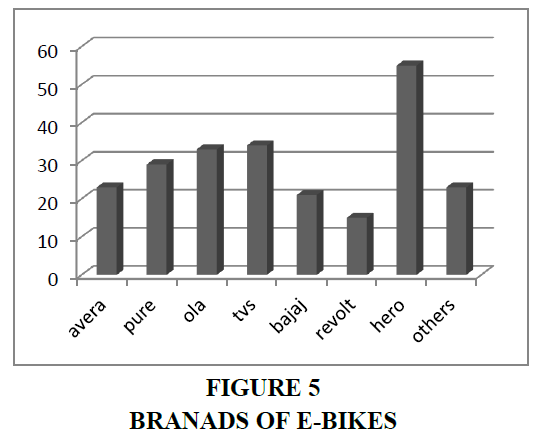
| Hero | 55 |
| Others | 23 |
Brands such as Pure, Avera together make it around 52 users across all demographics the reason behind this is the 2-tier pricing that targets specifically the middle-income groups. Secondly, these two brands are not as popular as major giants like TVS, Ola, Bajaj.
Time Span of Usage
| Time Span in Years | Respondents |
| 0 | 35 |
| <1 | 108 |
| 1-2 | 69 |
| 2-3 | 17 |
| 3> | 4 |
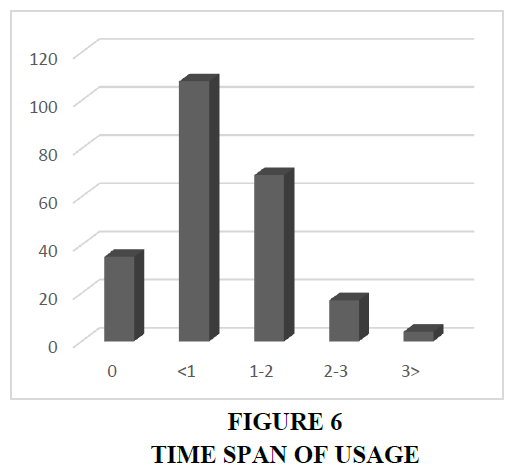
As the awareness is increasing among middle income groups, brands are trying to manufacture at the best rate possible to meet their demands. The surge has been observed post the Q1 of 2021-2022 financial year as even government is trying to push this concept by giving subsidies to manufacturers and buyers Tupe et al. (2020). This is the reason why most users in our sample have experience with it less than a year.
Interpretation
Correlation
Null Hypothesis: There is no relationship between reliability, performance, outlook and tangibility of respondents E-Bike.
Alternate Hypothesis: There is relationship between reliability, performance, outlook and tangibility of respondents E-Bike Table1.
|
Table1 Null Hypothesis Correlation Coeffecient |
||||
| Post-purchase factors | Reliability | Performance | Outlook | Tangibility |
| Reliability | 1 | 0.815** | 0.691** | 0.687** |
| Performance | 0.815** | 1 | 0.808** | 0.786** |
| Outlook | 0.691** | 0.808** | 1 | 0.762** |
| Tangibility | 0.687** | 0.786** | 0.762** | 1 |
The correlation coefficient between performance and reliability is 0.815 which indicates positive relation between performance and reliability. The percentage of relation between performance and reliability is 66.42%.
The correlation coefficient between outlook and reliability is 0.691 which indicates positive relation between outlook and reliability. The percentage of relation between outlook and reliability is 47.74%
The correlation coefficient between tangibility and reliability is 0.687 which indicates positive relation between tangibility and reliability. The percentage of relation between tangibility and reliability is 47.19%.
The correlation coefficient between outlook and performance is 0.808 which indicates positive relation between outlook and performance. The percentage of relation between outlook and performance is 65.28% Sasimath (2019).
The correlation coefficient between tangibility and performance is 0.786 which indicates positive relation between tangibility and performance. The percentage of relation between tangibility and performance is 61.77%
The correlation coefficient between tangibility and outlook is 0.762 which indicates positive relation between tangibility and outlook. The percentage of relation between tangibility and outlook is 58.06% and is significant at 1% level Meenakshi,.
Anova
Null Hypothesis: There is no significant difference among age group with respect to aspects that convinced respondents to purchase an E-bike.
Alternate Hypothesis: There is significant difference among age group with respect to aspects convinced respondents to purchase an E-Bike Table 2.
|
Table 2 Anova Sisgnificance |
||||||
| Post Purchase Factors |
Age group in years |
F Value | P Value | |||
| Below 20 Years | 21-35 years | 36-50 years | Above 51 years | |||
| Reliability | 3.52 (0.706) |
3.74 (0.576) |
3.68 (0.692) |
3.45 (0.521) |
1.347 | 0.260 |
| Performance | 3.60 (0.501) |
3.82 (0.580) |
3.74 (0.731) |
3.53 (0.676) |
1.426 | 0.236 |
| Outlook | 3.72 (0.713) |
3.81 (0.557) |
3.86 (0.661) |
3.63 (0.164) |
0.517 | 0.671 |
| Tangibility | 3.72 (0.929) |
3.89 (0.572) |
3.86 (0.670) |
3.65 (0.731) |
0.762 | 0.516 |
There is no significant difference among age groups with respect to post purchase factors of respondents Muthukumaran. Since p>0.05
Hence the null hypothesis is accepted at 5% level with respect to factors of post purchase.
Findings
The study identified that there are more female users than male in the age bracket of 21-35 years which is maximum covered by the young adults’ i.e., 21-26 and adults’ i.e., 27-35 years of age. Along with these it is observed that the working class is finding this alternative more performance efficient and price efficient considering the current rise in petroleum prices and its subsidiary products Verma et al. (2020). Maximum users fall under the 5 lakhs to 10 lakhs annual income families and the most of them responded that they are using these e bikes that are accessible to them are being used for domestic commute and not for the purpose of long rides or off-road which needs much more performance capacity in terms of battery range, re-charging infrastructures and engine or vehicle body build to sustain higher usage Sivasakthi & Geethanjali (2020). Irrespective of the age group the user he/she are looking forward to ride an e-bike for economical and for sustainable reasons. The users of e-bikes had a positive correlation with the post purchase factors: reliability, performance, outlook and tangibility.
Conclusion
Due to increased demand and public awareness of the need to maintain a green and eco-friendly environment, e-bikes have experienced a sharp increase in the number of riders, and manufacturers are competing to design and build the most comfortable two-wheelers possible. Phase 2 of the e-bike boom began in the middle of 2021, with conventional 2-wheeler customers showing interest in purchasing e-bikes. This can be considered as a boon to the industry and eco system, but the expectations towards the products that are already in the marketing are not meeting the desired standards. As a result, the bulk of our users had less than a year of experience with it. The yearly income of a family has a significant influence on buying decisions and specifies the market group in which a person could buy. There are exceptions to this rule, but it is basically the same. The graph shows that middle-income groups are more likely to seek the most efficient use of resources at the lowest feasible cost without sacrificing the utility function that items provide.
References
Anifa, M. (2018). Perception and Awareness Level of Potential Customers towards Electric Cars. International Journal for Research in Applied Science and Engineering Technology, 6, 359-362.
Bhalla, P., Ali, I. S., & Nazneen, A. (2018). A study of consumer perception and purchase intention of electric vehicles. European Journal of Scientific Research, 149(4), 362-368.
Dutta, B., & Hwang, H. G. (2021). Consumers Purchase Intentions of Green Electric Vehicles: The Influence of Consumers Technological and Environmental Considerations. Sustainability, 13(21), 12025.
Indexed at, Google Scholar, Cross Ref
Gujarathi, P.K., Shah, V.A., & Lokhande, M.M. (2018). Electric vehicles in India: Market analysis with consumer perspective, policies and issues. Journal of Green Engineering, 8(1), 17-36.
Indexed at, Google Scholar, Cross Ref
Hidrue, M. K., Parsons, G. R., Kempton, W., & Gardner, M. P. (2011). Willingness to pay for electric vehicles and their attributes. Resource and energy economics, 33(3), 686-705.
Indexed at, Google Scholar, Cross Ref
Imthiyaz, A., Ayub, K.D. (2020). “Customer satisfaction of Indian electric cars in the light of green marketing strategies”
Meenakshi, A. Satisfaction of consumers regarding bajaj pulsar motor bike a study in tirunelveli district.
Mohamed, M., Tamil Arasan, G., & Sivakumar, G. (2018). Study on electric vehicles in India opportunities and challenges. International Journal of Scientific Research in Environmental Science and Toxicology.
Muthukumaran, C.K. Customer satisfaction a comparative analysis of small cars with reference to Puducherry region.
Sasimath, K.B. (2019) A Study of Customer Satisfaction Towards Automobile Industries in India with reference to North Karnataka.
Sivasakthi, D., & Geethanjali, P. (2020). “A study on customer satisfaction towards Ampere electric bike with special reference to Coimbatore city”
Tupe, M.O., Kishore, S., & Johnvieira, A. (2020). Consumer perception of electric vehicles in India. European Journal of Molecular & Clinical Medicine, 7(8), 2020.
Verma, M., Verma, A., & Khan, M. (2020). Factors influencing the adoption of electric vehicles in Bengaluru. Transportation in Developing Economies, 6(2), 1-10.
Indexed at, Google Scholar, Cross Ref
Received: 10-May-2022, Manuscript No. AMSJ-22-11907; Editor assigned: 11-May-2022, PreQC No. AMSJ-22-11907(PQ); Reviewed: 25-May-2022, QC No. AMSJ-22-11907; Revised: 27-May-2022, Manuscript No. AMSJ-22-11907(R); Published: 30-May-2022
