Review Article: 2022 Vol: 26 Issue: 4
A Study on the Performance of Sbi Pre and Post-Merger using the Camel Model
Prasad Kandi V.S., Koneru Lakshmaiah Education Foundation, Deemed to be University
Sai Anvitha V., Koneru Lakshmaiah Education Foundation, Deemed to be University
Citation Information: Kandi, P., & Anvitha, S. (2022) A study on the performance of SBI pre and post-merger using the camel model. Academy of Marketing Studies Journal, 26(4), 1-10.
Abstract
Banks play a vital role in the economic development of any country. Therefore, it is very important to understand the functioning of banks from time to time. The performance of banks can be measured in various aspects using various parameters. One such model to evaluate the bank’s performance in 5 parameters is the CAMEL model. In this study, the CAMEL model is used to evaluate the performance of SBI over 8 years and how the merger of SBI with 5 of its subsidiaries and Bharatiya Mahila Bank affected the overall performance of SBI.
Keywords
Capital adequacy, Asset quality, Management efficiency, Earnings quality, Liquidity position.
Introduction
Banks are financial institutions that accept money from people in the form of deposits and lend this money to individuals and institutions. The banking system is an important component of the country’s economic environment. The banking sector helps in the generation of investments to increase the capital available, improves both international and internal trade activities along with assisting the monetary policies. Thus, it is very important to have a proper evaluation of the bank’s performance and operation of banks regularly. This helps in having a strong financial system and a healthy economy. To evaluate the performance of the banking industry, it is necessary to use efficient indicators. CAMEL model is one such model which considers different important indicators and evaluates the performance of banks in six categories namely:
1. Capital Adequacy,
2. Asset quality,
3. Management efficiency,
4. Earnings quality,
5. Liquidity position.
This CAMEL concept was developed in 1979 by Federal Financial Institutions Examination Council (FFIEC). These 5 indicators help us to compare and understand the performance of a bank.
The CAMEL model is utilized to assess SBI's performance in this study. SBI is the world's 43rd largest bank He, et al. (2022). The Bank of Bengal, the Bank of Bombay, and the Bank of Madras combined in 1921 to form the Imperial Bank. In 1955 it was renamed as The State Bank of India. In 2017, Bharatiya Mahila Bank and five of SBI subsidiaries (State Bank of Bikaner and Jaipur, State Bank of Hyderabad, State Bank of Travancore, State Bank of Patiala, State Bank of Mysore) merged into SBI. The performance of SBI before and after the merger is evaluated in this study.
Review of Literature
Pandit & Gandhi (2021) from GLS University studied the performance of SBI and HDFC banks. This study is a comparative study and based on the results of 23 ratios used in the study, they have concluded that both the banks performed well in some parameters. HDFC has better performed in Capital Adequacy, Asset Quality, and Management efficiency whereas SBI has a better performance in terms of Liquidity. Both the banks have equal performance in terms of earnings quality.
Panboli & Birda (2019) examined the performance of selected private sector and public sector banks from 2012-2013 to 2016-2017. SBI, PNB, BOB, UBI, and Canara bank are the five public sector banks considered for this study. ICICI, HDFC, Axis, YES, and Kotak Mahindra are the five private sector banks. After evaluating the results of these institutions using the five factors of the CAMEL model, they discovered that private sector banks outperform public sector banks.
Lavanya & Srinivas (2018) from CBIT, Hyderabad conducted a study on ICIC Bank, HDFC Bank, Axis Bank, Kotak Mahindra, and Yes Bank from the time period of 2013 to 2017. After averaging all the ranks given to each bank in all 5 CAMEL parameters, they concluded that ICICI stood in first place followed by HDFC Bank.
Kumar & Malhotra (2017) from Kurukshetra University used the CAMEL approach on selected private banks and ranked the banks based on their research. In this study, the banks were given a ranking for each CAMEL parameter along with an overall ranking. For the study, they have selected the top 5 banks listed on the BSE and they include HDFC Bank, ICICI Bank, Kotak Mahindra Bank, Axis Bank, and IndusInd Bank. After analyzing the 5 banks, they concluded that Axis Bank has better performance when compared to the other four.
Sushendra Kumar Mishra along with Parvesh Kumar Aspal analyzed the performance of SBI and its subsidiaries. They concluded that there was a tiny difference in the performance of these banks after the study, but that these changes were insignificant after employing ANOVA employed the CAMEL model to analyze bank performance. Eight public sector banks and seven private sector banks were selected for this study based on the size of their assets. According to their observations, private sector banks outperform public sector banks.
Mathiraj & Ramya (2009) an Assistant Professor from Alagappa University investigated the performance of 5 banks and their values are interpreted in a statistical way using ANOVA. Based on this research it is concluded that all the banks considered for the study are having a good capital structure.
Research Gap
The entire financial stability of any economy is highly dependent on the banking sector of the country. Hence having a strong and efficient banking sector is crucial for the development of a country. As the economic conditions are volatile in nature, it is very essential to have a continuous monitoring system to understand the ups and downs. Hence the performance should be evaluated from time to time so that the new changes are included in the study.
Research questions
1. How is the performance of SBI before and after its merger in 2017?
2. Did the bank achieve synergy after its merger in 2017?
Objectives
1. To study the presence of synergy after the merger in 2017.
2. To evaluate the performance efficiency of the SBI Pre and Post-merger using CAMEL attributes.
Hypothesis
H0: There is no change in the financial performance of SBI after a merger.
H1: There is a change in the financial performance of SBI after the merger.
Research Methodology
To understand the performance of SBI and the effect of mergers (if any) on its financial performance this study was conducted. CAMEL model is used for this analysis. The performance of the SBI over 8 years (from 2014 to 2021). This study relies on secondary data, which was obtained from SBI's annual reports and the SBI website. To understand the significance of these ratios Chow test is conducted.
The different ratios used in this study for the 5 parameters include:
1. Capital Adequacy: Capital Adequacy Ratio, Advances to Total Assets Ratio
2. Asset Quality: Net NPA to Net Advances Ratio, Total Investments to Total assets
3. Management Efficiency: Profit per Employee, Return on Equity
4. Earnings Quality: Dividend pay-out ratio, Net Profits to Total Assets
5. Liquidity Position: Liquidity Coverage Ratio, Credit Deposit Ratio
Data Analysis
Capital Adequacy
The Capital Adequacy parameters help us to assess the bank’s compliance with the regulations. This helps in understanding the capital position of an institute and how safe is people’s money Table 1.
| Table 1 Results of SBI Capital Adequacy before and after the Merger | ||
| Financial year | Capital Adequacy Ratio (in %) | Advances to Total Assets Ratio (in %) |
| 2013-2014 | 12.44 | 67.48 |
| 2014-2015 | 12.00 | 63.48 |
| 2015-2016 | 13.12 | 62.08 |
| 2016-2017 | 13.11 | 58.06 |
| 2017-2018 | 12.60 | 56.01 |
| 2018-2019 | 12.72 | 59.38 |
| 2019-2020 | 13.06 | 58.85 |
| 2020-2021 | 13.74 | 54.02 |
| Average before merger | 12.6675 | 62.78 |
| Average after merger | 13.03 | 57.06 |
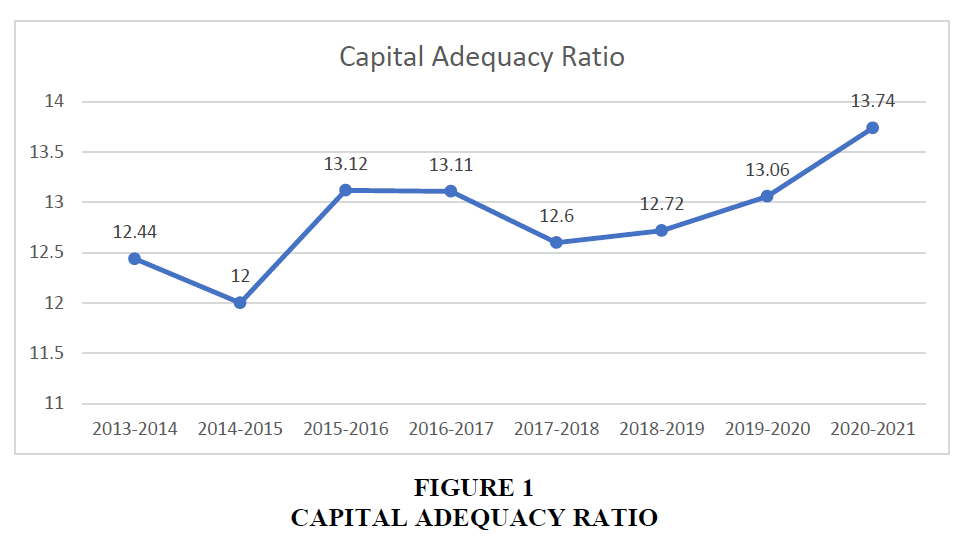
From the above analysis, we can see that SBI has a mixed performance in terms of Capital adequacy. The Capital adequacy ratio of SBI decreased immediately after the merger (from 13.11% to 12.60%). From the 2018-2019 financial year, we can see that there is a steady increase for the next 3 years and a positive change in the average (from 12.6675% to 13.03%). At the same time, the Advances to Total Assets ratio has a downfall even before the merger (decrease from 67.48% to 58.06% over 4 years). After the merger, it has shown a slight growth for one year (59.38% in the 2018-2019 financial year) but continued to decrease again in the next years. The average for Advances to total Assets has also shown a decrease over the years after the merger (from 62.78% to 57.06%) Figure 1.
The above line chart represents the change in the Capital Adequacy ratio of SBI over the last 8 years. From the chart, we can see that there is a structural break at 2 points (2014-2015 and 2017-2018). The change in 2017-2018 (merger year) shows a bit of a downfall. From then there is a positive change in the Capital Adequacy ratio. To understand the significance of this change Chow test is conducted. The p-value of the test is 0.01695. As the value is less than 0.05, we can conclude that the change in efficiency is significant.
Asset Quality
This parameter helps us to understand the quality of the assets that the bank has. This is important as the value of the assets is volatile in nature and thus has high risk. It helps in understanding the credit risk and how the banks are monitoring the credit risk Table 2.
| Table 2 Results of SBI Asset Quality before and after the Merger | ||
| Financial year | Net NPA/Net Advances Ratio (in %) | Total Investments to Total assets (in %) |
| 2013-2014 | 2.57 | 22.25 |
| 2014-2015 | 2.12 | 23.52 |
| 2015-2016 | 3.81 | 24.42 |
| 2016-2017 | 3.71 | 28.31 |
| 2017-2018 | 5.73 | 30.71 |
| 2018-2019 | 3.01 | 26.27 |
| 2019-2020 | 2.23 | 26.50 |
| 2020-2021 | 1.50 | 29.81 |
| Average before merger | 3.0525 | 24.62 |
| Average after merger | 3.1175 | 28.32 |
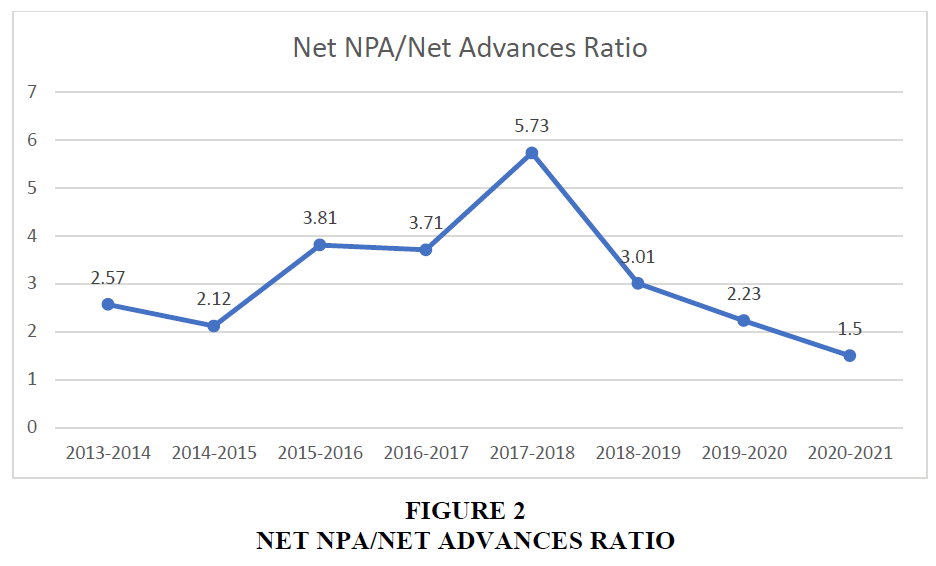
The above table helps us to understand that the Asset quality of SBI has increased after the merger. The net NPA to net advances ratio has been changing in both directions before merger but immediately after the merger, it showed strong growth (an increase from 3.71% to 5.73%). After the first year of the merger, it failed to maintain its growth and showed a decrease in the result (a decrease from 5.73% to 1.50% in 4 years). The total investments to total assets ratio have a steady growth before the merger (increase from 22.25% to 28.31% in 4 years), but later the SBI struggled to maintain the growth. Later in the 2020-2021 financial year, there is a positive change in this ratio (an increase from 26.50% to 29.81%) Figure 2.
The above line chart represents the change in the net NPA to Net Advances ratio of SBI over last 8 years. From the chart, we can see that there is a major structural break in 2017-2018 (merger year). There is a huge increase in the value of the ratio in the first year after the merger and from then it decreased. To understand the significance of this change Chow test is conducted. The p-value of the test is 0.003658. As the value is less than 0.05, we can conclude that the change in efficiency is significant.
Management Efficiency
This parameter helps us to understand the ability of the institute’s management team and how they identify and respond to financial stress. This helps us to understand which banks are having better managerial efficiency Table 3.
| Table 3 Results of SBI Management Efficiency before and after the Merger | ||
| Financial year | Profit per Employee (in 000) | Return on Equity (in %) |
| 2013-2014 | 485 | 10.49 |
| 2014-2015 | 602 | 11.17 |
| 2015-2016 | 470 | 7.74 |
| 2016-2017 | 511 | 7.25 |
| 2017-2018 | -243 | -3.78 |
| 2018-2019 | 33 | 0.48 |
| 2019-2020 | 578.98 | 7.74 |
| 2020-2021 | 828.35 | 9.94 |
| Average before merger | 517,000 | 9.1625 |
| Average after merger | 299,332.5 | 3.595 |
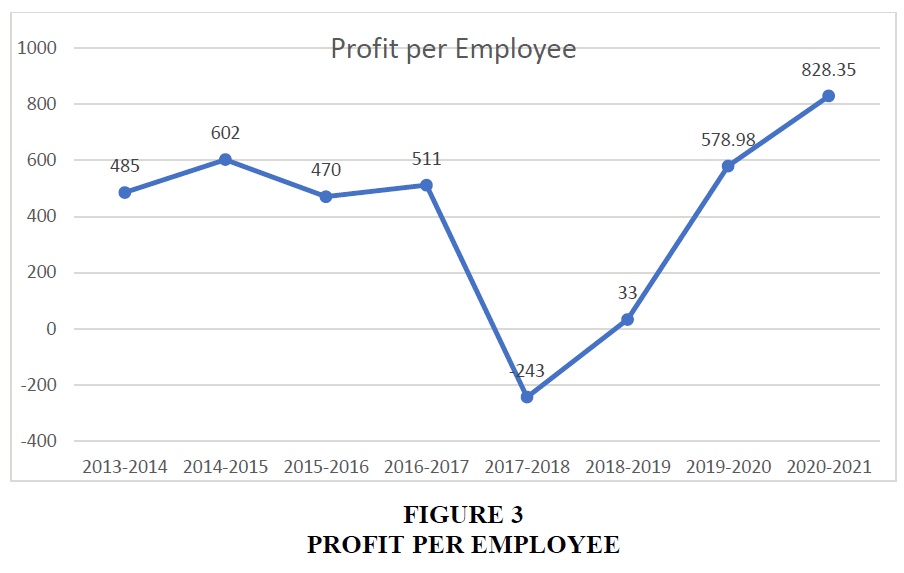
The above table clearly states that the Management efficiency of SBI decreased immediately after the merger. The profit per employee went into negative value for the only time (-243 in the 2017-2018 financial year) in this study immediately after the merger. From the 2018-2019 financial year, the profit per employee increased and in the 2020-2021 financial year, it showed the best results so far in the study (828.35). The return on equity ratio also became negative immediately after the merger (-3.78%). It recovered well in the next years and showed growth from then (increase from -3.78% to 9.94% in 4 years). But the bank has still not achieved the average Return on equity it has before the merger i.e., 9.1625% Figure 3.
The above line chart represents the change in the profit per employee ratio of SBI over the last 8 years Sharma & Arora (2016). From the chart, we can see that there is a major structural break in 2017-2018 (merger year). There is a heavy downfall in the value of the ratio in the first year after the merger and from then it slowly improved. To understand the significance of this change Chow test is conducted. The p-value of the test is 0.01443. As the value is less than 0.05, we can conclude that the change in efficiency is significant.
Earnings Quality
Earnings quality helps us to understand the long-term viability of the organization. It helps us to understand the financial growth of a bank and its competitiveness. This parameter tells us about the profitability of banks Table 4.
| Table 4 Results of SBI Earnings Quality before and after the Merger | ||
| Financial year | Net Profits to Total Assets (in %) | Dividend pay-out ratio (in %) |
| 2013-2014 | 0.61 | 20.56 |
| 2014-2015 | 0.64 | 20.21 |
| 2015-2016 | 0.42 | 20.28 |
| 2016-2017 | 0.39 | 20.11 |
| 2017-2018 | -0.19 | NA |
| 2018-2019 | 0.02 | NA |
| 2019-2020 | 0.37 | NA |
| 2020-2021 | 0.45 | 17.49 |
| Average before merger | 0.51 | 20.29 |
| Average after merger | 0.16 | 4.3725 |
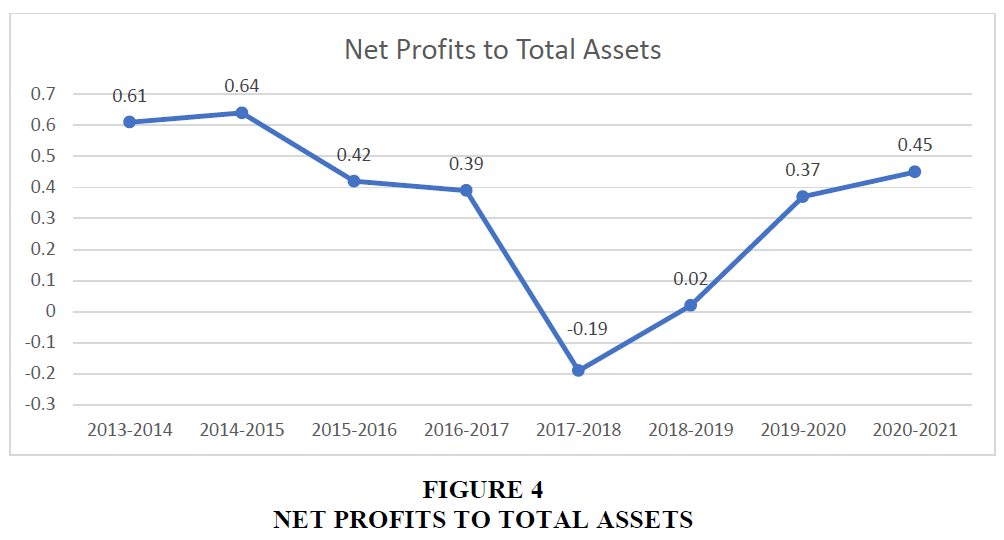
In terms of Earnings quality, we can see that there is a decrease in the performance of SBI after the merger. Both the Dividend pay-out ratio and Net profits to total Assets ratio have decreased after the merger. The average Dividend pay-out ratio decreased from 20.29% to 17.49% and the average Net profits to total assets ratio decreased from 0.51% to 0.16%. The dividend pay-out ratio has very minimal variations before the merger but after the merger, there was no dividend pay-out ratio for 3 years. In the 2020-2021 financial year, the bank again started giving dividends. In terms of Net profits to total Assets also, there is a decrease in the ratio even before the merger, but immediately after the merger, the ratio became negative (-0.19%). Since then, the bank was making steady progress to improve its Net profits to total assets ratio Figure 4.
The above line chart represents the change in Net Profits to Total Assets ratio of SBI over the last 8 years. From the chart, we can see that there is a major structural break in 2017-2018 (merger year). The value became negative (-0.19). Over the next years, the SBI showed steady growth. To understand the significance of this change Chow test is conducted. The p-value of the test is 0.001473. As the value is less than 0.05, we can conclude that the change in efficiency is significant.
Liquidity Position
This parameter helps us to understand the ability of banks to fulfill their day-to-day requirements. For any bank, it is very essential to have a strong liquidity position. Otherwise, the bank may face several risks which can ultimately lead to bankruptcy Table 5.
| Table 5 Results of SBI Liquidity Position before and after the Merger | ||
| Financial year | Liquidity Coverage Ratio (in %) | Credit Deposit Ratio (in %) |
| 2013-2014 | 80.02 | 86.76 |
| 2014-2015 | 81.19 | 82.45 |
| 2015-2016 | 75.23 | 84.57 |
| 2016-2017 | 144.06 | 76.83 |
| 2017-2018 | 134.05 | 71.49 |
| 2018-2019 | 125.79 | 75.08 |
| 2019-2020 | 143.59 | 71.73 |
| 2020-2021 | 158.60 | 66.54 |
| Average before merger | 95.125 | 82.65 |
| Average after merger | 140.5075 | 71.21 |
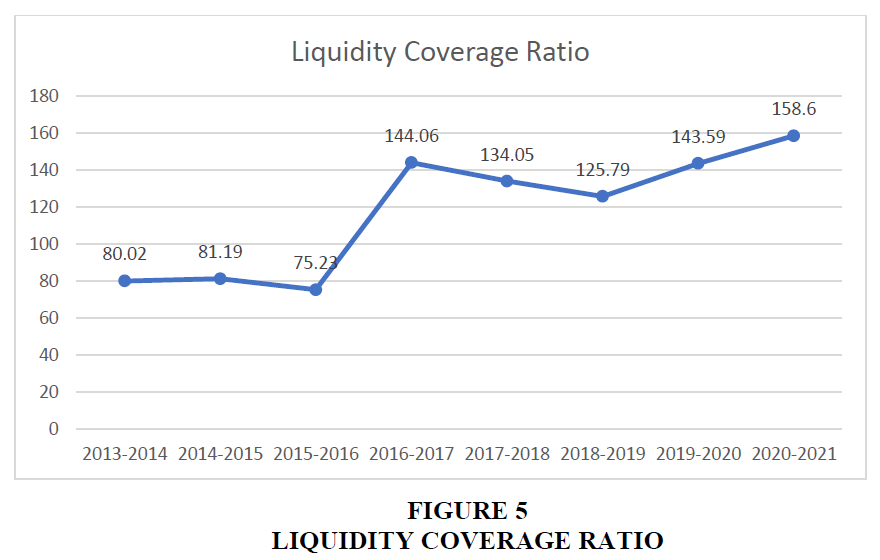
The SBI showed a mixed performance in terms of liquidity. The bank showed an improvement in its Liquidity coverage ratio up to the 2016-2017 financial year (an increase from 80.02% to 144.06%) except for 1 year (decreased to 75.23% in the 2015-2016 financial year). But there is a slight decrease for 2 years after the merger Magoma et al. (2022). Later again it gained momentum and improved its Liquidity coverage ratio (increase from 125.79% to 158.60% in 2 years). In terms of the Credit deposit ratio, there is a downfall before and after the merger. Only 2015-2016 (84.57%) and 2018-2019 (75.08%), showed a positive change but couldn’t maintain the same for the remaining years Misra & Aspal (2012) Figure 5.
The above line chart represents the change in the Liquidity Coverage ratio of SBI over the last 8 years. From the chart, we can see that there isn’t much change in 2017-2018 (merger year). The major change occurred in 2016-2017 and later in 2018-2019 Khalifa, et al. (2022). From this, we can understand that the bank started to show improvements in terms of liquidity 2 years after merger. To understand the significance of this change Chow test is conducted. The p-value of the test is 0.1374. As the value is greater than 0.05, we can conclude that the change in efficiency is not significant.
Findings
1. After analysing the performance of SBI over 5 parameters, we can understand that SBI has improved its performance in Asset Quality (positive change in average for both Net NPA to net advances ratio (3.0525% to 3.1175%) and Total investments to total assets ratio (24.62% to 28.32%)) and mixed performance in 2 areas i.e., Capital Adequacy, and Liquidity.
2. In the case of Capital adequacy one ratio used for analysis showed a positive change (increase in the average Capital adequacy ratio from 12.6675% to 13.03%) and the other showed a negative change (decrease in the average of Advances to total assets ratio from 62.78% to 57.06%). The same happened to Liquidity also (an increase in the average Liquidity coverage ratio (95.125% to 140.5075%) which isn’t much significant and a decrease in Credit deposit ratio (82.65% to 71.21%)).
3. The Earnings Quality and Management Efficiency of the bank reduced for a few years after the merger, but we can see steady growth over the last 2 years.
4. For Earnings quality, the average of both ratios decreased (Dividend pay-out ratio (20.29% to 4.3725%), net profits to total assets (0.51% to 0.16%)). For Management efficiency also the averages decreased for both ratios (Profit per employee (517,000 to 299,332.5) and return on equity (9.1625% to 3.595%)).
Suggestions
1. As the merger brought the employees together to work in one place, they should find a common ground to work together to help in the development of the SBI.
2. As the dividends were not given for 3 years after the merger, it reflected negatively on the Earnings Quality of the organization. SBI should work to provide dividends regularly to their shareholders.
Conclusion
From this study, we can understand that the SBI merger in 2017 has provided good results in Asset quality of the bank along with a better result in Capital Adequacy and Liquidity. At the same time, SBI struggled for the first few years after the merger in terms of Earnings Quality and Management Efficiency. But the SBI is slowly improving performance in all areas and showing positive results after the merger and has some synergy.
References
He, J., Guo, K., Chen, Q., & Wang, Y. (2022). Camel milk modulates the gut microbiota and has anti-inflammatory effects in a mouse model of colitis. Journal of Dairy Science, 105(5), 3782-3793.
Indexed at, Google Scholar, Cross ref
Khalifa, A., Sheikh, A., & Ibrahim, H.I.M. (2022). Bacillus amyloliquefaciens Enriched Camel Milk Attenuated Colitis Symptoms in Mice Model. Nutrients, 14(9), 1967.
Indexed at, Google Scholar, Cross ref
Kumar, V., & Malhotra, B. (2017). A Camel model analysis of private banks In India‖. EPRA International Journal of Economic and Business Review, 5(7), 87-93.
Lavanya, B., & Srinivas, T. (2018). Performance analysis using camel model- a study of select private banks. 5(6), 2018.
Magoma, A., Mbwambo, H., Sallwa, A., & Mwasha, N. (2022). Financial performance of listed commercial banks in tanzania: a camel model approach. African Journal of Applied Research, 8(1), 228-239.
Mathiraj, S.P., & Ramya, V. (2014). CAMEL model in banking Sector. Shanlax International Journal of Commerce, 2(1), 7-20.
Misra, D.S., & Aspal, P. (2012). A camel model analysis of State Bank Group. In Proceedings of 19th International Business Research Conference.
Indexed at, Google Scholar, Cross ref
Panboli, S., & Birda, K. (2019)“Camel Research of Selected Private and Public Sector Banks in India.”, 8(12).
Pandit, S., & Gandhi, J. (2021). A Comparative Study on the Financial Performance of SBI and HDFC Bank based on CAMEL Model.
Sharma, G., & Arora, A. (2016). Study of performance of Indian banks: A camel model approach. International Journal of Commerce and Management Research, 2(6), 14-18.
Received: 04-May-2022, Manuscript No. AMSJ-22-11907; Editor assigned: 11-May-2022, PreQC No. AMSJ-22-11907(PQ); Reviewed: 25-May-2022, QC No. AMSJ-22-11907; Revised: 27-May-2022, Manuscript No. AMSJ-22-11907(R); Published: 30-May-2022
