Research Article: 2018 Vol: 22 Issue: 4
Advanced IPA Assessment For Contemporary Exhibition Visitorテ「ツ?ツ?s Engagement Marketing
Chung Ling Huh, Fu Jen Catholic University
Wei-Guang Tsaur, Fu Jen Catholic University
Hung-Ming Yeh, Fu Jen Catholic University
Shih-Shiunn Chen, Fu Jen Catholic University
Wei-Jen Chen,Fu Jen Catholic University
Keywords
Exhibition Visitors, Engagement, Generation, Advanced IPA, Discrimination Index.
Introduction
According to the Global Association of the Exhibition Industry (was originally called Union des Foires Internationales, UFI) (UFI, 2016), the top three exhibition countries were the USA with 21%, an increase of 5% since 2006, China with 15%, an increase of 48% since 2006 and Germany with 10%, an increase of 2% since 2006. Asia has become the second largest exhibition market during the past decade; however, there has been very little research on Asian exhibition visitor’s engagement on different generation perspectives.
This study adapted the conceptual model for the effectiveness of an event research was originally developed from the literature on sponsorship and advertising effectiveness as well as the emotional responses within consumer behavior and neuropsychological theory (e.g., Martensen and Hansen, 2007; Chakraborti and Roy, 2013; Huh, 2018). At 2013, Chakraborti & Roy, in their study on the Meaning of Transfer between Events and Sponsor Brands: Integrating the Role of Emotions, they modified the model to investigate the practitioner’s need to choose the events to sponsor and promote their brands. At 2014 Kozinets raised the phrase “consumer-brand engagement” is used instead of the word engagement in the academic area (Kozinets, 2014). Kozinets (2014) also noted that engagement has been defined as a type of multidimensional and multistep process guided by industry managers. In Kozinet’s (2014) literature review, the author stated that brand awareness and loyalty are not enough; managers need to seek both emotional commitment of the brand. In addition, interaction, participation, as well as sharing of brand-related values are essential to the concept of engagement. Therefore the commitment and engagement concept should be addressed when conducting effectiveness communication research. It also needed to explore the role of exhibitions in science communication by developing a conceptual model that links participant’s emotions, attitudes and retention of an event. In addition, it seeks to understand the interplay between exhibition perception and the participant’s satisfaction within an exhibition (Huh, 2018; & Wikipedia, 2016).
This research aim to use the effectiveness communication model to illustrates the directions of how an event should be designed to create both a positive commitment emotion and engagement attitude. In this communication model of commitment and engagement research, the following questions are raised: What do the different generations preference in their exhibition event experience? Which dimension do they valued most? The major focus of this paper is to compare the different generation’s points of view in regard to communication by using six latent variables to ascertain similarities and differences.
The original IPA cannot provide comparison within the same IPA, Discrimination Index and Iso-rating line methods are adapted to instead of the traditional quadrant IPA analysis, which results may increase the diagnostic value of the IPA (Liu et al., 2011). Therefore this research used advanced IPA to position the dimension of the communication model and different generation to compare the perception differences, the research result enables the PEO & PCO to review the visitor’s perceptions when they are formulating an exhibition management and marketing strategy. Therefore, the main purposes of this research are, providing a different generation’s perception comparison assessment of effectiveness communication model and using advanced IPA and Discrimination index analysis of the communication model to provide the PEO and PCO with guidelines when determining an exhibition’s management and marketing strategy.
Literature Review
Importance-Performance Analysis
Importance-Performance Analysis (IPA) is a popular tool that enables both the PEO and event planners to understand the event participant’s attitude and market competition, as well as to identify improvement priorities for various attributes of an event marketing strategy. Tafesse and Korneliussen (2010) conducted IPA for a trade show benchmarking tool analysis and Baker and Draper (2013) used IPA to study Italian festivals. The results helped organizers to identify areas for improvement.
IPA is a two-dimensional area divided into four quadrants as shown in the following (Liu et al., 2014):
1. Quadrant I: This quadrant’s point means that both the importance and performance are high and therefore the PEO should “Keep up the good work” to maintain it.
2. Quadrant II: This quadrant’s point demonstrates that the importance is high, but as its performance is low, its meaning is “Concentrate here”, so that the PEO should focus on these attributes.
3. Quadrant III: This quadrant shows that both the importance and performance of the attributes are low, meaning “Low priority”, so that the PEO can ignore it.
4. Quadrant IV: The importance attribute is low, but the performance is high, which is referred to as “Possible overkill” and so the strategy should be modified and the resources re-allocated to more important areas.
An Advanced IPA Discrimination Index
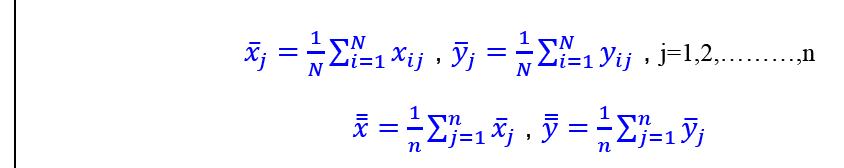
The IPA model can display potential information between different items in a questionnaire for decision making. Some studies adopt IPA as an evaluation tool to identify business performance and find some useful hidden information or serious weaknesses. Original IPA Equation:
The extension perspective of the Importance-Performance mapping, which is a 45-degree line, i.e., an Iso-rating or Iso-priority line used to support the inter-survey performance analysis, will improve the scale of the survey result analysis. On the one hand, when the points are above the line, it indicates that Importance exceeds Performance. On the other hand, when the points are below the line, it indicates the opposite. Using the line can provide extra concepts with two classes or categories for the IPA model discussion. The Iso-rating line instead of the traditional quadrant analysis yields results, which may be better and increase the diagnostic value of the IPA (Liu et al., 2011). The Iso-rating line of the IPA matrix is as follows as shown in Figure 1.
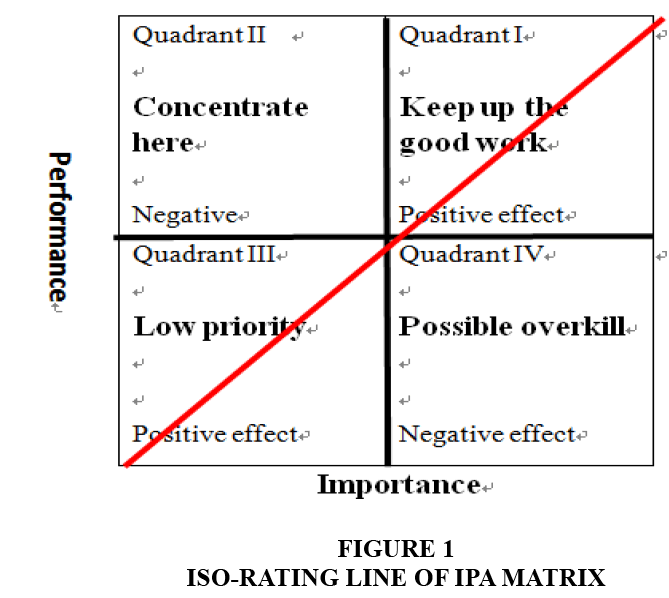
Figure 1: ISO-Rating Line of IPA Matrix
Liu’s IPA discrimination index could be implemented to compare and distinguish the effects of different types of research events. It is well known that there are four quadrants in an I-P matrix. If the item is located inside Quadrant I or III, it implies a positive quality of the visitor’s service, otherwise it must be improved. Furthermore, there is no quantitative method to determine the performance between any couple of IPA models, with an original discrimination index of the IPA model being proposed as follows (Liu et al., 2011). The diagonal line across the intersection of the Importance-axis and Performance-axis with slope=1 is the most important location for the IPA model and the contributing value of each item in Quadrant I or III should be a positive value. Besides, it will be a negative value when the point is located in Quadrant II or IV. However, if (xi-x) (yi-y)=0, then |(xi-x) (yi-y)|=0 and Dindex-ori-1 is undefined and hence the above-mentioned discrimination index must be amended. Moreover, we also know that [(xi-x)-(yi-y)]² is more sensitive than |(xi-x)-(yi-y)| and therefore an improved discrimination index for the IPA model is as follows (Liu et al., 2012):
Original Discrimination Index Equation:
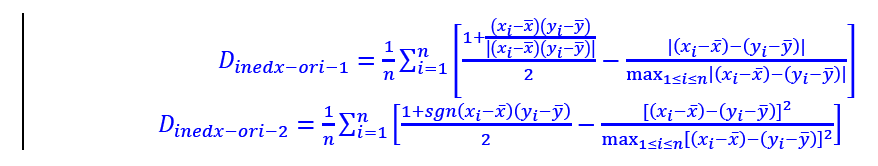
Advanced Discrimination Index Equation:
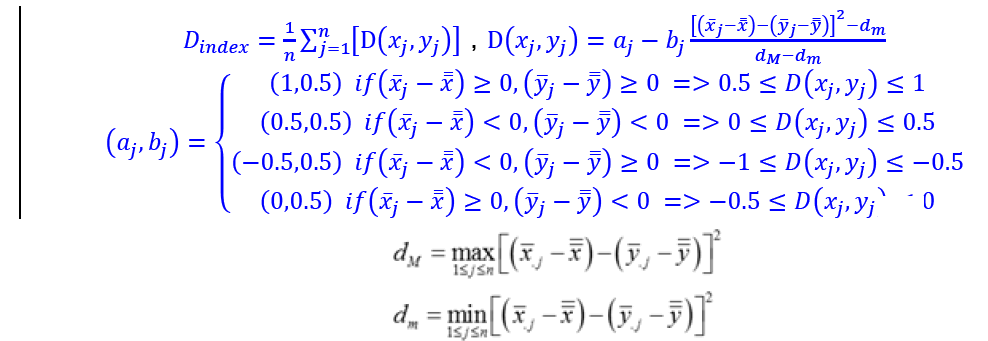
The purpose of the D-index formula is to arrive at a value between 0 and 1, where quadrant I>III quadrant>II quadrant>IV quadrant and the point in the same quadrant that is closer to the Iso-rating line provides a better result.
Generation
A generation may consist of 20 years. Each generation is identified by birth year and outlook, intentions and preferences that are the result of significant life experiences. Generations have typically been defined as the Matures, the Baby Boomers, Generation X, Generation Y and Generation Z. Matures (people born prior to 1945) have been described as dutiful, loyal and hardworking, but not comfortable with electronic communications since they consider them impersonal. Baby Boomers (born between 1946 and 1964) have been described as open-minded, willing to experiment and likely to adopt information communication technologies. Generation X (born between 1965 and 1982) are generally considered to be more comfortable with technology than Baby Boomers because they have been exposed to computer technology earlier and prefer information communication technologies, particularly e-mail. Generation Y (born after 1982) who are referred to as the Millennial or the Internet Generation, prefer collaboration through technology, enjoy social networking, enjoy being on the Internet and share ideas through virtual communities. Generation Z (born after 2000) make up the cohort of people born after Generation Y (the Millennials). This generation is most commonly defined with birth years starting in the mid-1990s and the early 2000s have also been used as the starting birth years for this generation. A significant aspect of this generation is its widespread usage of the Internet from a young age. Members of Generation Z are typically thought of as being comfortable with technology and interact on social media websites for a significant portion of their socializing (Severt et al., 2013).
Measuring the Effectiveness of an Exhibition Event- Research Model & Questionnaires
This research adopted effectiveness communication model for exhibition commitment and engagement is presented in Figure 2. The research questionnaire used the questionnaire that Martensen et al., 2007; Chakraborti & Roy, 2013 & Huh, 2018, used in their studies to measure the effectiveness of an event.
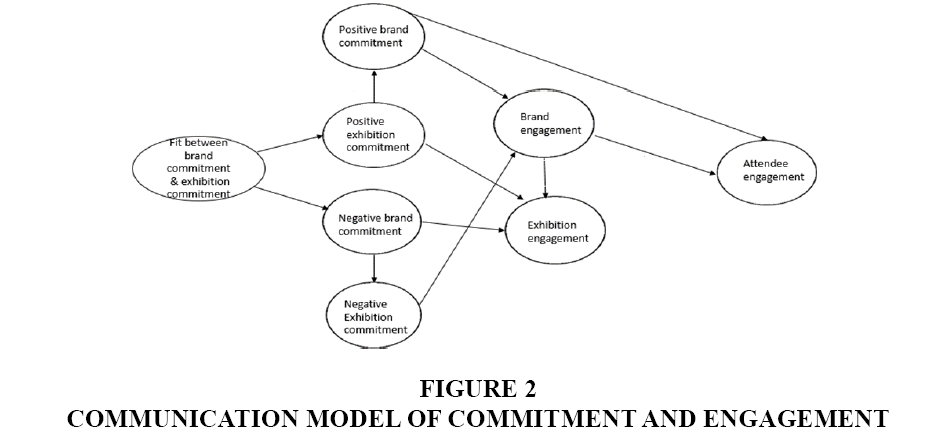
Figure 2: Communication Model of Commitment and Engagement
To measure Brand and Exhibition event commitment emotions, questionnaires were developed in order to ask a visitor to what extent a person has the emotions or feelings stated below toward an exhibition event and whether they have any brand commitment emotions. Positive brand and exhibition event commitment emotions include Joy, Healthy, Fine, Critical, Wanted, Success, Pretty, Expectation, Stimulation and Fresh. Negative brand and exhibition event commitment emotions include Worry, Annoyed, Pain, Boring, Sad and Doubt (Martensen et al., 2007; Chakraborti and Roy, 2013 & Huh, 2018).
As for the fit between brand and exhibition event commitment, this study developed a question: the exhibition activities have a positive communication effect on the exhibition brand, the exhibition brand has a specific advertisement communication effect, the exhibition brand clearly transmits the image of the exhibition’s activities, the exhibition’s activities are associated with the exhibition brand and after visiting the exhibition, visitors have a further understanding of the exhibition brand (Martensen et al., 2007; Chakraborti and Roy, 2013; & Huh, 2018).
With respect to the measurement of brand engagement attitude, the questions concerning the visitor’s attitudes toward the brand revolved around the following: this exhibition brand is a good brand, this exhibition brand is a good brand when compared with other similar brands, visitors have a positive perception of this exhibition brand, selecting this exhibition brand would be a good decision, visitors are willing to pay a higher ticket price for this exhibition brand, this exhibition brand has an advantage when compared with other similar brands, this exhibition brand is both a reliable and a credible brand, visitors are interested in this exhibition brand and visitors are interested in getting more information about this exhibition (Martensen et al., 2007; Chakraborti and Roy, 2013; & Huh, 2018).
As for the measurement of exhibition engagement attitudes, questions were based on: this exhibition’s activities including the exhibition brand’s information are suitable, this exhibition’s activities have an entertainment effect, this exhibition’s activities are successful, this exhibition’s activities are well arranged, visitors are willing to recommend this exhibition’s activities to others, visitors are interested in participating in this exhibition’s activities and this exhibition’s activities have increased visitor interest toward this exhibition brand (Martensen et al., 2007; Chakraborti and Roy, 2013; & Huh, 2018).
For visitor engagement measurement, the questions have encompassed the following: visitors are willing to participate in the next exhibition and are willing to recommend this exhibition to others, this exhibition brand is suitable and these exhibition activities gave the visitors information about the exhibition brand so that they would like to participate in the next exhibition (Martensen et al., 2007; Chakraborti and Roy, 2013; & Huh, 2018).
Methodology
Data Collection and Sampling
The 2016 International Winter Travel Exhibition was selected. The exhibition event was held from Jan 8-11, 2016, the venue was the Taipei Nankang Exhibition Hall. In 2016, it attracted over 30,000 visitors, with a total 300 exhibitors who occupied 1,000 booths.
Because the subjects in this study were confined to the native Taiwanese population, the questionnaire was therefore written using traditional Chinese characters. With respect to data collection, a pilot test was conducted on Jan 8, 2016 and its results showed that the questionnaire needed to be more specific in explaining the brands associated with the exhibition, so that the questionnaire was amended according to these results. The survey sampling took place from Jan 9-11, 2016, with a total of 8 trained investigators participating in the data collection process. In order to review the performance of the effectiveness model and achieve the research’s main objective of validating the effectiveness communication model of an exhibition, comparison assessments of different target audiences and different generations were conducted. As Hair et al. (2006) suggested that minimum sample sizes of between 100 and 150 are required to achieve a stable MLE result; the final overall sample consisted of 250 questionnaires. As a result, 217 valid samples were obtained.
Research Method
For measurement assessment, this study began with the descriptive statistics contained in the IBM SPSS statistical package 20 for the demographic information, which contributed to realizing the characteristics of the data collected. A three-stage analytical procedure was performed using the data to ensure that the findings were derived from a well-constructed instrument possessing sound psychometric properties. Stage one consisted of analyzing demographic information to realize the characteristics of the data collected. Stage two, Importance-Performance Analysis (IPA) and stage three, advanced IPA D-index analysis was performed by using Excel 2013 software for the assessment of different generations.
IPA (Importance-Performance Analysis) was used to identify improvement priorities for various variables in an exhibition event marketing strategy. The IPA assessment included both original IPA analysis and different generation IPA comparisons. An advanced IPA discrimination index for both different latent variables and different generation IPA comparison assessments was also included.
Results
Demographic Information
Items assessing demographic characteristics were included in the questionnaire. Visitors were asked to report their gender, age, education, awareness of emotional commitment toward the brand & exhibition and engagement attitude toward the exhibition.
According to the results of the demographic information from the samples, female visitors accounted for 59.4% of the sample, which was higher than the share of male visitors of 40.6%. In terms of age, the majority were 16-38 years old accounting for 39.6%, followed by those 36-51 years old with 33.6%. 75.1% of the visitors had an education level that included college or university. The percentage of local Taiwanese visitors attracted by the International Winter Travel Exhibition 2016 was 70.5, which shows that the exhibition was effective in attracting the attention of the local Taiwanese as a result of the media marketing campaign. 52% of the visitors had attended the International Winter Travel Exhibition at least once before and 42.4% of visitors were attending for the first time. A total of 82% visitors were satisfied with the exhibition, but 5.6% were dissatisfied. This result showed that the exhibition was successful but that the crowd & queuing management of this exhibition needed improvement.
Mapping Variables in the IPA Quadrant Grid
To identify improvement priorities for various variables in an exhibition event marketing strategy, for instance, mapping latent variables into the IPA quadrant assessment. The Brand commitment emotion, Exhibition commitment emotion and Fit between brand and exhibition commitment fall into quadrant I, which represents visitors who consider that these 3 construct variables are satisfactory and that the PEO should “Keep up the good work” to maintain it. However, the construct variables for Brand engagement attitude, Exhibition engagement attitude and Visitor engagement are mapped into quadrant III, which refers to a Low priority and the PEO can ignore them.
The results from the survey question positioned in the IPA quadrant assessment are as shown in Tables 1 and 2 and Figure 3. All attributes are distributed into four quadrants to represent more detailed information from the analysis. The visitor perceptions regarding whether the exhibition activities are successful or whether the exhibition brand has a specific advertisement communication effect convey the message of “Concentrate here”, indicating that the PEO should focus on those attributes. The positive brand commitment emotion of Stimulation, where the visitor considers that the exhibition brand is both a reliable and a credible brand and is willing to recommend the exhibition to others, gives rise to the result of “Possible overkill”. Thus, the PEO’s strategy should be modified and the resources should be re-allocated to more important areas.
| Table 1 Positioning of Latent Variables in the IPA Quadrant |
|
| Latent variable | IPA quadrant |
| Brand commitment emotion | Keep up the good work |
| Exhibition commitment emotion | Keep up the good work |
| Fit between brand and exhibition commitment | Keep up the good work |
| Brand engagement attitude | Low priority |
| Exhibition engagement attitude | Low priority |
| Visitor engagement | Low priority |
| Table 2 Question Positioning in IPA Quadrant |
|
| Quadrant | Questions positioned in |
| Keep up the good work | q1-11, q1-12, q1-13, q1-14, q1-15, q1-16, q2-11, q2-12, q2-13, q2-14, q2-15, q2-16, q3-2, q3-5, q3-6, q4-4, q4-5, q5-4, q5-5, q6-3 |
| Concentrate here | q4-3, q5-2 |
| Low priority | q1-1, q1-2, q1-3, q1-4, q1-5, q1-6, q1-7, q1-8, q1-10, q2-1, q2-2, q2-3, q2-4, q2-5, q2-6, q2-7, q2-8, q2-9, q2-10, q3-1, q3-3, q3-4, q3-8, q3-9, q4-1, q4-2, q4-6, q4-7, q5-1, q5-3, q6-1, q6-4 |
| Possible overkill | q1-9, q3-7, q6-2 |
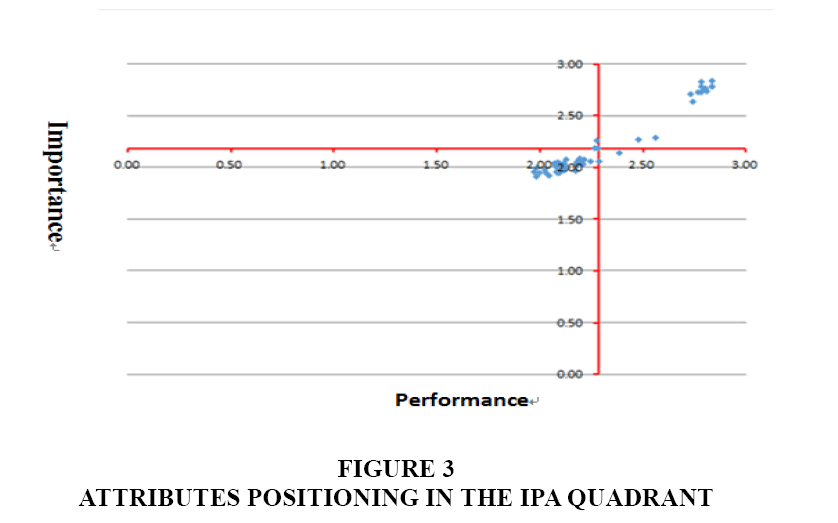
Figure 3: Attributes Positioning in the IPA Quadrant
As for the assessment of the IPA matrices for the comparison of the six dimensions of the commitment and engagement communication model, the dimension of the brand commitment emotion has the best performance (0.6832). This study found that the brand commitment emotion has the best performance and the participants recognized this category of the communication model as being a much more valuable one based on the proposed advanced IPA discrimination index. The brand engagement attitude dimension has the lowest D-index value (0.1378) when compared with the other dimensions. The D-index value corresponds to the matrix analysis with the commitment and engagement communication model and a quantitative demonstration is shown as follows in Table 3.
| Table 3 D-index |
|
| D-index | |
| Brand commitment emotion | 0.6832 |
| Exhibition commitment emotion | 0.5396 |
| Visitor engagement | 0.4920 |
| Fit between brand and exhibition commitment | 0.4843 |
| Exhibition engagement attitude | 0.4760 |
| Brand engagement attitude | 0.1378 |
Generations IPA Comparison
For the 6 generations of the IPA comparison assessment (Table 4), the results demonstrate that generation Z, Y and X have significant differences in their perceptions of the 6 construct variables. Generations Z and Y consider the brand commitment emotion need “Concentrate here”, in which case the PEO should be focused on this variable, but generation X, the Baby boomers and the Mature generation think that the PEO should “Keep up the good work” to maintain it. In regard to the exhibition commitment emotion and exhibition engagement attitude, all 5 generations consider it important to maintain and keep up the good work. In terms of the fit between brand and exhibition commitment, generation Z, the Baby boomers and the Mature consider that the response is to keep up the good work, but generation Y think that the response should be to concentrate here, in which case the PEO should be focused on this variable and if the perception of generation X is that it is a low priority, this suggests that the PEO can ignore it. The results in relation to the brand engagement attitude, the Baby boomers and the Mature generation think the response should be to keep up the good work, but generations Z and X consider that it has a low priority and should be ignored, while generation Y considers the response has possible overkill, which means the strategy should be modified and the resources should be re-allocated to more important areas. As for the visitor engagement variable, the Baby boomers and the Mature generation also think that the response is that it should keep up the good work, but generations Z and Y consider the response to be possible overkill, which means that the strategy should be modified and the resources should be re-allocated to more important areas. Generation X thinks that the response has a low priority which the PEO can ignore.
| Table 4 Positioning of Generations in Original IPA Quadrant |
|||||
| Latent variables | Generation Z | Generation Y | Generation X | Baby Boomers | Matures |
| Brand commitment emotion | Concentrate here | Concentrate here | Keep up the good work | Keep up the good work | Keep up the good work |
| Exhibition commitment emotion | Keep up the good work | Keep up the good work | Keep up the good work | Keep up the good work | Keep up the good work |
| Fit between brand and exhibition commitment | Keep up the good work | Concentrate here | Low priority | Keep up the good work | Keep up the good work |
| Brand engagement attitude | Low priority | Possible overkill | Low priority | Keep up the good work | Keep up the good work |
| Exhibition engagement attitude | Keep up the good work | Keep up the good work | Keep up the good work | Keep up the good work | Keep up the good work |
| Visitor engagement | Possible overkill | Possible overkill | Low priority | Keep up the good work | Keep up the good work |
Liu’s Discrimination index allows for an IPA comparison of these five generations. Generation Y has the best performance (0.9987). The result is that generation Y has the best performance and the participants recognize this IPA matrix as being much more valuable, based on the advanced IPA discrimination index proposed in this study. Generation Z has the lowest D-index value (0.4500) when compared with the other generations. The D-index value corresponds to the matrix analysis involving the five generations and a quantitative demonstration is provided as shown in Table 5 which follows.
| Table 5 IPA Comparison of Different Generations |
|
| D-index | |
| Generation Y | 0.9987 |
| Generation X | 0.8945 |
| Mature | 0.8616 |
| Baby boomers | 0.7894 |
| Generation Z | 0.4500 |
Discussion and Conclusion
Theoretical Implication
The contribution and value of this study is to introduce the commitment and engagement concept into the research. This study provides empirical evidence of the effectiveness illustrations of the application to the communication model. This research meets the research objective and illustrates the directions of how an exhibition should be designed and managed in order to create a positive exhibition brand attitude for visitor engagement retention in the form of re-visitation.
IPA is a popular marketing tool that enables companies to understand market competition and identify improvement priorities. Various methods to calculate the importance or performance may lead to different interpretations and a slight difference in the position of an attribute could cause its inferred priority to change dramatically (Liu, 2014). To avoid misinterpretations when using IPA, this study consider the 45-degree diagonal Iso-rating line across the Importance-Axis to support the inter-survey performance. If the points are above the line, they indicate that Importance exceeds Performance. The line can provide extra concepts with two classes or categories for discussion of the IPA model. The purpose of Liu’s D-index formula is to arrive at a value between 0 and 1, where quadrant I>quadrant III>quadrant II>quadrant IV. A point in the same quadrant, which is closer to the Iso-rating line is a better result. In this study, a communication framework of commitment and engagement is proposed, integrating the advantages of the D-index of IPA to elucidate the competitive position of each attribute and providing strategic improvement guidelines for the PEO and PCO to design better exhibition marketing activities. This research demonstrates the effectiveness of the proposed communication model by mapping the latent variable to the IPA grid.
With respect to how to create a positive exhibition commitment emotion to lead to a positive exhibition engagement attitude as well as visitor engagement retention in the exhibition marketing strategies, this research has adopted new research method of IPA mapping for the variables of the communication model for SWOT discussion to enable the PEO & PCO to review the visitor’s priority perceptions when they are formulating a modern age exhibition management and marketing strategy.
Practical Implication
Strengths
From the latent variable mapping in the IPA quadrant assessment, the results show that the Brand commitment emotion, Exhibition commitment emotion and Fit between brand and exhibition commitment fall into quadrant I, which indicates that the visitor considers that these 3 construct variables are satisfied. From the attributes results, visitors consider that the brand of the specific exhibition is a good brand when compared with other similar brands and when there is willingness to pay a higher ticket price for the exhibition brand. Visitors are also interested in participating in the exhibition’s activities and are willing to recommend the exhibition’s activities to others. Performance and Importance are both high and therefore the PEO should “Keep up the good work”, to maintain the quality of future exhibitions.
Weaknesses
The visitor’s perceptions of the exhibition’s activities are successful, which leads to the conclusion that the exhibition brand has a specific advertisement communication effect, which refers to the high importance but low performance of “Concentrate here”. The PEO should focus on these attributes when planning the next exhibition marketing strategy.
Threats
The majority of the attributes of the construct variables of the Brand engagement attitude, Exhibition engagement attitude and Visitor engagement are mapped into quadrant III, which means a “Low priority”. The result demonstrates that visitors consider the following attributes of having a positive perception of the exhibition’s activities, the brand and exhibition activities having a positive communication effect with the brand information which is suitable, the brand having clearly transmitted the image of the exhibition’s activities and the exhibition’s activities having an entertainment effect which results in visitors being interested in participating in the next exhibition. This research concludes that the visitor thought those attributes of both performance and importance to be low. The PEO could thus ignore them, but the low performance of those attributes could be considered to be a threat to the next exhibition management and marketing strategy.
Opportunities
As for the positive brand commitment emotion of Stimulation, it appears that the exhibition brand is both a reliable and a credible brand and visitors are therefore willing to recommend this exhibition to others. This result falls into the high performance but low importance of “Possible overkill”. Therefore, the PEO’s strategy should be modified and the resource should be re-allocated to a more important area and conveyed to the management and marketing of the next exhibition.
The major limitation of this communication model is that the data were collected from just one International Winter Travel Exhibition event. For further research, the author suggests that more studies should be conducted to generalize this commitment and engagement communication model to other similar exhibitions or events for comparison purposes to obtain more pertinent inside information. For future research, this study suggest a further comparison study of existing research method of SEM (Structural Equation Modeling) and Advanced IPA will contribute methodology knowledge to academic. Furthermore, additional variables of brand loyalty could be added to future research. Brand loyalty is defined as “a deeply held commitment to retention” in the marketing literature, a study of exhibition visitor’s potential cause of behaviour switching will also contribute to academic knowledge.
References
- Baker, K., & Draper, J. (2013). Importance-performance analysis of the attributes of a cultural festival. Journal of Convention & Event Tourism, 14(2), 104-123.
- Chakraborti, R., & Roy, S. (2013). Meaning transfer between events and sponsor brands: Integrating the role of emotions-a new conceptual framework. Journal of Brand Strategy, 2(1), 87-105.
- Hair, J.F., Black, W.C., Babin, B.J., & Anderson, R.E. (2010). Multivariate Data Analysis, (Seventh Edition). Prentice Hall, Upper Saddle River, New Jersey: Pearson Education International.
- Huh, C.L. (2018). Communication model of commitment and engagement: Illustrations of exhibition social media marketing. Journal of Convention & Event Tourism, 8(2), 11-15.
- International Winter Travel Exhibition (2016). Retrieved from http://wtitf.tw.tranews.com/
- Kozinets, R.V. (2014) Social Brand Engagement: A New Idea. GfK Marketing Intelligence Review, 6(2), 8-15.
- Leischnig, A., Geigenmueller, A., & Enke, M. (2011). On the role of event marketing in science communication: An empirical examination. American Marketing Association, 22(7), 31-32.
- Liu, H., Jeng, B., Mai, Y., Jheng, Y., & Lin, H. (2014). Design of online survey system with an advanced IPA discrimination index for customer satisfaction assessment. Electronic Commerce Research, 14(2), 223-243.
- Martensen, A., Gronholdt, L., Bendsen, L., & Jensen, M. (2007). Application of a model for the effectiveness of event marketing. Journal of Advertising Research, 47(3), 283-301.
- Severt, K., Fjelstul, J., & Breiter, D. (2013). Information communication technologies: Usages and preferences of generation Y students and meeting professionals. Journal of Convention & Event Tourism, 14(2), 124-143.
- Tafesse, W., & Korneliussen, T. (2010). Importance performance analysis as a trade show performance evaluation and benchmarking tool. Journal of Convention & Event Tourism, 11(4), 314-328.
- UFI (2016). Homepage of Global exhibition Statistic. Retrieved from http://www.ufi.org/
- Wikipedia (2016). Home page of Generation Z. Retrieved from https:// en.wikipedia.org/wiki/Generation_Z