Research Article: 2018 Vol: 22 Issue: 3
An Analysis of Brand Value and Its Determinants Using Quantile Regression
Subrata Kumar Mitra, Indian Institute of Management Raipur
Abstract
The objective of the paper is to analyze the non-linearity in the relationship between the overall brand value and various brand associations using a quantile regression approach, so that, the influences of brand value determinants at different quantiles can be better understood. In addition to fitting a linear quantile model in line with the methodology proposed by Koenker & Bassett (1978), the paper applied two approaches. The first one is the inclusion of a quadratic variable in the quantile model that can capture the changing relationship better than linear line fitting. Similarly, instead of a single straight line, lines with different slopes were fitted. Investigating brand relationships with the quantile approach can be particularly useful in marketing studies
Keywords
Brand Value, Brand Equity, OLS, Quantile Regression.
Introduction
To succeed in today’s competitive landscape; brands must develop and maintain distinctive images (Aaker, 1996; Pappu et al., 2005). Consumer-Based Brand Equity (CBBE) measures are increasingly used to differentiate brands, measuring the performance of brands and developing strategies to gain competitive advantage (Lassar et al., 1995). Favourably perceived associations unique to the brand would be beneficial to the brand over others, and thus favourable impressions are critical for the success of the brand. Therefore, firms need to analyse these building blocks that satisfy their core requirements and the desire of consumers (Keller, 2003). Although brand value can be measured in different ways, CBBE dominates marketing research where the final image of a brand is measured by combining various customer-centric measures. The literature on CBBE mainly focuses on brand equity as a construct, and a large number of studies viewed it as an outcome of various dimensions which are linearly associated (Buil et al., 2013; Liu et al., 2015; Mirzaei et al., 2015; Anselmsson and Bondesson, 2015; Gürhan-Canli et al., 2016). However, combining brand associations in a linear model may not capture the complicated relationship between various customer-based attributes and such models might lead to simplistic interpretations missing complexity in relationships.
This study employed a quintile regression approach for better understanding of the relationship between Brand values with other brand associations. The quantile regression approach was developed by Koenker & Bassett (1978), and the approach has been extensively used in many different applications for the analysis of the conditional quantile functions of a dependent variable. It supplements the mean based least squares regression and gives a better picture of the underlying relationships between the variables which are particularly beneficial when relationships in the different quantiles of response variables are of particular interest. It gives a comprehensive picture, showing how covariates influence different aspects of the conditional distributions of the output variable. The relationships that determine the brand value for high valued brands may be different from lower valued brands, and hence the application of quantile regression can open a new vista on analysing relationships at different levels of brand value.
The remainder of this paper is structured as follows: the second chapter discusses literature related to customer perception-based measure of brand value. The third chapter gives an introduction to the quantile regression approaches and how the method can be made useful in analysing the relationship between the brand image and its influencing factors. The fourth chapter contains discussion on the results and the last chapter presents conclusions.
Methodology
Lovett et al. (2014) prepared a database on brand characteristics that contain a large number of US brands and have other measures of brand characteristics obtained from different sources (available at http://dx.doi.org/10.1287/mksc.2014.0861). This study used the following consumer-based measures of involvement, familiarity, complexity, visibility, perceived risk, excitement and competence to a model relationship with the brand value using the above dataset.
In the study two approaches to delineate relationships are analysed; first, the conventional mean based Ordinary Least Squares (OLS) model is used, which also serve as a benchmark for evaluation purpose, and second, a quantile regression was used to obtain a finer break up of relationships at various quantiles.
Let’s start with the following conventional OLS model

Where yithe response variable and xi is an m×1 vector of explanatory variable and β is a m×1 vector of coefficients associated with xi variables. The last term εi is the error component. Following Koenker and Basset (1978), the above equation can be transformed to a quantile regression model as follows:

The equation 2 is equivalent to equation (1) when  . The coefficient applicable to τ quantiles β(τ) can be estimated by minimizing the following loss function:

Where  when z≥0 and
  when z<0 (Koenker, 2005)
Results and Discussion
First, the collective impact of the explanatory variables on the brand value in a multiple regression setting as per the following OLS is carried out, and results are given in Table 1.
| Table 1 Results of the OLS Model |
|||
| Coefficient | Std. Error | t-value | |
| Intercept | 3.780 | 0.262 | 14.428*** |
| Involvement | -0.238 | 0.046 | -5.225*** |
| Familiarity | 0.383 | 0.032 | 11.838*** |
| Complexity | -0.215 | 0.070 | -3.058*** |
| Visibility | 0.082 | 0.049 | 1.695* |
| Perceived Risk | -0.321 | 0.081 | -3.940*** |
| Excitement | -0.294 | 0.052 | -5.711*** |
| Competence | 0.595 | 0.072 | 8.254*** |
***, ** and * represent significance at 1%, 5% and 10% levels respectively.
Brand value=α+β1 (Involvement)+β2 (Familiarity)+β3 (Complexity)+β4 (Visibility)+β5 (Perceived Risk)+β6 (Excitement)+β7 (Competence)+ε … … … (4)
From the results of the conventional OLS model (Table 1), it can be found that all explanatory variables are significant in the linear model. The effect of familiarity, visibility, and competence are positive, and therefore, the brand value would increase with the increase of the value of these perception measures, but the effect of a higher score of involvement, complexity, perceived risk and excitement would influence brand value in a negative way.
Anticipating the presence of non-linearity in the relationship, a quantile regression approach was used to find the nature of input variables on various quantiles of the response variable. The quantile regression models at five different quantiles, (τ={0.05, 0.25, 0.50, 0.75 and 0.90}) were evaluated and results related to parameter estimates and their 95% confidence range are given in Table 2. A visual depiction of changing coefficients of the influencing variables and their confidence band for five different quantiles are presented in Figure 1.
| Table 2 Results of Quantile Regression Model |
||||||
| τ=0.050 | τ=0.250 | τ=0.500 | τ=0.750 | τ=0.950 | ||
| Intercept | Value | 3.802 | 3.746 | 3.947 | 3.973 | 4.733 |
| Std. Error | 0.467 | 0.342 | 0.291 | 0.290 | 0.267 | |
| t-value | 8.148*** | 10.953*** | 13.579*** | 13.682*** | 17.737*** | |
| Involvement | Value | -0.095 | -0.268 | -0.325 | -0.315 | -0.306 |
| Std. Error | 0.065 | 0.051 | 0.054 | 0.049 | 0.058 | |
| t-value | -1.461 | -5.245*** | -6.003*** | -6.394*** | -5.249*** | |
| Familiarity | Value | 0.294 | 0.372 | 0.410 | 0.409 | 0.512 |
| Std. Error | 0.051 | 0.038 | 0.038 | 0.035 | 0.042 | |
| t-value | 5.749*** | 9.681*** | 10.916*** | 11.577*** | 12.288*** | |
| Complexity | Value | -0.340 | -0.183 | -0.233 | -0.178 | -0.061 |
| Std. Error | 0.094 | 0.089 | 0.086 | 0.072 | 0.126 | |
| t-value | -3.604*** | -2.063** | -2.700*** | -2.483** | -0.487 | |
| Visibility | Value | 0.044 | 0.165 | 0.087 | 0.076 | -0.094 |
| Std. Error | 0.076 | 0.058 | 0.054 | 0.053 | 0.050 | |
| t-value | 0.579 | 2.862*** | 1.601 | 1.443 | -1.893* | |
| Perceived Risk | Value | -0.382 | -0.421 | -0.205 | -0.230 | -0.356 |
| Std. Error | 0.135 | 0.106 | 0.093 | 0.094 | 0.106 | |
| t-value | -2.822*** | -3.977*** | -2.196** | -2.451** | -3.351*** | |
| Excitement | Value | -0.356 | -0.310 | -0.368 | -0.305 | -0.174 |
| Std. Error | 0.083 | 0.061 | 0.057 | 0.059 | 0.048 | |
| t-value | -4.273*** | -5.038*** | -6.452*** | -5.213*** | -3.605*** | |
| Competence | Value | 0.569 | 0.569 | 0.629 | 0.611 | 0.399 |
| Std. Error | 0.124 | 0.090 | 0.081 | 0.084 | 0.061 | |
| t-value | 4.601*** | 6.294*** | 7.719*** | 7.311*** | 6.574*** | |
***, ** and * represent significance at 1%, 5% and 10% levels respectively.
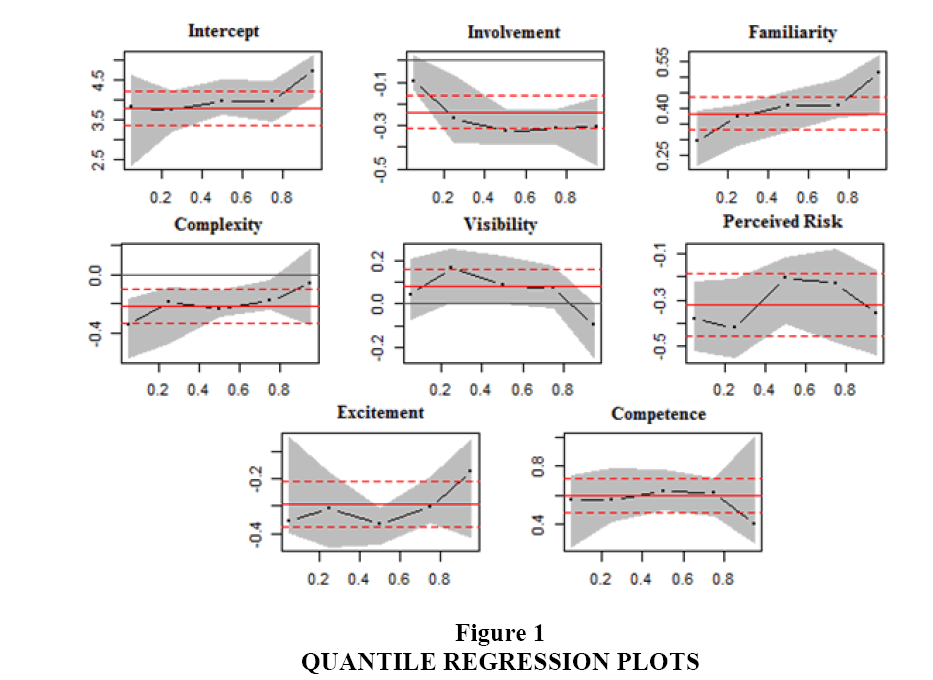
Figure 1: Quantile Regression Plots
The plot shows how the beta value of the coefficients (in y-axis) is changing at different quantiles (x-axis) as par the result of quantile regression. The shaded area represents 95% confidence interval.
The parameter estimates given in Table 2 are the posterior means of the coefficients for various quantiles. Although the OLS estimate of involvement is -0.238, the value differs substantially at different quantiles and varies from -0.325 at 0.50 quantile to -0.095 at 0.05 quantile. Thus, the influence of involvement is profoundly negative at higher quantiles than at lower quantiles. This is an indication that a higher valued brand is more negatively affected when products need more involvement. Quantile regression coefficients attached to familiarity gives different interpretation compared to involvement. Familiarity is high and positive at higher quantiles of brand value, but the value decreases as quantile comes down. Thus, a higher score of familiarity is more desirable for higher brand value products.
Coefficients attached to complexity are negative. Complexity scores are highly negative at lower quantile (τ=0.05) and the score becomes -0.061 at τ=0.95. Thus, the products enjoying high brand value are less affected by the adverse influence of complexity. Visibility coefficients are generally positive except at 95% quantile, where it turns negative. As expected, the influence of perceived risk is negative across quantiles, and the coefficient estimate varies from -0.382 to -0.205. The influence of competence is relatively high compared to other variables used in the study, and it is found to be positive. The effect at the quantile (τ=0.50) is the highest at 0.629. The effect of excitement at the various quantiles are negative across quantiles, but the negative influence decreases at τ=0.50 quantiles.
The perception measures of all explanatory variables used in the study range from the scale of 1 to 7, and therefore, their coefficient values are numerically comparable. Figure 2 depicts the changing value of the coefficients for various quantiles for all explanatory variables in one single plot. Excitement, perceived risk, complexity, and involvement are found to influence the brand value negatively as also found in the OLS. However, the quantile regression helped to analyze how their weight changes across quantiles. For example, the coefficient of excitement at 0.95 quantiles is -0.174 and this value reduce to -0.368 for 0.50 quantile. Thus the negative influence of excitement is high in lower quantiles compared to higher quantiles. As range and scales of the variables presented in the figure are similar, the length of the bars can also be taken as a rough measure of the importance of the variables across various quantiles.
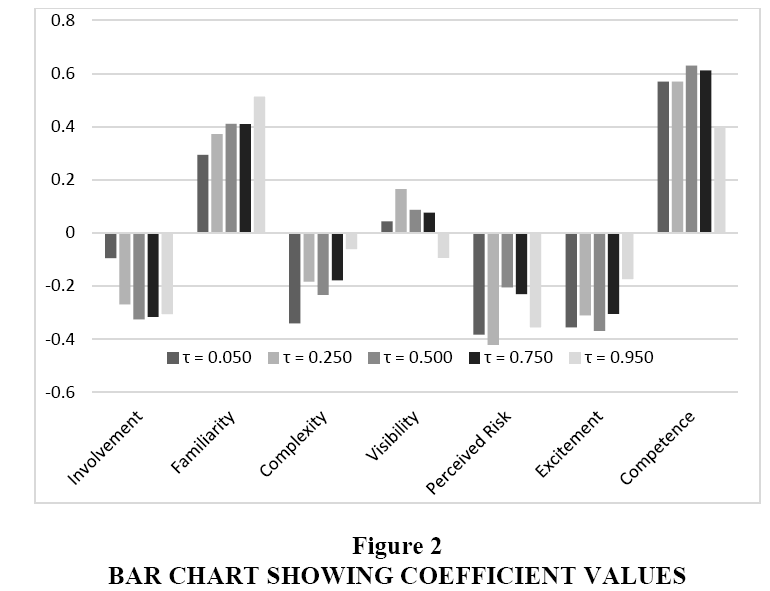
Figure 2: Bar Chart Showing Coefficient Values
The scatterplots show how various perception based variable influence brand value when they are individually regressed. In the Figure, the y-axis represents brand value, and the x-axis is the measure of the influencing variable. The thick straight line is the straight-line fitting using OLS. Second-degree polynomial lines for quantiles (0.05, 0.25. 0.50, 0.75 and 0.95) of brand value are superimposed in the plots to reflect the changing nature of the influence of the variables at different quantiles. Changing influence of the influencing variables at different quantiles (t={0.05, 0.25. 0.50, 0.75 and 0.95}) are shown in a single bar plot.
In the next step, the influences of individual explanatory variables on the brand value were separately examined using scatter plots as given in Figure 3. A straight line using OLS (the bold line in the figure) shows the overall linear trend. The straight line was drawn using a simple OLS regression. For example, the linear association between brand value and involvement was drawn using the equation given below.
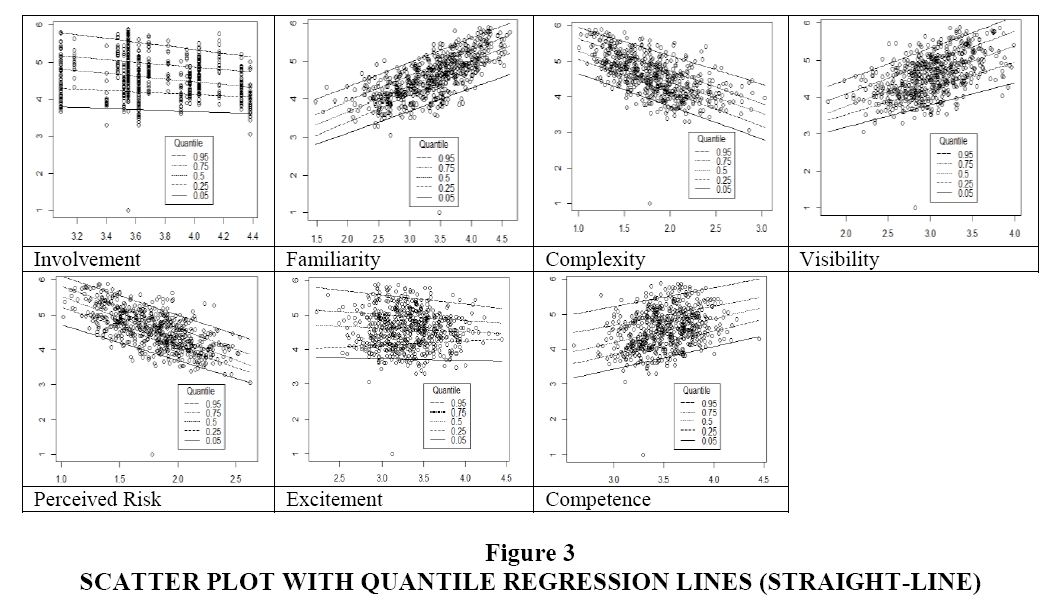
Figure 3: Scatter Plot With Quantile Regression Lines (Straight-Line)
Brand value=α + β (Involvement) + ε (5)
As can be seen from the Figure 3, the OLS straight lines for familiarity, visibility, and competence are upward sloping meaning that brand value has a positive association with these variables and the brand value increases with the increase of these perceptive measures. On the contrary, trend lines for other perceptive factors are downward sloping depicting negative relationships with the brand value. To understand the influences of these perception-based variables at various quantiles of the response variable, polynomial (second degree) trend lines applicable for different quantiles (τ={0.05, 0.25, 0.50, 0.75 and 0.95}) are superimposed on the scatter plot. The lines for different quantiles were drawn using the quantile version of the quadratic equation of respective variables. For example, a quantile regression version of per equation 5 was used for relating brand value with involvement scores. The OLS lines for different quantiles in Figure 3 do not appear to fit the data quite well. Therefore, second-degree polynomial lines were fitted based on quantile regression approach using equation 6 for involvement.
Brand value=α + β1 (Involvement) + β2 (Involvement)2 + ε … … (6)
In the Figure 3, y-axis represents brand value, and x-axis is the measure of the influencing variable. Fitted lines for quantiles ( ={0.05, 0.25. 0.50, 0.75 and 0.95}) are superimposed in the plots.
The first plot in Figure 4 shows the relationship between brand value and involvement. The use of second-degree polynomial in curve fitting has helped in getting better fitment of trend lines. Although the OLS trend line (thick line) is downward sloping, the polynomial curve fitting for quantile regression estimates reveal that the initial portion of the curve is almost straight for most of the quantiles, but the curve slopes downward when involvement score exceed 3.60.
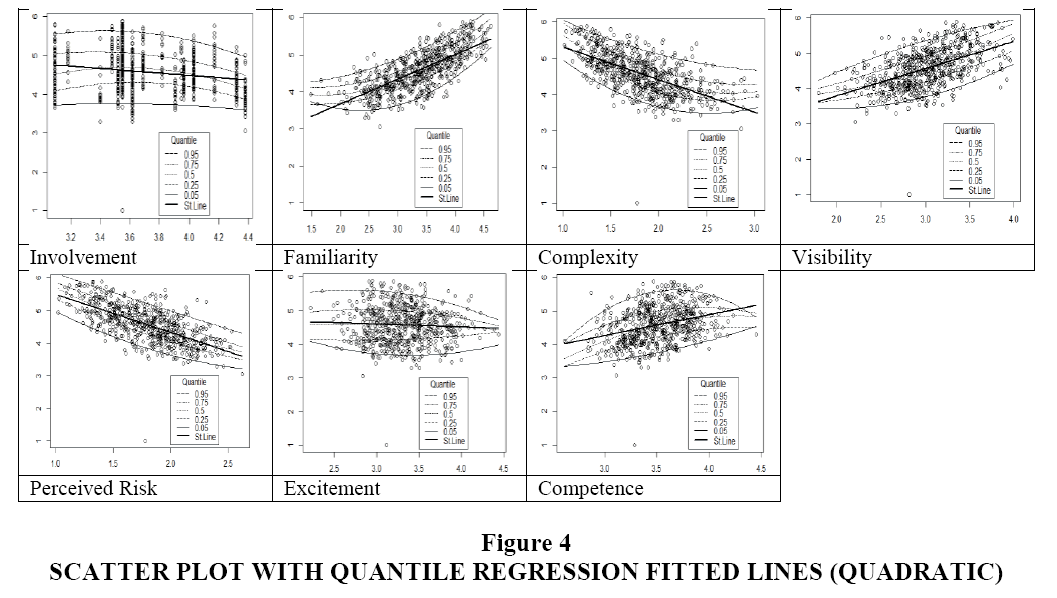
Figure 4: Scatter Plot with Quantile Regression Fitted Lines (Quadratic)
The plots related to visibility, excitement, and competence are quite interesting as the curves for 0.95 quantiles are of inverted U shape, but the curves for 0.05 quantile are just opposite, showing normal U shape. Thus, the behavior of these perceptions on brand value is different at different quantiles. In the case of 0.05 quantile, the brand value increases with an increase of the excitement score beyond 3.20, but the effect is opposite for 0.95 quantiles. The quantile lines for different quantiles for familiarity are U shaped, but the nature of U shape varies in different quantiles. For the lowest quantile (τ=0.05) the curve is downward sloping till the familiarity score of 3.0, and after that, it takes an upward turn. The trend lines in the scatter plot gave the relationship when the brand value is regressed using explanatory variables separately. This analysis on the effect of brand value across various quantiles clearly illustrates that quantile regression offers a better insight compared to the mean based OLS regression. In the Figure 4, y-axis represents brand value and straight lines of Figure 3 are replaced with quadratic fitted lines
Conclusion
Along with OLS, this study also used quantile regression approach to discover the relationship between the overall brand value and its influencing variables of a number of US brands. The results of OLS indicate that all perception-based variables used in the model are significant determinants for the overall brand value. The use of quantile regression has helped to identify the influence of independent variables at different quanties of the response variable. The method can be particularly useful in marketing studies as a promotional strategy to be adopted for different levels of brand value would be different. A premier brand enjoying a high brand value needs to take a different strategy compared to other brands and therefore, the brand managers need to know accurately how various consumer-centric performance measures are influencing their brand value at different quantiles. The quantile regression approach used in the study has a broad appeal and can be applied not only to other brand datasets but also in a wide class of applications in other areas of marketing where relationship for different levels of response variable are needed to be addressed differently.
References
- Aaker, D.A. (1996). Measuring brand equity across products and markets. California Management Review, 38(3), 102-120.
- Anselmsson, J., & Bondesson, N. (2015). Brand value chain in practise; the relationship between mindset and market performance metrics: A study of the Swedish market for FMCG. Journal of Retailing and Consumer Services, 25(3), 58-70.
- Buil, I., De-Chernatony, L., & Martinez, E. (2013). Examining the role of advertising and sales promotions in brand equity creation. Journal of Business Research, 66(1), 115-122.
- Gürhan-Canli, Z., Hayran, C., & Sarial-Abi, G. (2016). Customer-based brand equity in a technologically fast-paced, connected and constrained environment. Academy of Marketing Science, 6(1), 23-32.
- Keller, K.L. (2003). Brand synthesis: The multidimensionality of brand knowledge. Journal of consumer research, 29(4), 595-600.
- Koenker, R. (2005). Quantile regression. Cambridge university press.
- Koenker, R., & Bassett, G. (1978). Regression quintiles. Econometrica: Journal of the Econometric Society, 46(1), 33-50.
- Lassar, W, Mittal, B., & Sharma, A. (1995). Measuring customer-based brand equity. Journal of consumer marketing, 12(4), 11-19.
- Liu, C.R., Liu, H.K., & Lin, W.R. (2015). Constructing customer-based museums brand equity model: the mediating role of brand value. International Journal of Tourism Research, 17(3), 229-238.
- Lovett, M., Peres, R., & Shachar, R. (2014). A data set of brands and their characteristics. Marketing Science, 33(4), 609-617.
- Mirzaei, A., Gray, D., Baumann, C., Johnson, L. W., & Winzar, H. (2015). A behavioural long-term based measure to monitor the health of a brand. Journal of Brand Management, 22(4), 299-322.
- Pappu, R., Quester, P.G., & Cooksey, R.W. (2005). Consumer-based brand equity: Improving the measurement empirical evidence. Journal of Product & Brand Management, 14(3), 143-154.