Research Article: 2020 Vol: 24 Issue: 1
An Empirical Study on Assessing Brand Loyalty in Automobile Industry using Hidden Markov Model
Serkan Varol, Southeast Missouri State University
Alberto Marquez, Lamar University
Abstract
The topic of brand loyalty in automobile industry is a multidimensional construct that is formed through cognitive and affective assessments, which has often been associated with outcomes rather than causes. Discovering underlying reasons behind purchase decisions can be critical in predicting brand loyalty and revisit intentions. Because each market shows individual characteristics, it is difficult to draw a generalized conclusion on consumer behavior. Hence, in this research, a survey is conducted, and validated among 244 participants in a target market to better observe the attitude of the car shoppers that are homogeneous with regard to attributes such as household income level and marital status. The properties of Hidden Markov Model (HMM) are used to predict the consumers’ next purchase intentions associated with a most probable cause. The methodology of the conducted approach is presented to help automobile companies to achieve an alternative practice in terms of observing measuring overall market and consumer behavior
Keywords
Brand Loyalty, Choice Criteria, Consumer Behavior, Hidden Markov Model, Predictive Analytics.
Introduction
With rising acquisition cost, customer retention has become one of the priorities in the minds of businesses across the world. Retaining customers is a shortcut to grow quickly and increase profits while reducing redundant expenses (Dahlgren, 2011). Former Ford vice president, Basil Coughian, emphasizes the importance of brand loyalty by stating that every percentage of loyalty is worth $100 million in profits to Ford Motor Company (Stewart, 1998). Likewise, Lee & Ramayah (2018) mentions that business performance is strongly correlated to customer loyalty through purchase behavior.
The topic of brand loyalty had started to become one of the important aspects of emerging organizations in late 1940s and recognized as a controversial phenomenon with numerous definitions and methods of measurements. Initially, it was introduced as a brand preference (Guest, 1955). Later, it was adopted and implemented as a multi-dimensional construct which is comprised of attitudinal and behavioral measures that carry different characteristics. A bibliometric analysis of 337 publications on customer loyalty and brand management was conducted from 2000 to 2018, where it was proved that the literature still lacks in providing a comprehensive study that measures the combined effect of both attitudinal and behavioral loyalty (Tartaglione et al., 2019). In addition to multidimensional and multidirectional approaches, several researchers have treated brand loyalty theoretically as a set of certain purchase sequences (Kahn et al., 1986). The percent of purchase method (Tucker, 1964) and brand choice sequence models introduced by Brown (1952) were limited to produce reliable results because they failed to consider the behaviors behind brand selections. In literature, the traditional approaches of brand loyalty in automobile industry have often been associated with outcomes. However, recent research attempts in measuring automobile brand loyalty attributes have been evolving from evaluating the final outcome to discovering and deciphering underlying reasons behind purchasing decisions. In other words, the question of “what” has been becoming “how” to divulge customers’ desires behind making selections.
Overall, the lack of understanding brand loyalty theories and their implementations entail automobile companies to invent their own methodologies that rely on internal sources to analyze brand equity as well as revealing brand awarness. As an example, BEAT (Brand Equity and Awarness) is Ford’s global approach that measures consumer intended behaviour in the purchase of a new vehicle (Keller, 1993). The ultimate purpose is to identify customers and their needs, also understand consumer’s perception of the brand when the customer is in the market for a new vehicle, to foresee what is needed to improve consumer’s opinions about the featured products. Another similar study was conducted by Fiat Chrysler Automobiles, previously known as Daimler Chrysler. Their research center put effort in seeking how people’s brains respond to specific images or features of automobiles. In their study, sixty-six pictures of different vehicles were shown to the experiment participants, including twenty-two sport cars, twenty-two medium size sedans and twenty-two compact size vehicles. fMRI scanner discovered that sport car models excited ventromedial prefrontal cortex, also known as reward center, where the captured information enters into ventral tegmental area (VTA) and travels through nucleus accumbens (NA) to intrigue prefrontal cortex that reveals desires (Polister, 2008).
Despite technological advancements, the occurrence of transaction also depends on social status, sex, household income (Puska et al., 2018), age and other environmental factors, such as drugs and alcohol may play significant roles on how prefrontal cortex or insula is stimulated (Belden, 2012). Because behaviours can rapidly change depending on status qou, it is hard to produce a generalizable output of a traditional brand loyalty model.
Therefore, targeting narrower groups of population may generate more accurate predictions of customer intentions. As an example, assessing brand loyalty in a local market is expected to provide a more precise finding on how certain consumers behave, while it helps to eliminate or reduce some initials concerns such as environmental and social impact factors due to existing homogeneity of the population (in a local market) in terms of economic characteristics, demographics, social characteristics, cultural characteristics and labor force. Likewise, Jensen & Hansen (2006) also inscribed in one of their journals that measuring brand loyalty should be different for specific market segments.
Accordingly, the proposed study will target a specific region where homogeneity is considered and imposed. It will respond to the question of “If a customer is buying a brand of “B” because of a “R” factor, what is the probability that the customer chooses the same or a different brand in next purchase(s) and what would be the underlying reason behind a specific brand selection?”.
The study further filters cases based on the following conditions to reduce variations.
1. Because of the differences in household incomes, consumers may display various purchasing patterns. For example, according to Bashar et al. (2015), individuals with good income levels are more likely to show impulsive buying behaviors. To avoid such generalization, only certain participants are considered whose annual household (HH) incomes are between within (+/-) 25% of the median household income of 2019. Although U.S government has no definition of middle-class income, the targeted population mentioned in this research is expected to be comprised of the middle-class people.
2. Demographic status effects on purchasing decision making. For example, there is a relation between marital status and kind of products that consumers intend to buy (Srinivasan et al., 2015). This research is targeting individuals who is married and have at least a child between the age of 4 and 17 who live in the same household.
3. Because of variances between used and new cars in terms of features, technological differences, design and other important aspects, used vehicles purchases are excluded from this study to avoid biased and obvious selection of brands.
Methodology
To assess brand loyalty for automotive purchases, a survey was conducted in the vicinity (20 miles radius) of Saint Louis, MO area, and 398 participants responded to an instrument that contained 16 items that contained brand choice and demographics type of questions. Each response was examined with respect to two distinct aspects: (1) correctness of the responses, (2) evidence of a residency by IP addresses. Accordingly, 154 instances were removed from the study due to their unfit conditions (e.g. higher or lower income level) or suspected inaccurate data entry (e.g. if a participant’s age is recorded unusual high, the data is removed from the study). Hence, only 244 responses were validated and used for analysis. Useful statistics obtained from the survey are recorded in Table 1.
| Table 1: Descriptive Statistics | ||||
| City/State Saint Louis, MO |
HH Median Income | Middle Class (+/25%) | Number of Participants |
Average Age |
|---|---|---|---|---|
| Summary: | $61,571 | $46,179-$76,963 | 244 Male: 61% Female: 39% |
37.6 Max:59 Min:24 |
17 automotive brands are chosen (with an option of “others”) based on their market shares in the United States. After all surveys are completed, 5 brands are recategorized into “Other(s)” because of lack of selection. For privacy reasons, automotive company names are anonymized, and we will simply refer to them as following throughout this paper:
| Table 2: Brand Selection | |||||
| Brands | Country of Manufacturing | BM | Brands | Country of Manufacturing | BM |
|---|---|---|---|---|---|
| Brand-1 | Japan | B1 | Brand-7 | America | B7 |
| Brand-2 | Japan | B2 | Brand-8 Other(s) | Multi-Countries | B8 |
| Brand-3 | Japan | B3 | Brand 9 | Japan | B9 |
| Brand-4 | America | B4 | Brand 10 | Korea | B10 |
| Brand-5 | Japan | B5 | Brand 11 | America | B11 |
| Brand-6 | Korea | B6 | Brand 12 | Germany | B12 |
Model Parameters
Model parameters are determined based on “choice criteria” factors introduced by John O'Shaughnessy (2014). According to John (2014), the patterns of choosing a product is often associated with buying behavior that is impacted and characterized by how individuals perceive that behavior. John O'Shaughnessy (2014) states that when a purchase is made, an instinctive or explicit feeling, named as “choice criteria” is expressed toward a specific brand. It addresses to the question of “why would you choose one product over another one”? John O’Shaughnessy (2014) defines six reasons (On the survey, brief descriptions of each criteria with examples are provided to participants to ease the survey completion) that constitute choice criteria; technical, legalistic, integrative, economic, adaptive and intrinsic.
1. Technical criteria (R1) represent the core performance of product in terms of durability, quality, reliability and usability (O'Shaughnessy, 2014). Initially, the purchased product must satisfy the core-use function which is the primary function for the designed product. The second function is ancillary attribute which is directly associated with core-use function.
2. In Legalistic criteria (R2), buying action is determined by other authorities; it can be inferred that the subject is not involved in decision making process. As an example, if a car is being purchased for a teenager, and it is paid by parents or relatives, decision making process is prosecuted by an outside factor.
3. John O'Shaughnessy (R3) (2014) defines Integrative criteria as “refer to the rules consumers employ to choose brands that will better integrate them into their personality, sense of integrity, projected status and self-image”. Integrative criteria involve status, identity, personal integrity and prestige.
4. Economic criteria (R4) is considered to be one of the key factors that influence consumers’ buying behaviors. Thus, rank of choices based on economic factors and the decision is made based on the perception of cost-benefit trade off. In economic criteria, there are two types of customers; deal sensitive customers choose the least expensive brand among their favorite choices. The second type of customer under economic criteria is the one that buys the cheapest available product regardless of other alternatives. Both customer types are price sensitive, thus they look for the low-price tags and rare deals.
5. Adaptive criteria (R5) is about the desire of a customer to minimize risk and uncertainty related to the purchase. Risk can be financial, social or performance related. Uncertainty occurs because of too much or too little information about the product or service. The lack of knowledge also increases the switching cost which is the cost that a consumer pays as a result of changing suppliers or brands. Thence, many consumers may stay with the same brand that they previously experienced, or they simply refuse to switch to deny anxiety and risk associated stress.
6. Intrinsic criteria (R6) is referred to features and characteristics of the product. Curiosity is also another important function of intrinsic criteria. With rapid development of technology and new innovation, consumers are excited by the unique features that automotive manufacturers offer. Many consumers make their purchases on the basis of intrinsic criteria.
Markov Model
An evaluation of popular statistical tools is studied in this research. A popular driver of Machine Learning (ML) methodology, Markov Chain Model, is one strong method that is intensively used in marketing research areas. Forecasting with Markov chains requires two fundamental stages; estimating the transition matrix for the purchased goods (brand) and solving for the equilibrium shares for purchased brands (Armstrong & Farley, 1969). It also specializes in brand switching dynamics and brand selection of customer preferences which are important factors in forecasting and predicting the market share of products majorly in oligopolistic environments (Uslu & Cam, 2000). Initial findings in literature show that the Markov Chain method in brand loyalty models engages with repeat buying and brand switching dynamics primarily for frequently purchased consumer goods. However, Markovian literature represents diverse perspectives that fail to promote integrity because of the memoryless property (Ehrenberg, 1965). As a result, Markovian analysis may be a more appropriate approach for the goods that have longer purchase periods and low purchase rates, such as purchasing a vehicle or house.
In parallel to findings of initial research on Markovian analysis, the Hidden Markov Model (HMM) is also analyzed as a multi-dimensional theory for modeling and forecasting sequences with an underlying pattern generating observable sequences (Blunsom, 2004). HMM is recognized as a component of Markov chain model, and has been frequently used in important areas such as speech recognition (Choo et al., 2004), signal processing (Ford & Moore, 1998), gene prediction (Stanke & Waack, 2003), single molecule kinetic analysis (Meent et al., 2013), and DNA motif discovery (Huggins et al., 2011). Lately, HMM has been used in marketing and management practices as a new approach of predicting consumer behaviors and understanding market needs. As an example, Yang et al. (2019) succesfully applied HMM on identification of customer loyalty which promised to offer companies to build retention strategies.
HMM is a double embedded stochastic process that represents probability distributions over sequences of observations. Ideally, it is a useful tool for defining and addressing forecasting in stochastic process so as to better execution of brand choice and loyalty theories in literature. HMM requires historical evidence and events to be used for the purpose of forecasting. It is a memoryless process that is used to forecast an event of interest by modeling the probability when a customer switches from one brand to another one over a certain period of time (Chan, 2014). Therefore, HMM can be recognized as an ideal model to approach to brand loyalty problems, especially in automobile sector in which the purchase periods are longer and purchase rate is relatively low (Pratt, 2013). The memoryless operation of HMM also complies with Neuroeconomic’s “experienced value theory” where human beings are taking the most recent previous purchase experience as a reference point to make a purchasing decisions. Hence, the next section briefly defines terms and divulging the HMM calculations that take place in brand loyalty measurement method in this research.
The Hidden Markov Model (HMM) in Forecasting Brand Loyalty
There are two types of states in HMM: observable and hidden. Observable states, in which the state is determined from data repository (collected data), characterize HMM and have an underlying probabilistic dependence. Hidden variables (latent variables) manage the mixture component to be selected for observation sets. There are finite set of external observations and internal states in HMM which also infers that the observation at a given time t was generated by a state of St. In HMM, the current state at t is only associated with the previous state at t-1.

Figure 1:Hmm Layout Sample.
The HMM model is represented by λ and contains transition matrix and observation distributions.

R (Underlying Reason-Choice Criteria) is the state alphabet set in which N represent the number of finite hidden states.

B(Brands) is the state observation distributions and M is the number of output (visible)

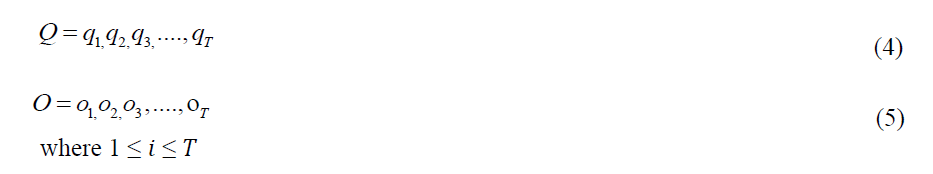
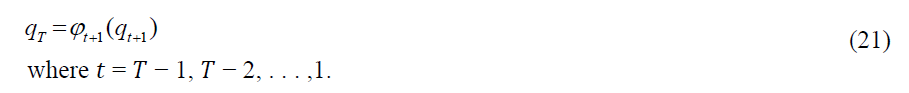
Q is defined as a fixed state sequence of length T in where qt is the sequence of states
traversed, and corresponding observations of each 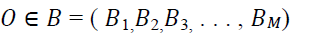
In the HMM model, A represents the state transition matrix, shown as A = [aij] that covers the probability of state J following state i in where the state transition probabilities are independent of time. It is represented by a N×N matrix.

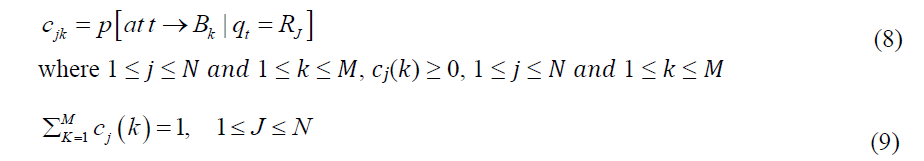
C Implies per state observation distributions, shown as C=[(K)] that stores observation K is produced by the state J. The observation probabilities are independent of time t and it is represented by a N×M matrix.
π is the initial state distribution and gives the probability of λ model is at Riand shown as:

The HMM approach is a doubly embedded stochastic process also recognized as discrete
HMM in which transitions between states are explored with probabilities that gives the
probability of a change between states. The starting probabilities of π and calculated probabilities
in the model of 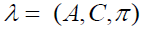 are discrete. States may carry a set of emissions, Σ, and discrete or
continuous probabilities, λ for these emissions which are observable, and BT(output sequence) is
generated by the markov λ (model), known as evaluation problem in HMM, or the most likely
underlying hidden state sequence, which led to a particular observation as called a decoding
problem. Overall, this paper will discuss the two of the three central issues (analysis) of HMM
namely, the evaluation, the decoding problems.
are discrete. States may carry a set of emissions, Σ, and discrete or
continuous probabilities, λ for these emissions which are observable, and BT(output sequence) is
generated by the markov λ (model), known as evaluation problem in HMM, or the most likely
underlying hidden state sequence, which led to a particular observation as called a decoding
problem. Overall, this paper will discuss the two of the three central issues (analysis) of HMM
namely, the evaluation, the decoding problems.
Obtaining Transition and Emission Matrices
In a given set of states 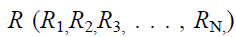 and
and 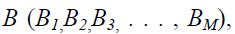 the visible and
hidden series, transition
the visible and
hidden series, transition  and emission
  matrices can be obtained. The value of
  gives
the probability of transitioning from state i to state j, at time
gives
the probability of transitioning from state i to state j, at time 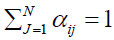 and
represented by a N x N matrix (as shown in Table 3), which gives the probability of switching
from i (e.g. R1) at t-1 (Underlying pattern at previous purchase) to j (e.g. R2) at t (Underlying
pattern at most current purchase).
and
represented by a N x N matrix (as shown in Table 3), which gives the probability of switching
from i (e.g. R1) at t-1 (Underlying pattern at previous purchase) to j (e.g. R2) at t (Underlying
pattern at most current purchase).
| Table 3: Transition Matrix | ||||||
| (aij) | R1 | R2 | R3 | R4 | R5 | R6 |
|---|---|---|---|---|---|---|
| R1 | 0.286 | 0.016 | 0.222 | 0.190 | 0.143 | 0.143 |
| R2 | 0.429 | 0 | 0.143 | 0.143 | 0 | 0.286 |
| R3 | 0.170 | 0.021 | 0.234 | 0.213 | 0.106 | 0.255 |
| R4 | 0.366 | 0 | 0.171 | 0.195 | 0.195 | 0.073 |
| R5 | 0.186 | 0.023 | 0.140 | 0.116 | 0.349 | 0.186 |
| R6 | 0.163 | 0.047 | 0.186 | 0.209 | 0.163 | 0.233 |
The emission or absorbing matrix, , is the probability of transitioning from state j to
state K and represented by a N x M matrix as shown in Table 4. N shows number of hidden states
(R) while M is the number of visible states in the model (B). It gives the interaction between
hidden and visible states. Shortly, emission matrix holds the probabilities of choosing a brand
given the underlying reason.
| Table 4: Emission Matrix | ||||||||||||
| (cjk ) | B1 | B2 | B3 | B4 | B5 | B6 | B7 | B8 | B9 | B10 | B11 | B12 |
|---|---|---|---|---|---|---|---|---|---|---|---|---|
| R1 | 0.250 | 0.172 | 0.047 | 0.141 | 0 | 0.047 | 0.047 | 0.016 | 0.109 | 0.031 | 0.063 | 0.078 |
| R2 | 0 | 0 | 0 | 0.444 | 0.444 | 0 | 0 | 0 | 0 | 0.111 | 0 | 0 |
| R3 | 0.054 | 0.081 | 0.054 | 0.027 | 0.081 | 0.027 | 0.216 | 0.108 | 0.162 | 0 | 0.054 | 0.135 |
| R4 | 0.143 | 0.057 | 0 | 0.086 | 0 | 0.229 | 0 | 0.057 | 0 | 0.257 | 0.143 | 0.029 |
| R5 | 0.151 | 0.113 | 0.094 | 0 | 0.094 | 0.019 | 0.057 | 0.075 | 0.057 | 0.094 | 0.113 | 0.132 |
| R6 | 0.087 | 0.109 | 0.130 | 0.152 | 0.065 | 0.043 | 0.087 | 0.022 | 0.174 | 0 | 0.109 | 0.022 |
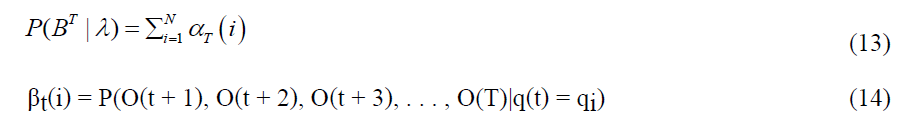
Evaluation Problem
Evaluation problem measures the probability of model λ that generated output sequence of BT. It evaluates the performance of the model that predicts observation sequences (Blunsom, 2004). The Forward algorithm is an efficient solver for evaluation problem that calculates the probability of a state at a certain time. This whole process must be distinguished from HMM’s Viterbi’s algorithm which is covered in decoding issue (Blunsom, 2014).
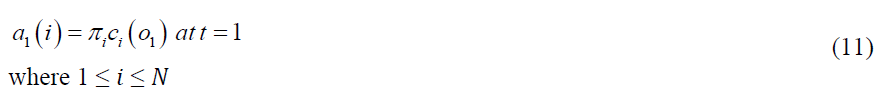
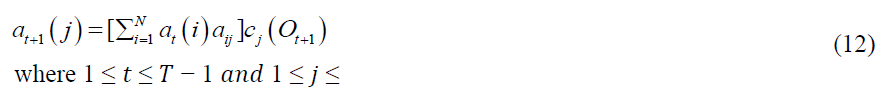
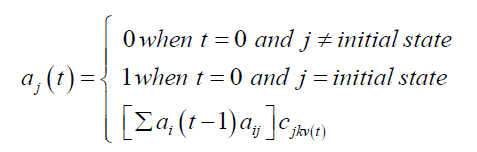
1. The forward algorithm has three fundamental steps which begins with initialization:  gives the probability that the Hidden Markov Model will be in state R at t=1 after
generating i (symbol) states.
gives the probability that the Hidden Markov Model will be in state R at t=1 after
generating i (symbol) states.
2. The second step of the forward algorithm is induction.(t) calculates the probability of arriving in a state of Rj by keeping the observation sequence up until time t= T in where T a fixed state sequence of length.
3. The last step of forward algorithm is termination which provides the probability of
 , from forward and backward variables of
Decoding Problem.
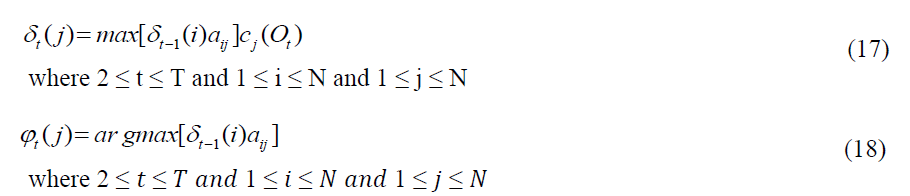
The second issue of the HMM is the decoding problem which was originally used for
convolutional codes on digital communication aspects, but it is widely used and recognized in
marketing area lately. The purpose of decoding problem is to find the best state observation
sequence. The most adequate approach to this problem is Viterbi algorithm that gives the most
likely path through a measured model given an observed sequence and defined as  . The path
with the highest probability is selected to infer the optimal output. Viterbi algorithm is
recognized as a component of unsupervised learning task in machine learning (ML) in where a
function is produced to describe hidden patterns from unlabeled data. The whole process can be
evaluated within three important steps; initialization, induction, termination and backtracking
method:
. The path
with the highest probability is selected to infer the optimal output. Viterbi algorithm is
recognized as a component of unsupervised learning task in machine learning (ML) in where a
function is produced to describe hidden patterns from unlabeled data. The whole process can be
evaluated within three important steps; initialization, induction, termination and backtracking
method:
1. In the initialization step, is calculated by taking the product of initial state and the
probability of observed observation as formulated below. The maximum argument
(probabilities), variable
is calculated by taking the product of initial state and the
probability of observed observation as formulated below. The maximum argument
(probabilities), variable  takes zero.


2. In the induction step, the value of is multiplied by the values in the transition matrix
of
is multiplied by the values in the transition matrix
of  (known as hidden variable matrix). Then, the state that takes the highest probability
is chosen, and again multiplied by the probability of observed observations of
(known as hidden variable matrix). Then, the state that takes the highest probability
is chosen, and again multiplied by the probability of observed observations of  . The
maximum value is selected and assigned to
. The
maximum value is selected and assigned to 
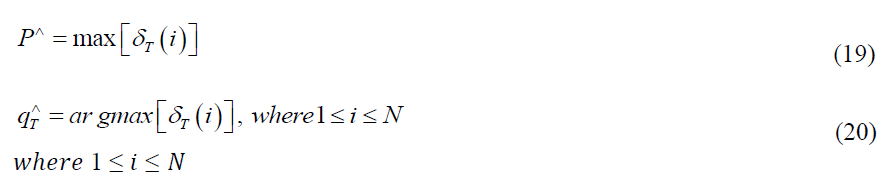
3. The termination step provides the optimum value of last conducted observation. The
maximum value is chosen from  which indicates the last observation is assigned to
 . Meanwhile,
  determines the state of the chosen maximum
  value which
reveals the optimum observation for the model..
value which
reveals the optimum observation for the model..
4. The backtracking method finds the best state sequence from backwards. It finds the state of where optimum solutions come from. The iteration continues until T��=1 which refers to initial state.
We estimate the model with the initial state fixed at  , given
  .
For each model, all consumers are assumed to start from the initial state at t= 0.
.
For each model, all consumers are assumed to start from the initial state at t= 0.
The most probable sequence of hidden states (underlying reasons behind brand selection)
is found through the transition process when generating the sequence of the  , which is defined
as decoding problem whereas the forward algorithm, an efficient solver for evaluation problem,
calculates the probability of a state (brand selection) at time t��, as shown in Table 5.
, which is defined
as decoding problem whereas the forward algorithm, an efficient solver for evaluation problem,
calculates the probability of a state (brand selection) at time t��, as shown in Table 5.
| Table 5: Hmm Outputs | ||||||||||||
| R1 | R2 | R3 | R4 | R5 | R6 | |||||||
| BM | RN | RN | RN | RN | RN | RN | ||||||
| B1 | 14.46% | R1 | 16.01% | R1 | 12.39% | R1 | 16.44% | R1 | 13.85% | R1 | 12.54% | R1 |
| B2 | 10.97% | R1 | 12.45% | R1 | 10.02% | R1 | 11.79% | R1 | 10.96% | R1 | 9.87% | R1 |
| B3 | 5.75% | R6 | 6.51% | R6 | 6.40% | R6 | 5.43% | R5 | 7.34% | R6 | 6.34% | R6 |
| B4 | 9.13% | R1 | 11.99% | R1 | 9.68% | R6 | 8.39% | R1 | 7.81% | R6 | 10.19% | R6 |
| B5 | 4.80% | R3 | 3.02% | R6 | 5.51% | R3 | 3.70% | R5 | 6.63% | R2 | 6.63% | R2 |
| B6 | 7.18% | R4 | 6.90% | R4 | 7.60% | R4 | 7.32% | R4 | 5.69% | R4 | 7.37% | R4 |
| B7 | 8.19% | R3 | 7.58% | R3 | 8.68% | R3 | 7.15% | R3 | 7.48% | R3 | 7.73% | R3 |
| B8 | 5.33% | R3 | 3.65% | R3 | 5.37% | R3 | 5.16% | R3 | 5.41% | R3 | 5.24% | R3 |
| B9 | 10.02% | R3 | 11.97% | R6 | 10.70% | R6 | 9.15% | R1 | 9.51% | R6 | 9.76% | R6 |
| B10 | 7.31% | R4 | 5.01% | R4 | 7.24% | R4 | 8.01% | R4 | 7.12% | R4 | 7.94% | R4 |
| B11 | 8.88% | R3 | 8.60% | R6 | 9.35% | R4 | 9.00% | R4 | 9.52% | R4 | 9.38% | R4 |
| B12 | 7.98% | R3 | 6.31% | R1 | 7.06% | R3 | 8.46% | R1 | 8.68% | R3 | 7.04% | R3 |
Discussions
The findings of the study can be generalized to the population from which sample for the study was drown. However, the results may not be extrapolating outside of the targeted geographic area because of inhomogeneous characteristics of consumers at different locations. In other words, the automotive sector in the selected region (St. Louis, MO) is formed by the demand of the local market needs. Thus, each brand is evaluated in the context of geographic features and the given constraints.
Initially, both transition and emission probabilities were calculated from the training set which is the historical consumer data collected for the study. The transition matrix Table 3 implies that most consumers make their vehicle selections on the basis of technical criteria (R1) which refers to core and primary performance of the product. This finding complies with a research that was conducted by Khan (2012), which stated that people with middle income level think rationally and look for the best buy that minimize the risk associated with purchase activities. Another interesting discovery of the study was that 42.9% of the consumers who were in the status quo of Legalistic Criteria (R2) switched to Technical criteria (R1) on their next purchase activity. Similarly, 36.6% of the consumers who purchased vehicles because of economic criteria (R4) made their next vehicle selection on the basis of technical criteria (R1). This can be explained that deal sensitivity may not a sole determinant of vehicle purchase behavior after weighing the pros and cons economic criteria factors. In other words, the transition may occur due to disconnection between experiences and anticipations, where anticipations for the purchase exceeds the lived experiences (Tversky & Kahneman, 1986).
Emission matrix provided the best possible state that HMM is in based on an observation. According to Table 4, purchase activities of B1 and B2 brands, two Japanese manufacturers, were mostly associated with technical criteria (R1), respectively with 25% and 17.2%. This simply means that consumers see B1 and B2 brands historically as transportation providers that satisfy the core-use function, which is often ascribed to reliability and durability measures in industry.
Meanwhile, integrative criteria (R3) which refers to personal integrity and prestige were related to B7, B8 and B12brands. Also, economic criteria (R4) constituted the basis of purchasing Korean and American made vehicles, respectively  Another interesting initial finding of the study was that Adaptive criteria (R5) was not chosen to be the main factor behind purchasing any brands.
Based on the training data that reside in both transition and emission matrices, an HMM output Table 5 is produced to predict consumer purchasing behaviors and give an insight on automotive market trends for the targeted population. This section will answer the research question of
“If a customer is buying a brand of “B” because of a “R” factor, what is the probability that the customer chooses the same or a different brand in next purchase(s) and what would be the underlying reason behind specific brand selection?”.
The following observations are made based on Table 5 data:
1. B1 is predicted to have the highest purchasing probability from any initial states (R1 − R6) at t to an accepting state at t+1. As an example, when economic criteria (R4) matters the most to the customer as a status quo, the probability that the customer chooses B1 in his or her next purchase is 16.44% with an underlying reason of technical criteria (R1).
2. B2 stands as a second choice for consumers, except when the consumer is at the initial state of integrative criteria (R3). When a transition occurs from integrative criteria (R3), B2 would be the 3rd choice of next vehicle selection with a probability of 10.02% after B1 and B9, with an underlying reason of technical criteria (R1).
3. After two giant rivals, B9 surprisingly leads the market by a small margin. As an example, when a consumer is in the status quo of integrative state (R3), the probability that B9 is preferred on the next purchase is 10.70%, with an underlying reason of intrinsic criteria (R6), which refers to features and characteristics of the product.
4.B4 is the first domestic brand that is predicted to be preferred by consumers after giant Japanese automakers. Consumers are expected to choose B4 on the basis of technical criteria (R1) and intrinsic criteria (R6). As an example B4ranks as the 2nd predicted brand after B1 with a probability of 10.19% when a transition occurs from intrinsic criteria R6).
5. Both B6 and B10 are predicted to be close rivals of Japanese automakers along with American made B4. They are mostly preferred because of economic crteria (R4), in which the price tag may be more affordable than most of its competitors that makes both B6 and B10 good options for consumers who are deal sensitive and appreciates low price tags.
6. Based on the predictions of this study, B7 is preferred because consumers think that the brand integrates well into their personality, projected status and self-image. Despite B7 specializes in manufacturing versatile vehicles that are perfect for families, it attracts individual shoppers by its well characterized vehicle line which adds integrity to the self.
Overall, Japanese auto manufacturers are expected to attract consumers mostly on the basis of technical criteria (R1), while economic criteria (R4) is predicted to be the underlying reason behind purchasing Korean vehicles. Consumers are also expected to choose German automakers and premium American brands because of integrative criteria (R3) due to personal integrity and prestige. One should remember that human beings make more than 60% of their decisions under some conditions of risk (Polister, 2008). According to the theory of utility maximization introduced by Bernoulli (1954), humans are rational, and consumers evaluate their purchasing options based on the expected utility that considers risk attitude. Therefore, the responses received from the participants are subject to status quo persistence.
Conclusion
This research aims to leverage statistical tools to measure brand loyalty attributes from unique perspectives, where choice criteria is used to divulge and predict consumers purchasing intentions in automotive sector by a statistical tool called Hidden Markov Model. Because of its complex heterogeneous dimension, the research is narrowed down to a specific population where homogeneity is considered.
The leading findings indicate that the targeted middle classed consumers who live in the Saint Louis metropolitan area are not basing a vehicle purchasing decision solely on the economic criteria. Technical criteria that refers to the core performance of product such as durability and reliability form the basis of the vehicle selection in the region, followed by the intrinsic criteria. Adaptive criteria is one of the least reasons why people purchase vehicles, thanks to the internet era that has increased consumers awareness.
As consumer choices are important in achieving sustainability gains, companies focus on innovative ways to differentiate themselves even further through different dimensions. In this research, target marketing technique is used to cater the needs of the St. Louis, MO area and its surroundings. It sheds light into discovering the path of brand selections based on purchasing behaviors. Overall, to extrapolate the findings of this research to another region or area, companies need to conduct detailed investigation and collect evidence on the characteristics of the geographic locations, lifestyles, economics and social statuses.
References
- Armstrong, S.J., & Farley, J.U. (1969). A Note on the Use of Markov Chains in Forecasting Store Choice. Management Science, 16(4), 281-285.
- Bashar, A., Ahmad, I., & Wasi, M. (2013). A Study of Influence of Demographic Factors on Consumer Impulse Buying Behaviour. International Journal of Management and Strategy, 4, 64-76.
- Bernoulli, D. (1954). Exposition of a New Theory on the Measurement Risk. Econometrica, 22(1), 23-26.
- Blunsom, P. (2004). Hidden Markov Models. The University of Melbourne.
- Brown, G.H. (1952). Brand Loyalty: Fact or Fiction . Advertising Age 23, 43, 251-258.
- Chan, K.C. (2014). Markov and Non-Markov Models for Brand Switching and Market Share Forecasting. The 9th International Conference on. Sydney: ICITA.
- Choo, K.H., Tong, J.C., & Zhang, L. (2004). Recent Applications of Hidden Markov Models in Computational Biology. International Journal of Genomics and Proteomics, 2(2), 84-96.
- Dahlgren, S. (2011). Brand Loyalty and involvement in different customer levels of a service concept brand. Master's Thesis, Alto University.
- Ehrenberg, A.S. (1965). An Appraisal of Markov Brand-Switching Models. Journal of Marketing Research, 2(4), 347-362.
- Ford, J.J., & Moore, J.B. (1998). Adaptive Estimation of HMM Transition Probabilities. IEEE Transactions on Signal Processing, 46, 1374-1385.
- Guest, L. (1955). Brand loyalty twelve years later. Journal of Applied Psychology, 39(6), 405- 408.
- Huggins, P., Zhong, S., Shiff, I., Backerman, R., Laptenko, O., Prives, C., . . . Bar-Joseph, Z. (2011). DECOD: fast and accurate discriminative DNA motif finding. Bioinformatics, 27(17), 2361-2367.
- Jensen, J.M., & Hansen, T. (2006). An Emprical Examination of Brand Loyalty. Journal of Product and Brand Management, 15(7), 442-449.
- Kahn, B.E., Manohar, K.U., & Morrison, D.G. (1986). Measuring Variety-Seeking and Reinforcement Behaviours Using Panel Data. Journal of Marketing Research, 2, 263-291.
- Keller, K.L. (1993). Conceptualizing, Measuring, and Managing Customer-Based Brand Equity. Journal of Marketing, 57, 1-22.
- Khan, S. (2012). Role of Brand Characteristics and its Impact on Consumer Buying Behavior A Comparative Study of Middle and Lower Social Classes for Mobiles Handset Purchase. Global Journal of Human Social Science Sociology, Economics & Political Science, 12(13), 27-31.
- Lee, H.W., & Ramayah, T. (2018). Impact of Brand Experience on Loyalty. Journal of Hospitality Marketing & Management, 7, 755-774.
- Meent, J.W. v., Bronson, J.E., Wood, F., Gonzalez, R.L., & Wiggins, C.H. (2013). Hierarchically-Coupled Hidden Markov Models for Learning Kinetic Rates from Single- Molecule Data. Proc. Int. Conf. Mach. Learn. 361-369. New York: Proc. Int.
- Polister, P. (2008). Neuroeconomics: A Guide to the New Science of Making Choices. Oxford: Oxford University Press.
- Pratt, A. (2013). Perception vs. Reality. Southfield: Polk.
- Puska, A., Stojanovic, I., Sadic, S., & Becic, H. (2018). The Influence of Demographic Characteristics of Consumers on Decisions to Purchase Technical Products. The European Journal of Applied Research, 2, 1-16.
- Srinivasan, R., Srivastava, R., & Bhanot, S. (2015). Impact of Marital Status on Purchase Behaviour of Luxury Brands. Journal of Business and Management, 7(1), 82-93.
- Stanke, M., & Waack, S. (2003). Gene Prediction with a Hidden Markov Model and a New Intron Submodel. Bioinformatics, 19(2), 215-225.
- Stewart, T.A. (1998). Intellectual Capital: The new wealth of organizations. New York: Crown Business.
- Tartaglione, A.M., Cavacece, Y., Russo, G., & Granata, G. (2019). A Systematic Mapping Study on Customer Loyalty and Brand Management. Administrative Sciences, 9(8), 1-21.
- Tucker, W.T. (1964). The Development of Brand Loyalty. Journal of Marketing Research, 3, 32-35.
- Tversky, A., & Kahneman, D. (1986). Rational Choice and the Framing of Decisions. The Journal of Business, 59(4), 251-278.
- Uslu, A., & Cam, T. (2000). Analysis of Brand Loyalty with Markov Chains.
- Yang, Y., Guo, Y., Ming, M., & Jiashun, H. (2019). Analysis of SMC Marketing System and Research of Customer Loyalty Identification based on HMM. International Conference on Management Science and Engineering Management, 794-812. Ontario, Canada: Springer.