Research Article: 2018 Vol: 22 Issue: 2
Analysis of Online Buying Pattern of Women Consumers with Reference to Apparels in India
Karishma Chaudhary, NorthCap University
Kavitha Gowda, NorthCap University
Abstract
Online shopping has become a way of life for most of the Indians especially working women. Indian online market is estimated to grow 3.5 times to touch 175 million by 2020. Main reasons of growing preference for online shopping are internet penetration, increasing number of e-tailors (online retailers), ease of shopping, flexibility in delivery, increasing purchasing power etc. According to Gizmobaba's report online transaction of women has doubled in past two years. As per one Google study, it is expected to drive 25 per cent of the total organized retail sales in India by 2020 and is expected to reach $60 billion in gross merchandising value. This study is an attempt to analyse online buying pattern of India women based on primary data. The study provides detailed analysis of various factors impacting the online purchase decision and most preferred e-tailors. The study provides recommendations to online sellers based on insights obtained by customers.
Keywords
Online Shopping, Indian Women, Internet Penetration, E-Tailors
Introduction
Current population of India is 1.34 billion comprising of 48.5% females and 51.5% males. Women constitute a share of 48.1% in urban population and of 48.6% in the rural population (India Guide, 2017). According to International Monetary Fund (IMF) and Central Statistics Organization (CSO) India has emerged as the fastest growing major economy in the world , and is expected to be one of the top three economic powers of the world over the next 10-15 years, backed by its strong democracy and partnerships (IBEF, 2017).Indian economy is expected to grow at a rate of 6.7 per cent in the year 2017-18 and in the next financial year 2018-19 the economy is expected to grow at a rate of 7.2 per cent.
Due to technological development, online business and application based online shopping in India has become a huge business with too many competitors offering almost all kinds of products required in everyone’s daily need. India is projected to have 636 million internet users by 2021. It is expected that by 2020, over 329 million people in India will buy goods and services online, up from 130.4 million in 2016 (Statista, 2017).
Figure 1 shows number of digital buyers in India from 2014 to 2020 which indicates online business to be a huge business.
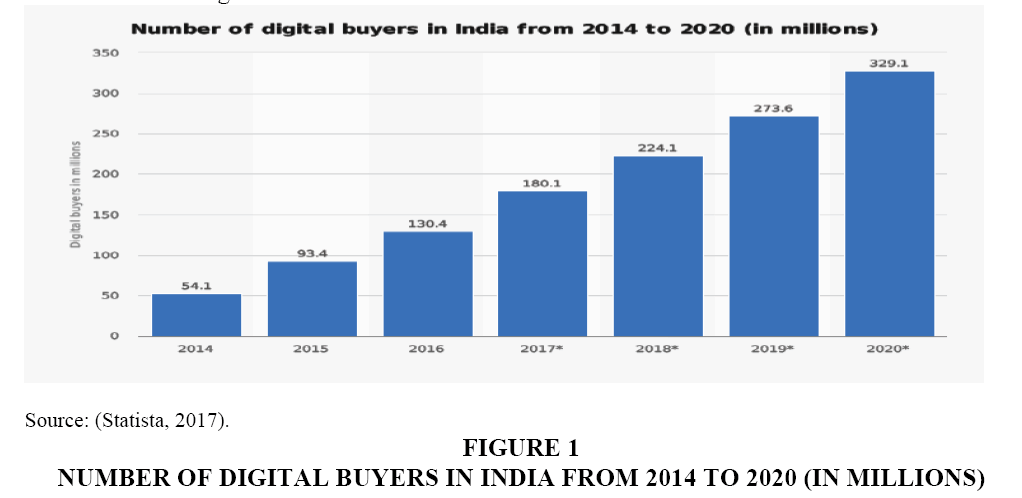
Figure 1: Number Of Digital Buyers In India From 2014 To 2020 (In Millions)
Women-influenced sales would be 35% of Indian e-commerce market estimated at $8.5 billion by 2016. These projections were made due to growth in internet penetration through smart phones and women finding it easier and convenient buying online. Indian women will fuel $3 billion e-shopping. Women being strong customer base have contributed to 40% of overall sales of Myntra in 2014 and are expected to contribute its apparel sale from 50-55% in the coming years. Facebook investor Accel indicated that Indian women are accepting the fashion online which was not so earlier. Devices like smart phones and tablets are making more women to buying online, especially, private categories like lingerie.
E-shopping market valued $8.5 billion in 2016 and number of online shoppers has reached 40 million in 2016 from 20 million in 2013 increasing at CAGR of 25%. Rise of middleclass consumers, with affordable smartphones, has made mobile become a most important medium of online shopping. Various applications owned by marketers offering various offers on having it have made online shopping more popular (Sharma & Kurian, 2014).
From the above statistics, since online shopping is not new, this study focuses on understanding the online shopping behaviour of women in Urban India.
Review of Literature
Ronald and Elizabeth (2002), in their study “Buying apparel over the internet”, found that internet was fun, safe, cheaper and quicker; women spent more on apparel than men, enjoyed shopping online more than men. Even if men spent more time on internet; it was women who spent more time and money on buying apparels. It was suggested that websites should attract more apparel buyers by focusing on safety, fun and speed. Also, the sites must ensure that their sites are fun to use, and offer prompt post-sale delivery of the ordered merchandise. The research suggested that future study could be undertaken on apparel from demographics, national groups of consumers and socio-economic area. The study also suggests comparing different categories apparels preferred by online buyers, new fashions or sizes and needs.
Sandy and Minjeong (2010) in their study to understand external cues on website of apparels that encourage impulse buying found that free shipping or a shipping discount, promotional offers and purchase ideas were desired the most as reasons for impulse buying online. This study suggested online marketers to provide more of offers, new style/fashions, and gift ideas and provide more return options and expand locations.
A study on Critical Review on in store and online impulse behaviour by Sir Hindi in Oklahoma State University in 2010, said that online shoppers had more privacy than in store buyers, impulse purchase can happen due availability of internet connection , greater variety of products can be seen online, internet provides more of direct and personalized marketing offers, credit cards have increased online impulse purchases , prices are relatively lesser than in store and internet has become easier source to compare products on different website.
Weng (2012) in their study to understand reasons for consumer apparel acquisition, stated that there were hidden reasons like peer pressure, self-identity, job requirement, price and convenience, retailer’s role as factors influencing consumers to buy and acquire more of apparels. Sunil (2015), in his study found that offline and online stores have to understand the factors that influence customers and work hard to attract towards their stores. Varsha (2014) in their study have found that quality, style, fit and exclusivity among product attributes were important among both the genders. It was found that male consumers wanted to be associated to established brands while female consumers focused on aesthetic appeal, colour, shades and wider collection. The study also said that the sources of information to Generation Z was by watching movies, YouTube videos and award function to learn about latest fashions, along with reading fashion blogs, Twitter and fashion related articles. Shubham & Shagufta (2015), examined the influence of consumer-decision making on online shopping apparels stated that men shop online just as often as women, shoppers who are highly fashion and brand conscious are more inclined to buy clothes online than with consumers having different styles. Value-conscious buyers visiting websites would look for price benefits and best offers. Social influence as a factor influencing buyers also holds good for ‘online’ shopping. Vilasini & Monica (2016) in their study conducted in India on “Factors influencing online buying behaviour of college students, : A Qualitative Analysis” found that the factors like friends/family/relatives, availability, convenience, best price, comparison, best promotion, ease of use, customer service, return policy, product information, trust, variety and visual merchandising were the influencing factors for online buyers.
Based on literature review a study is conducted to find out the online shopping behaviours of Indian women. A qualitative research approach was adopted in this study to get an idea of the factors which influence the online buying behaviours of women in India. The qualitative research helps in understanding perspectives of respondents, attitudes or experiences of the respondents and understands the purpose of buying online as well as if the respondents would continue to do so.
Objectives of the Study
• To analyse the online buying pattern of women in India
• To understand major factors influencing online shopping
• To provide recommendations to online retailers(e-tailers) based on consumer opinion
Research Methodology
The study is intended to analyse the online shopping behaviours of Indian women .Primary data is collected through a structured questionnaire. Cronbach’s alpha score of reliability test is 0.837. Questionnaire was prepared using Google forms and was circulated using electronic media. The data collected was analysed using Statistical Package for the Social Sciences (SPSS). Secondary data was collected from various journals, magazines, articles and web sources etc. The questionnaire contained demographic questions asking for the participant’s age, education, family income, marital status and occupation. To understand the buying pattern of Indian women questions were asked related to amount spent, device used in purchasing and method of payment. To analyse the frequency of purchase and use of major online platforms five point Likert scale was used {where 5=Almost Always; 4=Frequently; 3=Sometimes; 2=Occasionally; 1=Hardly Ever}. To understand how important are various factors like-brand, variety, return policy, style etc. are in influencing the purchase decision of women also Likert scale was used {where 5=Very Important; 4=Moderately Important; 3=Neutral; 2=Low Importance; 1=Not at all Important}.
Survey Participants
The data came from a survey of 241 women respondents from India during November and December 2017. The respondents were contacted more through Facebook connection and a few from whatsapp contact. Sample size was considered sufficient considering 95% confidence level. The respondents belonged to the age group between 18 to over 65 years. The women participants belonged to undergraduates, postgraduates, professional degree and doctoral degree holders.
Results and Discussions
Most of the respondents 69.3% (167) were found to be unmarried, A greater percentage, say, 60.6% (146) belonged to age group of 18-24 years these are very important as they are young, more of technology oriented and represent greater Indian population, 26.6% (64) from 25-34 years, 10% (24) belong to 35-44 years and 2.9% (7) belong to 44-54 years of age group as shown in Figure 2. 18-24 yrs. category is most attractive category, since they constitute a greater percentage of India’s youth population which is expected to be the richest by 2020. More than 50% of India's current population is below the age of 25 and over 65% below the age of 35 (www.indiaonlinepages.com, 2017).
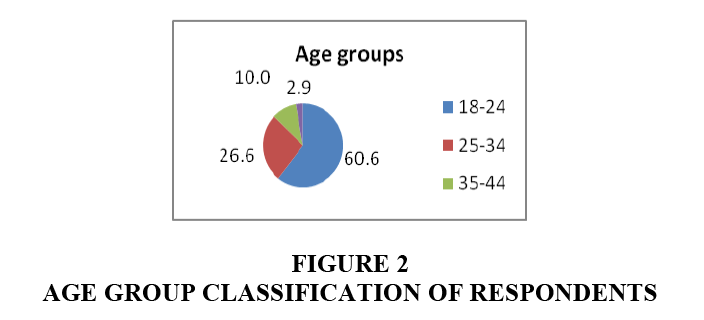
Figure 2: Age Group Classification Of Respondents
Figure 3 shows occupation of respondents. It shows majority of the respondents 44.8% are students, followed by 32.4% belonging to service/employed group, 13.3% being self-employed and 9.1% being homemakers. This shows young generation is more into online shopping.
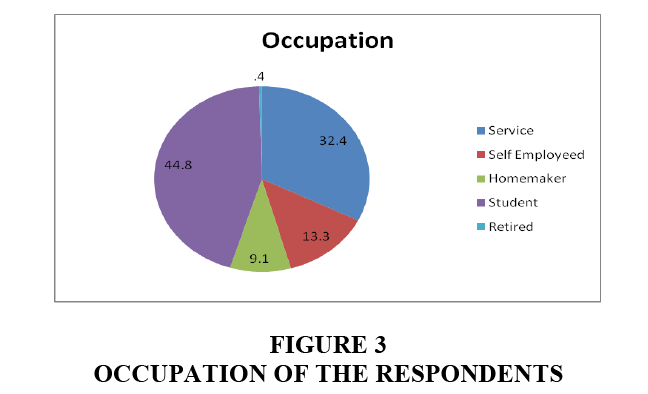
Figure 3: Occupation Of The Respondents
Figure 4 shows a major percentage, say, 34% belong to family annual income lesser than INR 5,00,000, closer to it, i.e., 32.8% belong to annual family income between INR 5,00,000 to 10,00,000, followed by 14.1% between 10,00,000 to 15,00,000, 14.1% greater than 20,00,000 income per annum and a less percentage of 5 belonging to 15,00,000 to 20,00,000. This shows that a good percentage of middle class and upper middle class are more into online shopping. 14.1% belonging to greater than INR 20, 00,000 per annum can be potential buyers. If these are happy buying online, may further buy more online. Thus, marketers should attract these customers by increasing offers, return policy, ease and convenience of exchange.
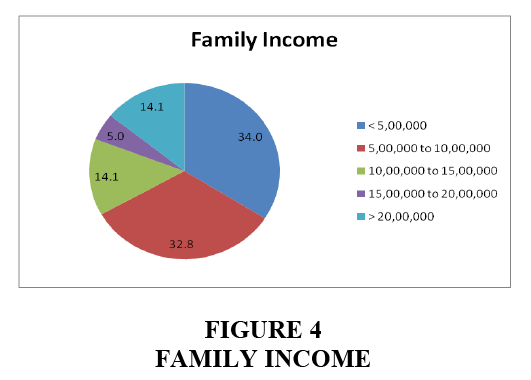
Figure 4: Family Income
Figure 5 shows a greater number, 49% spend INR 2,000 per month on online shopping, while 40.2% spend between INR 2000-4000 per month, 6.2% spend between 4000-6000 per month and the remaining 4.6% spend greater than INR 6,000 per month shopping online.
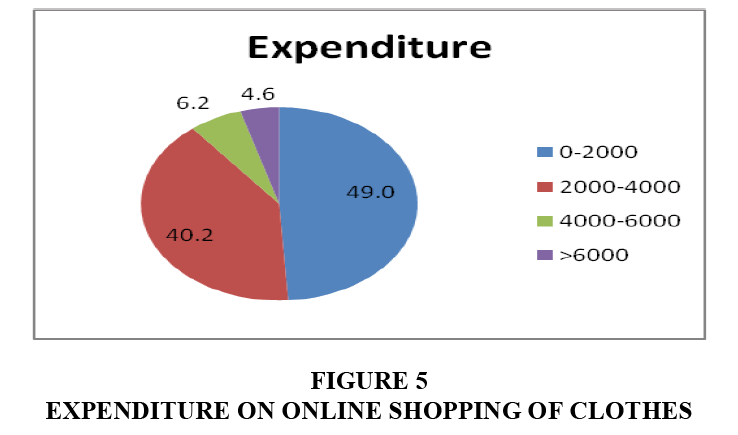
Figure 5: Expenditure On Online Shopping Of Clothes
Figure 6 shows Mobile phones have become the most preferred device to shop online as 82.2% belong to this category, while 13.7% use personal computers to buy online. This shows the quick shift in adapting to technology from personal computer to smart phones. Very less use tablets for online shopping.
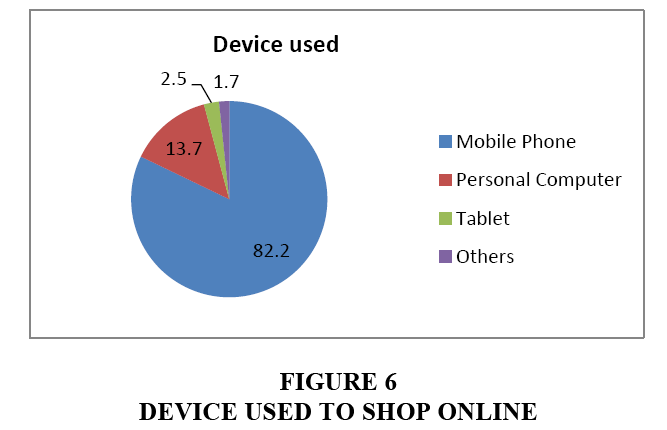
Figure 6: Device Used To Shop Online
Figure 7 shows the various modes of payments used by respondents. Most of the respondents, 55.2% pay by COD, 39.4% pay by using Debit/Credit card, 3.3% use bank transfer, while 2.1% prefer paying through wallets. Due to the increase of mobile penetration and increased usage of internet, India is expecting a huge growth of digital payments-wallet has a share of 38%, with the launch of Google wallet and Apple Pay; it is expected to streamline and standardize digital payments and thus offer better life to customers in India. This 2.1% of payments through mobile wallet, may grow bigger, if the marketers create more awareness and make the customers feel safe in transaction as it is highly preferred in future due to governments initiative of going digital.
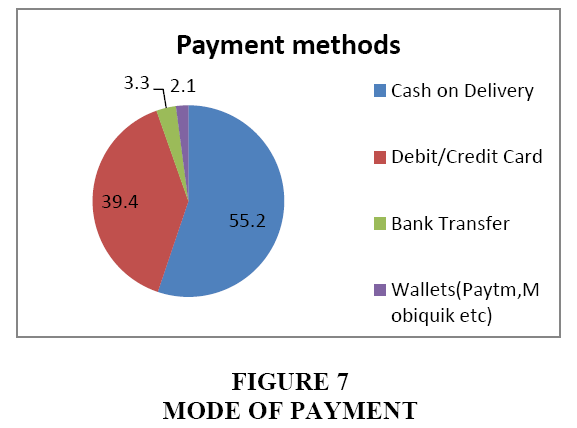
Figure 7: Mode Of Payment
Even though too many websites are in online business in India, we preferred few well known websites operating successfully. The responses shows Amazon and Myntra are most preferable sites for buying apparels. Table 1 show how frequently major platforms are used for online shopping.
| Table 1 Frequency Of Purchase From Different Websites |
||
| Mean | Standard Deviation | |
| How often do you buy clothes from Amazon? | 2.04 | 0.972 |
| How often do you buy clothes from Myntra? | 2.29 | 1.251 |
| How often do you buy clothes from Flipkart? | 1.84 | 1.086 |
| How often do you buy clothes from Zivame? | 1.52 | 0.907 |
| How often do you buy clothes from Jabong? | 1.70 | 1.071 |
| How often do you buy clothes from Limeroad? | 1.48 | 0.889 |
| How often do you buy clothes online? | 2.63 | 1.150 |
| How often do you compare clothes on different websites before buying? | 2.81 | 1.331 |
| How often do you go through the reviews of others before buying? | 3.42 | 1.389 |
| How often your purchases are planned? | 2.49 | 1.202 |
| How often your purchases are impulsive? | 2.68 | 1.182 |
| How often do you purchase Western wear? | 3.06 | 1.382 |
| How often do you purchase Traditional wear? | 2.32 | 1.105 |
| How often do you purchase party wear? | 2.39 | 1.204 |
| How often do you purchase sports wear? | 1.94 | 1.035 |
| How often do you purchase Lingerie? | 1.95 | 1.142 |
From the below table 1, we can say that a majority of respondents prefer comparing clothes on different websites and also look for reviews on websites. Hence, e-tailors must encourage customers to review their process and products by adding some points in customer account which can be used in next purchase. Since western wear is preferred the most while buying online .The reason could be majority of the respondents being young, with more disposable income. Hence, more varieties in western collections should be added to online stock. To boost up the sales of traditional and sportswear try and buy options can be introduced.
Table 2 indicates that comfort is utmost requirement by buyers .A majority of the respondents get influenced by value for money, style and variety in clothes offered. Other factors are return policy, timely delivery of the product, durability of the clothes, discount and offers and brands. Thus the marketers in online business for apparels must consider these influencing factors to attract and retain its customers.
| Table 2 Factors Considered While Making Online Purchase |
||
| How much brand influence your online purchase? | 3.88 | 1.094 |
| How much durability influence your online purchase? | 4.16 | 0.994 |
| How much styles influence your online purchase? | 4.43 | 0.927 |
| How much comforts influence your online purchase? | 4.57 | 0.843 |
| How much ease of delivery influence your online purchase? | 4.23 | 1.033 |
| How much varieties for money factor influence your online purchase? | 4.42 | 0.953 |
| How much values for money influence your online purchase? | 4.50 | 0.908 |
| How much return policy of e-tailor influence your online purchase? | 4.27 | 1.107 |
| How much discounts and offers influence your online purchase? | 4.08 | 1.024 |
Suggestions from E-Customers or Respondents to Improve on Online Shopping Behaviours
Suggestions were taken from respondents and the same are categorized under 5 areas: quality, display mismatch, information, product, service and availability, promotion and price (Table 3).
| Table 3 Consumer Suggestions To Improve Online Shopping Experience |
|
| Quality | Quality check of products before dispatching |
| Quality of material to be improved | |
| Better stitching quality to avoid quick wear off | |
| Colour of fabric | |
| Display mismatch | Products displayed on website doesn’t match with actual product |
| Colour mismatch | |
| Information | Provide better description about products, material of fabric |
| Size chart should be provided | |
| Customer ratings to be displayed | |
| Wash care | |
| Comparison of products for sale on different websites | |
| Product | Provide well-known brands |
| Varieties of products and brands | |
| Customized products | |
| Variety in sizes of clothes | |
| More durable clothes | |
| Improve on design and styles | |
| Service and availability | Timely delivery |
| Faster delivery | |
| Encourage customer feedback | |
| Trial purchase option | |
| Provide live chats | |
| Customer friendly | |
| Return rules should be made more simpler | |
| Better illustration of the product | |
| Clothes sizes vary with different brands and difficult to pick the right size of clothes | |
| Customer care service has to be improved | |
| Promotion/Offers | Discounts |
| Free shipping | |
| Customer loyalty program | |
| Offers on online purchase | |
| Price | Products purchase should provide value for money |
| Free shipping | |
Conclusion and Recommendations
Due to increased penetration of mobile phones and internet usage in India, online shopping has become a way of life!
Women in India shop apparels online. A greater percentage, 49% of the women spending 2000 rupees is an attractive business for marketers selling apparels online. Most (82%) of the women prefer buying apparels online through mobile phones. Indian population to be 65% youth holds good here as well since a greater percentage say, i.e., 62% of women buyers represent the youngest age group between 18-24 years, Along with this age group, 25-34 years age group category is most attractive, since they constitute a greater percentage of India’s youth population which is expected to be the richest by 2020. Hence, to capture these segments, e-tailers (e-retailers) can organize events in colleges, software parks and shopping malls. To promote online payments offers can be given on Credit/Debit usage and wallets usage.
Few respondents who feel that by adding delivery charges by online stores or e-tailers (e-retailers), the price of the product gets increased or looks expensive, the marketers in online business can offer products which are expensive or if the customer is buying in bulk, marketers must offer free home delivery. Along with this, if marketers can quickly solve the issues in buying online like, trial purchase, colour difference and return policy, it can attract better business.
With the existence of competition, marketers in order to survive and grow profitably, have to understand factors like return policy, timely delivery of the product, durability of the clothes, discount and offers, brands, comfort, value for money, style and variety in clothes offered.
India being about 70% rural, which is improving in purchase power and Government of India entering into Memorandum of Agreements with the industries, for making rural India a Wi-Fi India, can be an attractive business for online marketers.
References
- IBEF. (2017). About Indian economy growth rate & statistics. Retrieved November 23, 2017, from https://www.ibef.org/economy/indian-economy-overview.
- India Guide. (2017). Retrieved from www.indiaonlinepages.com: http://www.indiaonlinepages.com/population/india-current-population.html.
- Ronald, E.G. & Elizabeth, B.G. (2002). Buying apparel over the internet. Journal of product & Brand Management, 11(2), 89-102.
- Sandy, D. & Minjeong, K. (2010). Cues on apparel websites that trigger impulse purchases. Journal of fashion Marketing and Management, 14(2), 230-246.
- Sharma, S. & Kurian, B. (2014). Indian women will fuel $3 billion e-shopping. Retrieved from timesofindia.indiatimes.com: https://timesofindia.indiatimes.com/business/india-business/Indian-women-will-fuel-3-billion-e-shopping/articleshow/32755250.cms.
- Shubham, G. & Shagufta, K. (2015). Impact of consumer decision-making styles on online apparel consumption in India. Vision, 19(4), 303-311.
- Statista. (2017). Countries with the highest number of internet users as of June 2017 (in millions). Retrieved October 23, 2017, from https://www.statista.com/statistics/262966/number-of-internet-users-in-selected-countries/.
- Sunil. (2015). Trends and practices of consumers buying online and offline. International Journal of Commerce and Management, 25(4), 1056-9219.
- Varsha, J. (2014). Exploring generation Z’s purchase behaviour towards luxury apparel: A conceptual framework. Romanian Journal of Marketing, 4(2), 18-29.
- Vilasini, J. & Monica, K. (2016). Factors influencing online buying behaviour of college students: A qualitative analysis. The Qualitative Report, 21(1), 1-15.
- Weng, M. (2012). Apparel acquisition: Why more is less? Management & Marketing Challenges for the Knowledge Society, 7(3), 437-448.