Research Article: 2018 Vol: 22 Issue: 4
Antecedents of Customer Loyalty in The Mobile Telecommunication Market A Cross-cultural Investigation
Ioannis Rizomyliotis, University of Brighton
Kleopatra Konstantoulaki, University of Westminster
Kostas Kaminakis, National and Kapodistrian University of Athens
Apostolos Giovanis, University of West Attica
Avraam Papastathopoulos, Abu Dhabi University
Keywords
Telecommunications, Service Quality, Perceived Value, Loyalty.
Introduction
Service providers have realized the importance of customer loyalty as a key determinant of their long-term success and viability. While the benefits of having a loyal customer base are widely recognized and apparent for all service industries (Alrubaiee & Al-Nazer, 2010), there are cases were service providers tend to focus more on creating new customers rather than retaining the existing ones. One such case highlighting the above-mentioned situation is the UAE mobile telecommunication sector. The UAE telecommunications sector is characterized as one of the stronger and faster frowing secrots regarding the Arab word (A study of the UAE Telecommunications Sector, 2015). This represents one of the highest mobile penetration rates in the world. Morgan Stanley Capital International’s (MSCI) world index regards the UAE as an emerging economy. According to the International Telecommunication Union (2013) the UAE mobile telecommunications sector will continue to sustain on-going growth. The UAE is ranked first in the Arab states and 23rd among all of the 143 assessed countries according to the World Economic Forum’s 2015 Networked Readiness Index (NRI). The Telecommunications Regulatory Authority.
(TRA) of the UAE reported that the UAE had over 16.8 million mobile subscriptions. Still, on average, 9.1 thousand subscribers per month have switched between the two mobile operators, namely Etisalat and Du, using Mobile Number Portability (MNP). Further, service providers tend to direct their promotional focus to switchers, rather than creating sustainable and mutually beneficial relationships through Relationship Marketing Tactics (RMTs). Consequently, this has resulted into a promotional bombardment of customers, which, in turn, has generated many inactive lines, as subscribers frequently migrate from one service provider to another. The great potentials of the UAE mobile telecom market will intensify competition within the industry similarly to markets with comparable characteristics (Oyeniyi & Abiodun, 2010).
At the same time, global marketing is thriving in the Arab markets, whilst global culture brings about a paradigm shift from homogenous to heterogeneous buying habits (Fattah, 2006). Embracing more than 100 nationalities and different expressions of culture, Dubai and Abu Dhabi are the most diverse cities in the Middle East (Fattah, 2006). Locals and expats form the UAE unique identity with rich and diverse cultural habits and demands reflecting the influence of multicultural consumerism. Current knowledge and empirical data are still limited with regards to providing insights on the way customer loyalty works in countries like UAE, while most current cultural-specific strategies are based on studies from the western economies. Responding to this call to fill this research gap, this study aims to assess the antecedents of customer loyalty using data from the UAE mobile telecom industry and empirically investigate existing differences between local UAE residents and expats regarding their consumer behavioural patterns in the telecommunication sector. In this regard, the present study, adopts a cross-cultural, multi-group approach to simultaneously investigate perceived value, perceived service quality, customer satisfaction and trust as determinants and predictors of customer loyalty in services provision in an emerging economy context.
Background and Research Scope
Many studies conducted in various sectors in advanced western economies provide a robust scientific basis for this study. Customer loyalty refers to the continuous and repeated purchase of a product/service and the on-going relationship between a business and a customer (Dick & Basu, 1994). Customer databases and reward programs are used to ameliorate this relationship and businesses often seek to keep track of their customers’ buying preferences (Sharp & Sharp, 1997). In literature, most of the studies investigate brand loyalty, while loyalty in the services area is relatively undermined (Lee & Cunningham, 2001; Rizomyliotis et al., 2018).
Antecedents of Customer Loyalty
There are various approaches towards the investigation and the prediction of customer loyalty. Perceived value (Chang & Wildt, 1994), satisfaction (Lai et al., 2009) and service quality (Oyeniyi & Abiodun, 2010) have been considered as loyalty predictors. Still, the intrinsic difficulty in the services conceptualization and the lack of relevant research highlight the need for a better exploration of services customer loyalty.
Zeithaml (1988) posits that the provider’s value offer relates to the customers’ evaluation of the utility of the service. Benefits and costs as well as the outcome of the service contribute to the perceived value of the service (Lovelock, 2011). Service value, an important constituent of relationship marketing, is regarded as an antecedent of satisfaction (Cronin et al., 2000) and loyalty (Yang & Peterson, 2004). Thus, when value is perceived to be superior, it is expected to enhance loyalty and satisfaction. Therefore:
H1: Perceived value positively influences customer satisfaction.
H2: Perceived value positively influences customer loyalty.
Perceived service quality is known as the comparison of expectations with actual performance (Lewis & Booms, 1983) and has been extensively researched (Parasuraman et al., 1988). According to extant literature, there is a positive relationship between service quality and satisfaction (Cronin et al., 2000). With regards to customer loyalty, several studies in other sectors suggest that service quality can lead to customer loyalty (Bloemer et al., 1998). Previous studies also suggest that service quality has a direct impact on satisfaction (Nilsson et al., 2001). Therefore, the following hypotheses are formed:
H3: Perceived service quality positively influences customer satisfaction.
H4: Perceived service quality positively influences customer loyalty.
Customer satisfaction predominantly refers to the core business service and is defined as the number of customers, whose reported experience with a firm, its products, or its services exceeds the specified satisfaction goals (Farris et al., 2010). These ratings are widely researched in other industries and contexts and are considered to affect loyalty (Oliver, 1997). Additionally, as Garbarino and Johnson (1999) suggest, satisfaction will be positively related to trust. Trust is not widely researched but has an elevating importance, especially after the recent and noticeable emphasis to relationship marketing. As such, trust has been regarded as a predictor of customer’s future intentions (Morgan & Hunt, 1994). Prior research studies conceptualize trust as the act or the willingness to rely on the actions of another party, in this case the service provider (Morgan & Hunt, 1994). The development of expectations and the feeling of security are based on the belief that the service providers will strive hard to accommodate the customer’s needs. When companies manage to offset the uncertainty about the outcome of their actions, which by default involve risk, then the customer perceives them as reliable (Pedersen & Nysveen, 2001) and, hence, trust is expected to lead to loyalty. The model proposed in Figure 1 suggests that service quality and perceived value are significant predictors of customer satisfaction (relationship quality indicator). Similarly, customer satisfaction has a direct effect on both customer trust and customer loyalty and an indirect effect on customer loyalty through trust. It holds that service providers can employ satisfaction, which derives from high service quality and competitive value offers (relationship tactics), in order to influence the level of trust and then their customers loyalty. Therefore, the following hypotheses are formed:
H5: Customer satisfaction positively influences customer loyalty.
H6: Customer satisfaction positively influences customer trust.
H7: Customer trust positively influences customer loyalty.
Culture as a Moderator
According to Khizindar et al. (2015) very few studies in the Gulf region examine aspects such as loyalty regarding the telecommunication sector. As a result, companies in the Middle East markets are confused about how to treat and manage their customers’ needs effectively (Kassim & Souiden, 2007). The UAE region displays highly unusual characteristics in terms of its population mix, and human and economic development characteristics (Epps & Demangeot, 2013). According to Gulf News (2008), each different national group rates customer service regarding retails shops and government services very differently. Given that business in developing countries faces more risks than business in developed ones potential proposed managerial implications might decrease this risk.
Today, new practices are being adopted based on the Islamic principles of Shari’ah “Islamic law” (Meng et al., 2008). Other studies suggest that religion influences consumer behaviours, for example, with regard to the tourism sector (Weidenfeld and Ron, 2008).
Evidence indicates that religious cultures described as a “collectivistic society” encourage people to express more satisfaction regarding the services provided to them, compared with the Western “individualistic societies”. Yoo (2008) empirically supported that loyalty and equity was higher among people of high collectivism than those of low collectivism.
Individualism-collectivism can be approached as a bi-polar construct. Individualists consider their personal interests to be more important compared to the interests of a group and they place great importance on the achievement of their personal goals. The use of this characteristic as a point of difference among societies is crucial for the cross-cultural understanding of consumer behaviour (Maheswaran & Shavitt, 2000).
Moreover, individualists do not tolerate low quality and try to maximize their own satisfaction; therefore firms need to put more effort (Donthu & Yoo, 1998). According to the extant literature, there is a positive link between individualism and higher expectations level regarding the service industry (Donthu & Yoo, 1998; Furrer et al., 2000; Laroche et al., 2005) as different consumer cultures drive to different service quality perceptions and evaluations (Zhang et al., 2008). This paper responds to the call for investigation from a consumer behaviour perspective regarding cross-cultural services (Zhang et al., 2008). Therefore, we formulate the following hypothesis:
H8: The hypothesized paths will be stronger in the locals group compared to those of the expats group.
Methodology
A conclusive research design was selected in order to examine the relationships described in the conceptual framework. Random stratified sampling was employed and survey on mobile subscribers was conducted. The sample for this study was drawn from Abu Dhabi. Since one of our main aims was to compare the hypothesized effects between locals and expats, we then had to split the sample in order data to be equally collected regarding these groups. However, for each group we collected data that represents the demographic profile based on Abu Dhabi’s Statistics Center (2015) in terms of gender and age. A total of 398 questionnaires were collected, of which, 24 were excluded as incomplete. Therefore, the final sample consisted of 161 locals and 213 expats. Respondents were asked to indicate their agreement or disagreement on 5-point Likert-type scales (5=totally agree, 1=totally disagree). For this, items used in previous studies were adapted in order to measure service quality (Ganguli & Roy, 2010), perceived value (Kim, et al., 2007), customer satisfaction (Zeng et al., 2011), customer trust (Aydin & Ozer, 2005; Morgan & Hunt, 1994) and customer loyalty (Aydin & Ozer, 2005).
Analysis and Results
The construct reliability, convergent and discriminant validity of all measure had to be accessed before the hypotheses testing process. There were no unidirectional paths among the latent variables. All Cronbach Alpha values ranged from 0.741 to 0.863 exceeding the 0.70 threshold (Nunnally, 1978), indicating a high internal consistency regarding the measurement reliability. The constructs’ Composite reliabilities ranged from 0.745 to 0.878 and all factor loadings of the latent variables’ indicators were statistically significant and ranged from 0.543 to 0.765 indicating convergent validity. The ratio of construct variance to the total variance among the indicators used (Average Variance Extracted-AVE) exceeded the threshold of 0.5 further providing evidence of each construct’s convergent validity (Barcaly et al., 1995). In order to conduct Confirmatory Factor Analysis (CFA) for the constructs of the study, the Maximum Likelihood Estimator (MLE) method using AMOS 20 was selected as appropriate for large samples. According to the existing literature, CFI values of more than 0.90 indicate an acceptable fit (Medsker et al., 1994), TLI values of more than 0.90 indicate a good fit (Byrne, 2006), whereas RMSEA values should be below 0.08 (Browne & Cudeck, 1992). GFI values should exceed the threshold of 0.90 (Baumgartner & Hombur, 1996). As Tables 1 and 2 indicate, all these requirements were met.
| Table 1 Confirmatory Factor Analysis, Reliability and Validity |
||||
| CONSTRUCTS | CFI | TLI | GFI | RMSEA |
| Perceived Service Quality | 0.921 | 0.932 | 0.991 | 0.071 |
| Perceived Service Value | 0.945 | 0.942 | 0.993 | 0.073 |
| Customer Satisfaction | 0.913 | 0.963 | 0.996 | 0.045 |
| Customer Trust | 0.908 | 0.914 | 0.923 | 0.043 |
| Customer Loyalty | 0.929 | 0.921 | 0.992 | 0.063 |
| Table 2 Descriptive Statistics and Correlation Matrix |
|||||
| CONSTRUCTS | M | SD | AVE | C.R | Cronbach’s Alpha |
| Perceived Service Quality | 3.15 | 1.32 | 0.630 | 0.745 | 0.741 |
| Perceived Service Value | 4.31 | 1.57 | 0.621 | 0.785 | 0.766 |
| Customer Satisfaction | 3.65 | 1.76 | 0.613 | 0.842 | 0.814 |
| Customer Trust | 3.57 | 1.25 | 0.545 | 0.836 | 0.822 |
| Customer Loyalty | 4.13 | 1.67 | 0.574 | 0.878 | 0.863 |
The next step included the estimation of the fits of the hypothesized model and the examination of each path. As Table 3 shows, there is a good fit of the hypothesized model to our data.
| Table 3 Fit Indices and Path Coefficients |
|||
| PATH MODEL | SD BETA | SIG. | |
| (H1) | Perceived Service Value-Customer Satisfaction. | 0.386 | <0.01 |
| (H2) | Perceived Service Value-Customer Loyalty. | 0.261 | >0.05 |
| (H3) | Perceived Service Quality-Customer Satisfaction. | 0.347 | <0.01 |
| (H4) | Perceived Service Quality-Customer Loyalty. | 0.185 | <0.01 |
| (H5) | Customer Satisfaction-Customer Loyalty. | 0.315 | <0.01 |
| (H6) | Customer Satisfaction-Customer Trust. | 0.555 | <0.01 |
| (H7) | Customer Trust-Customer Loyalty. | 0.351 | <0.01 |
| CHI-SQUARE=735.32 DF=235. | |||
| CFI=0.922, TLI=0.963 GFI=0.996 RMSEA=0.071. | |||
Consistent with the previous findings, the significance tests for the path coefficients indicate a significant positive direct and indirect influence of most tested variables on loyalty. Therefore, the impact of Perceived Service Value on Customer Satisfaction was indicated with a coefficient of 0.386 (p<0.01) providing support for H1. Perceived Service Value direct impact on Customer Loyalty was found not statistically significant (β=0.261, p>0.05), therefore H2 is not supported. Regarding the impact of Perceived Service Quality on Customer Satisfaction (β=0.347, p<0.01) and Customer Loyalty (β=0.185, p<0.01) respectively, both hypotheses H3 and H4 were supported. The examination of the direct impact of Customer Satisfaction on Customer Loyalty and Customer Trust provided the statistically significant coefficients of β=0.315 (p<0.01) and β=0.555 (p<0.01) respectively, supporting hypotheses H5 and H6. Finally, H7 was supported as well, since our data provided evidence of the impact of Customer Trust on Customer Loyalty (β=0.351, p<0.01) a result that supports trust-commitment model (Morgan & Hunt, 1994). The model results are illustrated in Figure 1.
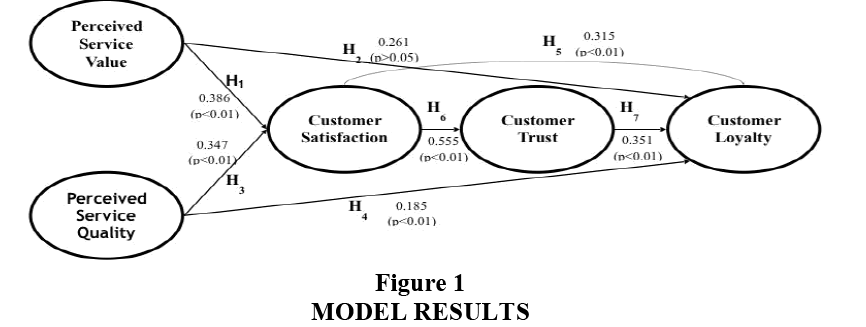
Figure 1: Model Results
In order to test H8, multi-group structural equation modelling had to be applied regarding the two groups (i.e Locals and Expats). The analyses indicate that all constructs fulfilled the configural invariance criterion. The hypothesized model was estimated unconstrained and fully constrained (constrained regression weights) and indicated that the two models do significantly differ. Table 4 presents the Z-Scores indicating the paths that differ across the two groups. According to the results and in line with H8, most of the hypothesized effects are significantly higher in the locals group.
| Table 4 Multigroup Z-Scores and Standardized Estimates |
|||||
| Paths | Z-Score | SIG. | LOCALS | EXPATS | |
| S.D. Beta | S.D. Beta | ||||
| (H1) | Perceived Service Value! Customer Satisfaction. | -0.813 | - | 0.423 | 0.301 |
| (H2) | Perceived Service Value! Customer Loyalty. | 0.525 | - | 0.286 | 0.245 |
| (H3) | Perceived Service Quality! Customer Satisfaction. | -4.321 | - | 0.427 | 0.321 |
| (H4) | Perceived Service Quality! Customer Loyalty. | -0.166 | - | 0.207 | 0.143 |
| (H5) | Customer Satisfaction! Customer Loyalty. | 0.812 | - | 0.365 | 0.282 |
| (H6) | Customer Satisfaction! Customer Trust. | -1.841 | - | 0.636 | 0.517 |
| (H7) | Customer Trust !Customer Loyalty. | -3.025 | - | 0.386 | 0.313 |
Discussion
To begin with, perceived value was not found to predict loyalty, which means that managers should not expect to achieve loyalty through the provision of value offers. The use of relevant relationship marketing tactics, such as promotion programs or direct mail don't seem to work since the competition is mainly and overly based on value offerings. Instead, intensive and advanced value offers can increase customer satisfaction and attract customers, but firms cannot rely on such tactics to create a solid and loyal customer base (Kim et al., 2004). Customers may perceive the provider’s service value as satisfactory, but that is not enough to prevent them from migrating to alternative providers (Bansal et al., 2005). This can be attributed to various factors like price sensitivity of the market or low switching costs. In this regard, service providers could aim at increasing the uncertainty of doing business with a new provider in order to offset such competition (Liu et al., 2011).
Additionally, the results show once again that trust-related issues are important determinants of technology acceptance in Arab countries (Aladwani, 2003). This effect is stronger for local residents than for expats and, in fact, many previous studies find that trust is one of the most important attributes for Arab consumers, especially for technology adoption (Kassim & Souiden, 2007). It would be, thus, beneficial for providers to emphasize the trustworthiness of the company. In doing so, managers need to train and empower the staff, which are responsible to sell the company's services, to curtail any dubious professional behaviour and build relationships based on mutual trust with the customer (Bettencourt & Brown, 1997). One of the key challenges in building and maintaining competitive advantage will be talent management (Hamza, 2016). Attracting and retaining people with the necessary skills is challenging and the telecommunications firms that can execute one such approach successfully will gain sustainable competitive advantage over future entrants, as enhanced employees’ performance can lead to improved service performance and thus increased customer trust. For that reason, GSM providers may need to reshape the company’s culture. At a later stage, as shown in the results of the study, increased customer trust can eventually lead them to achieve increased customer loyalty, a finding that is consistent with results from previous studies (Karjaluoto et al., 2012). What’s more, providers that conscientiously attempt to provide advanced or differentiated high service quality to the customer can manage to increase both customer satisfaction and loyalty and, in turn, service performance (Lai et al., 2009; Ismail et al., 2006). Both perceived service quality and perceived service value were shown to be good predictors of customer satisfaction, consistent with previous studies conducted in well-established economies (Cronin, 2000). Results, once more are more effective when it comes to local residents, driving the focus of operating companies towards that direction. Customer loyalty is top priority in services where competition is fierce or when services have little differentiations, like in the telecommunications sector (Santouridis and Trivellas, 2010). Therefore, providers should make all efforts to accommodate customer’s expectations by developing strategies to ensure trusted relationships with their customers. To this end, companies should provide new ways of purchasing and establish them as new habits by highlighting the purchase value together with the benefits of repurchasing these services in the future (Rahman et al., 2010).
Conclusions and Implications
The model that is presented in this study effectively represents the collected data and thus contributes to the limited research that has been performed in the area of customer loyalty in emerging economies. Based on our findings we have discussed some interesting implications that may be useful to marketing managers or executives in their effort to improve the performance of their service provision.
The telecommunications industry is in the early stages of an advanced-analytics revolution (Hamza, 2016). Continuous upgrading infrastructure will go a long way to improving the performance of service. Network operators that are able to make the leap to a more digital, analytics-driven business model will be in a better position to retain and maximize their customer relationships and their productivity and performance. Still telecoms providers can expect to have better results in terms of customer retention and in turn, performance of service provision, if they also manage to establish a trustful relationship with their customers. Making this happen, however, will require new ways of thinking, new types of leadership and a cultural change.
There are a few limitations in our study that should be considered in the interpretation of the results and implications. First, our sample size is sufficient and satisfactory; however, a larger sample may be used in future studies. Second, it may be fruitful to replicate our study in a similar research setting in other developing countries or Middle East regions and in other services or sectors. Nevertheless, the results provide meaningful information and contribute to the existing knowledge about the items that are measured with regard to UAE customers.
References
- Aladwani, A.M. (2003). Key internet characteristics and e-commerce issues in Arab countries. Information Technology & People, 16(1), 9-20.
- Alrubaiee, L., & Al-Nazer, N. (2010). Investigate the impact of relationship marketing orientation on customer loyalty: the customer's perspective. International Journal of Marketing Studies, 2(1), 155-174.
- Aydin, S., & Ozer, G. (2005). The analysis of antecedents of customer loyalty in Turkish mobile telecommunication market. European Journal of Marketing, 7(8), 7-23.
- Bansal, H.S., Taylor, S.F., & James, Y.S. (2005). Migrating to new service providers: Toward a unifying framework of consumers’ switching behaviours. Journals of Academy of Marketing Science, 33(1), 96-115.
- Bettencourt, L.A., & Brown, S.W. (1997). Contact employees: Relationships among workplace fairness, job satisfaction and prosocial service behaviours. Journal of Retailing, 73(1), 39-61.
- Bloemer, J., & De-Ruyter, K. (1998). On the relationship between store image, store satisfaction and store loyalty. European Journal of Marketing, 32(6), 499-513.
- Chang, T.Z., & Wildt, A.R. (1994). Price, product information, and purchase intention: An empirical study.
- Dick, A.S., & Basu, K. (1994). Customer loyalty: toward an integrated conceptual framework. Journal of the Academy of Marketing Science, 22 (2), 99-113.
- Farris, P.W., Neil, T.B., Phillip, E.P., & David, J.R. (2010). Marketing metrics: the definitive guide to measuring marketing performance (Second Edition). Upper Saddle River, New Jersey: Pearson Education, Inc.
- Ganguli, S., & Roy, S.K. (2010). Service quality dimensions of hybrid services. Managing Service Quality, 20(5), 404-424.
- Garbarino, E., & Johnson, M.S. (1999). The different roles of satisfaction, trust and commitment in customer relationships. The Journal of Marketing, 63(2), 70-87.
- Hamza, Z. (2016). Telecommunications industry at cliff’s edge. McKinsey & Company, Middle East and Africa.
- Ismail, S., Haron, H., Ibrahim, D.N., & Isa, S.M. (2006), Service quality, client satisfaction and loyalty towards audit firms, perceptions of Malaysian public listed companies. Managerial Auditing Journal, 21(7), 738-756.
- Karjaluoto, H., Jayawardhena, C., Leppäniemi, M., & Pihlström, M. (2012). How value and trust influence loyalty in wireless telecommunications industry. Telecommunications Policy, 36(8), 636-649.
- Kassim, N.M., & Souiden, N. (2007). Customer retention measurement in the UAE banking sector. Journal of Financial Services Marketing, 11(3), 217-228.
- Kim, H., Chan, H.C., & Gupta, S. (2007). Value-based adoption of mobile internet: An empirical investigation. Decision Support Systems, 43(1), 111-126.
- Kim, M.K., Park, M.C., & Jeong, D.H. (2004). The effects of customer satisfaction and switching barrier on customer loyalty in Korean mobile telecommunication services. Telecommunications Policy, 28(2), 145-159.
- Lewis, R.C., & Booms, B.H. (1983).The marketing aspects of service quality. Emerging Perspectives on Services Marketing, 65(4), 99-107.
- Lovelock, C. (2011). Services marketing. Pearson Education India.
- Maheswaran, D., & Shavitt, S. (2000). Issues and new directions in cultural psychology. Journal of Consumer Psychology, 9(2), 59-66.
- Meng, F., Tepanon, Y., & Uysal, M. (2008). Measuring tourist satisfaction by attribute and motivation. Journal of Vacation Marketing, 14(1), 41-55.
- Morgan, R.M., & Hunt, S.D. (1994). The commitment-trust theory of relationship marketing. Journal of Marketing, 58(3), 20-38.
- Nilsson, L., Johnson, M.D., & Gustafsson, A. (2001). The impact of quality practices on customer satisfaction and business results: product versus service organizations. Journal of Quality Management, 6(1), 5-27.
- Oliver, R.L. (1999). Whence consumer loyalty? The Journal of Marketing, 63(1), 33-44.
- Oyeniyi, J.O., & Abiodun, J.A. (2010). Switching cost and customer’s loyalty in the mobile phone market:The Nigerian experience. Business Intelligence Journal, 3(1), 111-122.
- Palmatier, R.W., Dant, R.P., Grewal, D., & Evans, K.R. (2006). Factors influencing the effectiveness of relationship: a meta-analysis. Journal of Marketing, 70(4), 136-153.
- Parasuraman, A., Zeithaml, V.A., & Berry, L.L. (1988). Servqual: A multiple-Item Scale for measuring consumer perceptions of service quality. Journal of Retailing, 64(1), 12-40.
- Pedersen, P.E., & Nysveen, H. (2001). Shopbot banking: An exploratory study of customer loyalty effects. International Journal of Bank Marketing, 19(4), 146-155.
- Rahman, S., Haque, A., & Ahmad, M.I.S. (2010). Exploring influencing factors for the selection of mobile phone service providers: A structural equational modeling (SEM) approach on Malaysian consumers. African Journal of Business Management, 4(13), 2885-2898.
- Ravald, A., & Grönroos, C. (1996). The value concept and relationship marketing. European Journal of Marketing, 30(2), 19-30.
- Rizomyliotis, I., Poulis, A., Giovanis, A., Konstantoulaki, K., & Kostopoulos, I. (2018). Applying fcm to predict the behaviour of loyal customers in the mobile telecommunications industry. Journal of Strategic Marketing, 59(4), 409-422.
- Santouridis, I., & Trivellas, P. (2010). Investigating the impact of service quality and customer satisfaction on customer loyalty in mobile telephony in Greece. The TQM Journal, 22(3), 330-343.
- Sharp, B., & Anne, S. (1997). Loyalty programs and their impact on repeat-purchase loyalty patterns. International Journal of Research in Marketing, 14(5), 473-86.
- Spector, P. (1992). Summated rating scale construction, (First Edition). Thousand Oaks, CA: Sage.
- Weidenfeld, A., & Ron, A. (2008). Religious needs in the tourism industry. Anatolia: International Journal of Tourism and Hospitality Research, 19(2), 18-22.
- Yang, Z., & Peterson, R.T. (2004). Customer perceived value, satisfaction, and loyalty: The role of switching costs. Psychology & Marketing, 21(10), 799-822.
- Zeithaml, V.A. (1988). Consumer perceptions of price, quality, and value: A means-end model and synthesis of evidence. The Journal of Marketing, 52(3), 2-22.
- Zeng, F., Yang, Z., Li, Y., & Fam, K. (2011).Small business industrial buyers’ price sensitivity: Do service quality dimensions matter in business markets? Industrial Marketing Management, 40(1), 395-404.