Research Article: 2017 Vol: 18 Issue: 2
Are Worst Students Really More Overconfident? A Preliminary Test of Different Measures
Anna Maffioletti,University of Eastern Piedmont
Marco Novarese, University of Eastern Piedmont
Keywords
Overconfidence, Metacognition, Predictive Ability, Performance.
Introduction
The idea that overconfidence is a common problem among students–particularly the less able–is widely spread among those who work on educational economics and is supported by a series of articles. In Grimes (2002) the score forecasts of the most able students are more pessimistic (under confident) and anyway nearer–in absolute value–to the effective score value with respect to the forecasts of the less able students, who tend to overestimate their performance. Similar results are found for students in Economics by Grimes & Millea (2004), Nowell & Aston (2007) and for psychology students by Ochse (2001), Johnson & Purvis (2012) as well as by the cognitive psychologist Chew (2011) in the data shown in his video guide for teaching and in different contributions. In a previous study Novarese (2009) finds a correlation between ability and overconfidence also among the students of the course in Economics of the Law Faculty in the University of Piemonte Orientale. Grimes (2002), Ambrose et al. (2010) & Kennedy et al. (2002) and many others connect overconfidence to meta-cognitive abilities. The best students are better able to think about what they know this makes them more aware of their own knowledge and therefore more able to evaluate themselves. However, this mainly explains the higher predictive ability of the better students, but not necessarily overconfidence. On the contrary, one could think that students who have the poorest metacognition have no clue how weak the understanding of a concept is (see for instance Chew, 2012). If on one side this sounds reasonable, on the other it suggests that less able students do not know they are so and this seems a less credible statement many students know that they do not understand, have lower aspiration levels (Castellani et al., 2010), they do not feel much like studying and so on.
The aim of this work is to give a contribution to this discussion through an empirical analysis about the link that may exist between metacognitive abilities and overconfidence. In particular we want to empirically discuss the existence and the sign of its direction.
Many contributions in the literature (see for instance Clayson, 2005) suggest that the relation between metacognitive abilities and overconfidence needs to be investigated further. For example, in Willingham’s (2009) model on students’ ability based on cognitive science, knowledge depends on integrated units of knowledge (chunks) or, more simply, in a series of building blocks, without which short time memory has to record and organize too much information5. For example, when a child who is learning to read must understand a sentence, the short time memory effort is enormous he must recognize letters, keep them in mind to compose words, keep these in mind and so on, while an adult reads the words directly. A student who hardly reads English will strive enormously to study for instance philosophy in English–his mind has to organize too much information simultaneously (understand words, sentences and then interpret them).
In the framework of this reasoning the difficulties and effort that learning implies might limit the student’s interest in the subject and cause uncertainty in his abilities to such an extent to make it unlikely for him to be overconfident.
The literature on overconfidence in general is vast, following the article by Russo & Schoemaker (1992). A key point of this literature already proposed by Russo & Schoemaker themselves underlines the connection between the possibility of having a feedback and potential overconfidence. Those who receive clear and continuous feedback should be more able to evaluate themselves. Students have by definition a continuous feedback and in this perspective it seems odd that they cannot adapt to the situation.
In addition the existence of an inverse relation between score and overconfidence may be the result of some measurement artifice. Overconfidence is defined by comparing the predicted score (generally asked immediately before or after the exam) with the actual one. If the score forecast were utterly random (that is, if people drew a ticket from an urn with a score between 18 and 306) or if everybody would forecast a score similar to that of the average it would be normal to find overconfidence among the low scores (if everybody forecast a 25, those who take a lower score are overconfident and those who take a higher score are under confident). Obviously the predicted score is not random and is generally correlated to the actual score, but the more random is the score or the more people tend to forecast a similar average score, the more an effect of this kind is likely to be observed.
From an econometric point of view, if we use a model in which the dependent variable is some ratio (or difference) between the actual and predicted score and among the independent variables we have the actual score, obviously a problem arises (the higher is the actual score, the lower is the variable which measures overconfidence). For this reason Grimes (2002) correlates forecasting ability to an indicator of student’s cognitive abilities, more than to the actual score. This is a solution that may technically solve the endogeneity problem, but in fact only bypasses it. The best students inevitably have better performance in the exam and then the cognitive abilities indicator is inevitably correlated to the actual score. One could have students who are generally good but perform badly in the exam (for instance, they have little time to study for it) and are able to predict it. In this case however overconfidence should occur with low scores more than with high ones.
The measurement problem can also be seen from a different perspective. Gigerenzer (1991) notes that over confidence depends among other things also on the way in which forecasts are elicited. One thing is to ask an overall forecast of the score, another is to ask for an evaluation question by question. To forecast a score can be complicated and then forecast becomes necessarily something random. Moreover, a student who always takes the top scores will have less difficulty in forecasting the score he will obtain it is possible that the best students will simply be favoured with respect to the worst ones, in particular if the worst students have a higher score variance–there are students who always take the top score, while students who always take the lowest score are possibly less.
Understanding whether the answer to a single question is correct is likely to be easier than evaluating a test containing a whole set of questions. Students can value at once whether they get the right answer or whether they cannot be able to answer at all. If a person knows he will get it wrong, he will not give the wrong answer, but if he realizes he gives a random answer his confidence should be low. As a consequence a different way of evaluating overconfidence could take to different results (see for instance Koriat et al., 1980).
The analysis of overconfidence should be influenced by incentives: for what reason a student should reveal the score he expects to get or why should he make the effort to make a sensible forecast? To our knowledge the literature does not tackle this problem. In our work we introduce incentives, by introducing the possibility that the total student’s score obtained by answering the exam question is reduced in case of inaccurate prediction.
Aim of this work is to show some preliminary evidence of how ways of measuring overconfidence might lead to results which are different from the ones in the literature. In the work which follows we therefore elicit forecast evaluation on a set of single one-by-one questions; we introduce as an incentive a negative evaluation for incorrect forecasts and-last but not least-we propose four different measures of overconfidence and predictive ability.
Section 2 describes how the data for the analysis have been collected; section 3 introduces the different indicators of predictive ability and overconfidence and discusses the results; section 4 concludes.
The Data
Our analysis is based on two different data sets. The first one concerns the course in Economics of the Law degree (University of Eastern Piedmont) in Alessandria, Italy. The second concerns the courses of two different degrees: Legal services for firms and Tourism marketing in Novara (same University). The two courses are analogous in content the first is for first-year students the second for second-year students, all without previous knowledge in Economics.
The First Dataset
The course has been held between the end of September and December 2011. The exam for this course was taken at the end of October. In order to take the midterm the students had to solve a series of exercises (quizzes and multiple choices) on the Moodle platform in the previous month, with some intermediate deadlines. The trial quizzes could be taken more than once and many students did that. Hence the data used in our analysis consist of two sets. The first concerns the trial exercises; the second set concerns the midterm exam. The sample for both sets is composed by 94 students.
Trial Exercises
Moodle is a platform for long-distance learning, in which it is possible to hand out material, prepares quizzes that can be solved online, together with a series of other activities. Students’ activity can be wholly traced and checked. In Moodle quizzes can be constructed with different characteristics. The characteristic we have used is the so-called confidence based mark (CBM), in which students have to state the level of confidence in the answer by choosing among three levels: low, intermediate or high. The total score depends on whether the answer is correct and on the level of confidence stated, that is, on the student’s ability of self-evaluation. The standard score assigned by Moodle in the CBM modality is shown in Table 1 below.
| Table 1 The Score Assigned By Moodle in the Cbm Modality |
|||
| Forecast | Right answer | Wrong answer | Missing answer |
| High | 3 | -6 | 0 |
| Intermediate | 2 | -2 | 0 |
| Low | 1 | 0 | 0 |
As can be seen from this table, this system strongly penalizes the wrong answers with an intermediate or high level of confidence8. Therefore the above values were used only in the trial quizzes the students could use to exercise at home (which had no effect on the midterm score).
The Midterm
The midterm was divided in two parts and was run on Moodle, at the faculty lab. The first part (QUIZ) included 30 questions (each valued one point if correct and minus one fourth of point in case of wrong answer). The second part (CBM) included six questions, of the value of 0.5 points each9. Besides answering to the questions, in the CBM students had to declare how confident they were in giving that answer. As mentioned in the introduction this set of questions allows us both to introduce a question-by-question evaluation method and an incentive for revealing the right evaluation. When taking the CBM 6 question test students did not know the score obtained in the other 30 question quiz (revealed only at the end of the CBM test). The CBM test is a sort of smaller quiz, about the same topics as the long one. This allows having two independent evaluations of the same program, where the CBM 6-question test allows also evaluating the student’s level of confidence in his own answers, while the 30-question one is a more extensive evaluation of the student’s knowledge of the subject.
The score has been calculated in a way different from the standard one in Moodle given in Table 1 above. The values we used are described in Table 2 below.
| Table 2 The Score Assigned by the Cbm Modality in the Midterm |
||
| Answer | ||
| Forecast | Right | Wrong |
| High | 1 | -0.5 |
| Intermediate | 0.5 | -0.25 |
| Low | 0.25 | 0 |
As can be seen from this table, the wrong answers with intermediate/high levels of confidence are still penalized, but less than before, as we thought that the score given by Moodle was too penalizing for a real exam. Anyway a risk to lose points still remains, which can have an important role in giving an incentive for a correct evaluation. This risk is present in many real decisions in which people have to estimate their own abilities (for instance, if I run a firm and fail, I lose money10). If one is not well prepared, even to take an exam determines a sort of failure.
The Second Dataset
The course has been held between the end of February and the end of May 2012. The data concern the first midterm at the end of April. Requirements to take the midterm are analogous to the ones of the previous dataset. However, for the second dataset, among the trial quiz there were no trials with CBM quiz. Therefore students in this dataset have met the CBM quiz for the first time during the exam (with the score as in Table 2). 67 students participated to this part.
Another important difference in this case with respect to the first dataset is that before taking the CBM test students see the score in QUIZ, so that differences between the two classes do not allow to test the effect of a single variable (reveal or not the score of the midterm)11.
The following Table 3 summarizes the features of the two different datasets:
| Table 3 Summary of the Design Features |
|||
| Trial exercise | Midterm exam | ||
| QUIZ (30 questions with no confidence level) | CBM 6-question test with values in Table 2 | ||
| Dataset 1 N=94 |
With CBM and values in Table 1 | Yes | Yes Before knowing the results from QUIZ |
| Dataset 2 N=67 |
Without CBM | Yes | Yes After knowing the results from QUIZ |
Results
An Introductory Analysis
In the context of our work overconfidence occurs when there is no consistency between the student’s level of confidence on the correctness of the answer and the correctness of the answer itself.
One could speculate about which would be the optimal choice, on the basis of different probabilities of answering correctly or not. For example, if the probability of answering correctly is 1, the expected value when one chooses “high” is 1, against 0.5 or 0.25 one would get by choosing “intermediate” or “low”. In this way, it can be shown that “intermediate” is never the expected value maximizing choice and then it should never be chosen. When the probability of answering correctly reaches around 0.333, it starts being convenient to declare “low” instead of “high”. What stated below can be seen in Figure 1, where we plot the expected points as a function of P for the three different confidence levels: one can see that the straight line for the intermediate level is never higher than both of the others for any value of P.
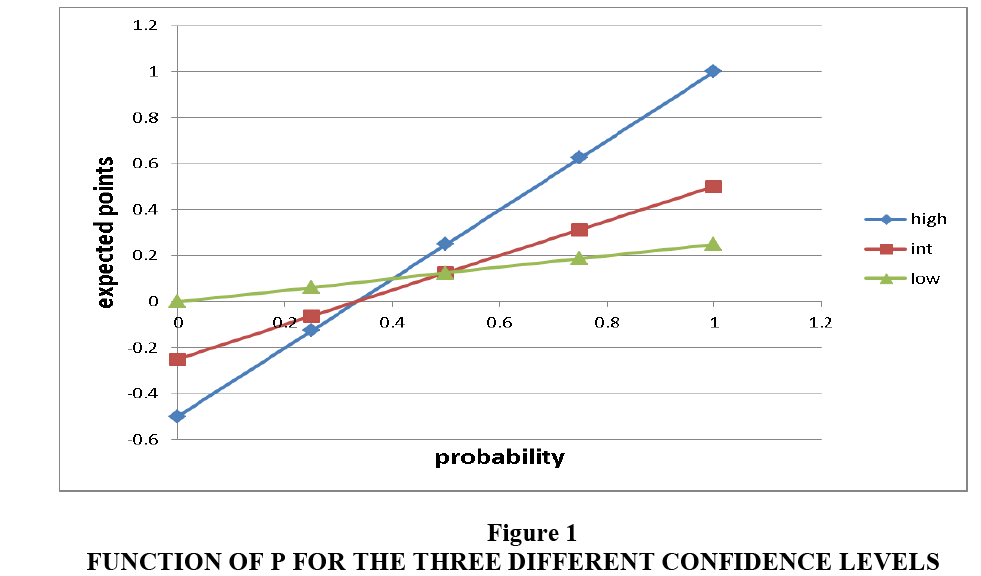
Figure 1: Function of P for the Three Different Confidence Levels
In order to have a first general indicator of the ability of self-evaluation, it is possible to compare the right answers for each confidence level for the trial exercise tests (only for the first dataset) and for the midterm exam test (both datasets).
Table 4 shows that the values of the three tests are very similar. In all cases the percentage of correct answers for each confidence level is significantly different from the other ones (both with parametric t and nonparametric Wilkinson rank-sum tests) always at the 99% significance level (apart from the difference between “high” and “low” in the first dataset exercise, which is significant at the 90%, while the difference between “intermediate” and “low” is not significant). This is a first evidence of some ability in evaluating the level of confidence; in other words, the confidence level is correlated with the percentage of correct answers. When confidence is low, in fact, the number of wrong answers is higher. It is important to note that this ability of self-evaluation is good even in the tutorial phase, where students are less motivated and, possibly, even less prepared. At a first sight it seems possible to conclude from our data that all students are able to make right predictions about their abilities.
| Table 4 Differences in Percentages of Correct Answers for Pairs of Declared Confidence Levels |
||||||
| Declared level of confidence | N | P value t test | WR test | |||
| High | Intermediate | Low | ||||
| Dataset 1 midterm exam QUIZ | 0.93 | 0.65 | 76 | 0.000 | 0.000 | |
| 0.81 | 0.44 | 32 | 0.001 | 0.001 | ||
| 0.85 | 0.47 | 32 | 0.000 | 0,000 | ||
| Dataset 1trial exercise | 0.98 | 0.80 | 40 | 0.00 | 0.001 | |
| 0.80 | 0.76 | 18 | 0.739 | 0.722 | ||
| 1 | 0.84 | 15 | 0.110 | 0.102 | ||
| Dataset 2 | 0.95 | 0.65 | 41 | 0.000 | 0.000 | |
| 0.83 | 0.45 | 27 | 0.001 | 0.001 | ||
| 0.96 | 0.46 | 35 | 0.000 | 0.000 | ||
On the first dataset it is also possible to run a test in order to evaluate possible differences at an individual level between the trial test and the exam (as evaluation was different in the two cases) for each declared confidence level. Table 5 shows that there are no significant differences: motivation does not influence the ability of self-evaluation.
| Table 5 Differences in Percentages of Correct Answers between the Exercise and the Exam for Each Declared Confidence Level - Dataset 1 |
|||||
| N | Midterm exam QUIZ | Trial exercise | P value t test | WR test | |
| High | 66 | 0.92 | 0.91 | 0.882 | 0.91 |
| Intermediate | 61 | 0.73 | 0.77 | 0.450 | 0.532 |
| Low | 14 | 0.54 | 0.44 | 0.557 | 0.537 |
Preparation and Confidence
In a test of the kind illustrated here overconfidence occurs when declaring a high or intermediate confidence level, then giving a wrong answer; this determines partially negative scores for that specific question. Under confidence on the other hand occurs when declaring low (or intermediate) levels of confidence, then giving a correct answer. A good ability of self-evaluation occurs when the correct answers are valued at their best and wrong answers do not cause (big) losses. As a consequence, a student with a good ability to self-evaluation obtains a high score from correct answers and does not lose points from the wrong ones.
When correlating these observations to the student’s abilities, one has to consider that the best students also have less wrong answers or (in some cases) they have none12. An individual comparison is made impossible by the fact that somebody never declares low levels.
We therefore construct four different indexes, in order to measure the relation between predictive ability and over (under) confidence.
1. Gain Of Points From Correct Answers (GC)=Points obtained in the quiz from correct answers/Number of correct answers.
A student with a perfect ability to know what he knows, should have a value of this index equal to 1, as the answers with a high level of confidence are valued 1; the index cannot be higher than 1 and if it is lower it means that correct answers have not been valued at best (and then there is some kind of under confidence or at least a reduced ability of self-evaluation).
2. Loss Of Points From Wrong Answers (LW)=points lost from wrong answers/wrong answers. A student with a perfect forecast ability, should not lose points (given that he has wrong answers)13; this index has a negative value or at most is valued zero (when mistakes are classified with a low confidence level and therefore do not cause loss of points). The more negative is this index the higher is the confidence level of the student with respect to mistakes and, therefore, he is overconfident (high values are therefore the more negative).
3. Confidence Indicator (CONF)=(wrong answers with high confidence level * 2)+wrong answers with intermediate confidence level–correct answers with intermediate confidence level-(correct answers with low confidence level*2)14
This indicator assigns a positive and high weight to the wrong answers with an intermediate or high confidence level and a negative score to the correct answers with a low or intermediate level. A student with a perfect ability for self-evaluation has an index value equal to 0. A positive value of the index indicates overconfidence, while a negative value reveals under confidence.
4. Ability of self-evaluation indicator (CAL)=(wrong answers with high confidence level * 2)+wrong answers with intermediate confidence level+correct answers with intermediate confidence level+correct answers with low confidence level*2)15
In this case all the answers in which there is a wrong calibration are valued in the same way, irrespective of whether they are overconfident or under confident. The higher the index, the less calibrated the answers16.
Table 6 shows Pearson correlation and Kendall’s Tau-b coefficients among the above indexes and the performance in the main exam, as well as the score of the CBM test, for the first dataset. Table 7 shows the same values for the second dataset.
| Table 6 Correlation between the Midterm Score and the Different Indexes of Measurement of Overconfidence – Dataset 1 |
|||||||
| Midterm score QUIZ | CBM score | GC | LW | CAL | OVER | ||
| Pearson correlation coefficients | |||||||
| Midterm score QUIZ | Kendall tau-b | 0.437*** | 0.219* | 0.080 | -0.395*** | -0.068 | |
| N | 88 | 88 | 64 | 88 | 88 | ||
| CBM score | 0.246*** | 0.096 | 0.507*** | -0.620*** | -0.502*** | ||
| N | 88 | 88 | 64 | 88 | 88 | ||
| GC | 0.140* | 0.102 | -0.433*** | -0.700*** | 0.781*** | ||
| N | 88 | 88 | 64 | 88 | 88 | ||
| LW | 0.035 | 0.397** | -0.338*** | -0.216 | -0.693*** | ||
| N | 64 | 64 | 64 | 64 | 64 | ||
| CAL | -0.242*** | -0.287*** | -0.591*** | -0.178* | -0.276*** | ||
| N | 88 | 88 | 88 | 64 | 88 | ||
| OVER | -0.010 | -0.449*** | -0.591*** | -0.605*** | -0.216*** | ||
| N | 88 | 88 | 88 | 64 | 88 | ||
Note: Significance levels are: *** 99%; ** 95%; * 90%. The values in the top-right part of the table are Pearson coefficients; values in the lower-left part are Kendall tau-b. The number of observations change for each couple, as not all students have, for instance, wrong answers
| Table 7 Correlation between the Midterm Score and the Different Indexes of Measurement of Overconfidence – Dataset 2 |
|||||||
| * | Midterm score QUIZ | CBM score | GC | LW | CAL | OVER | |
| Pearson correlation coefficients | |||||||
| Midterm score QUIZ | Kendall tau-b | 0.505*** | 0.334*** | 0.149 | -0.267** | 0.007 | |
| N | 64 | 65 | 49 | 67 | 67 | ||
| CBM score | 0.387*** | 0.860*** | -0.421*** | -0.339*** | 0.492*** | ||
| N | 64 | 62 | 47 | 64 | 64 | ||
| GC | 0.257*** | 0.705*** | -0.341** | -0.823*** | 0.846*** | ||
| N | 65 | 65 | 49 | 65 | 65 | ||
| LW | 0.094 | -0.312*** | -0.270** | -0.093 | -0.609*** | ||
| N | 49 | 49 | 49 | 49 | 49 | ||
| CAL | -0.215** | -0.109 | -0.685*** | -0.096 | -0.714*** | ||
| N | 67 | 64 | 65 | 49 | 67 | ||
| OVER | 0.055 | 0.412*** | 0.715*** | -0.557*** | -0.564*** | ||
| N | 67 | 64 | 65 | 49 | 67 | ||
Note: Significance levels are: *** 99%; ** 95%; * 90%. The values in the top-right part of the table are Pearson coefficients; values in the lower-left part are Kendall tau-b. The number of observations change for each couple, as not all students have, for instance, wrong answers
In both cases and significantly for both the statistical tests:
1. The score of QUIZ is, as could be expected, correlated at 99% with the score of CBM both in the first and in the second dataset according to both tests.
The score of QUIZ is positively and significantly correlated to GC, the variable which measures the ability to transform the correct answers into points and therefore an indicator.
2. Of awareness: the best students not only answer better to more questions, but also manage to better exploit their answers, which happens as the worst ones are less confident in their answers. Tables 8 (dataset 1) and 9 (dataset 2) show that the best ones use the level ‘high’ more often; the correlation between the score of QUIZ and the number of ‘high’ is significant (at 99% with both tests for dataset 2, at 90% and 95% for dataset 1) and positive. For the second dataset the correlation between the score and the number of ‘low’ is significant (95%) and negative: the best ones use ‘low’ less often, as shown in Table 9. Instead, there are no differences in points lost for wrong answers (LW) as shown in Table 7 for both the first and the second dataset (therefore the worst students, who make more mistakes, do not lose, in proportion, more points for that reason). These results seem to show not only that students who answer correctly have a good predictive ability as for instance in Grimes (2002), Nowell and Alston (2007) and Kennedy et al (2002), but also that students who do not, also have a good predictive ability and therefore they do not show overconfidence (as suggested for instance by the results of Clayson 2005).
| Table 8 Correlation between the Midterm Score and the Number of Confidence Levels Declared – Dataset 1 |
|||||
| Dataset 1 | Midterm score QUIZ | Number of high | Number of low | Number of intermediate | |
| Midterm score QUIZ | Correlation di Pearson | 0.179* | -0.200** 88 |
-0.072 88 |
|
| N | 88 | ||||
| Midterm score QUIZ | Kendall Tau b | 0.153** | -0.029 88 |
-0.093 88 |
|
| N | 88 | ||||
| Table 9 Correlation between the Midterm Score and the Number of Confidence Levels Declared – Dataset 2 |
|||||
| Dataset 2 | Midterm score QUIZ | Number of high | Number of low | Number of intermediate | |
| Midterm score QUIZ | Correlation di Pearson | 0.386*** | -0.251** 67 |
0.085 67 |
|
| N | 67 | 67 | |||
| Midterm score QUIZ | Kendall Tau b | 0.305*** | -0.215** 67 |
0.105 67 |
|
| N | 67 | ||||
3. The score of QUIZ is negatively and significantly correlated to CAL, the indicator of the general inability to calibrate the answers, in both datasets with both tests. Moreover, the score of QUIZ is never correlated to the indicator of confidence (CONF). This result seems to confirm on one hand that all students have a good ability of prediction, while on the other it suggests that worst students are not overconfident.
Therefore, we can conclude that there is not such a clear-cut relation between cognitive abilities and overconfidence; while it is true that good students predict well their own abilities, it is not true that less able students do not predict correctly their own results (they know that they do not know).
Conclusion
In the literature metacognition is related to predictive abilities. Our data do not support this conclusion: good students have good predictive abilities, but worst students have them too. This result is found in a framework in which (1) a question-by-question evaluation is used in order to test overconfidence and (2) an incentive is introduced to better predict one’s own ability.
Our results seem to suggest that a wider consideration and careful analysis of the theme of overconfidence and further research on the topic would be of great interest, for example by using (same or different) classes of students in different subjects and different instructors.
This work can also stimulate a further and wider debate on possible implications on the way in which overconfidence could be reduced: for instance, the way in which the question is asked may change evaluation; and appropriate ways of constructing exercises might help to reduce overconfidence.
Endnotes
1. http://www.youtube.com/playlist?list=PL85708E6EA236E3DB (last update, March 2015)
2. see for instance https://www.psychologicalscience.org/observer/improving-classroom-performance-by-challenging-student-misconceptions-about-learning (last access, October 2017)
3. Different contributions to the literature on overconfidence study how overconfidence and its level also depends on different cultural, demographic and socio-economic factors, like country, age group, ethnic group, gender and so on (see for instance Acker and Duck, 2008; Whitesell et al., 2009; Bengtsson et al., 2005; Bashir et al., 2013; Meisel et al., 2015).
4. According to Grimes (2002) “metacognition involves the abilities to appraise and manage the internal aspects of learning” (page 16).
5. The term chunk is first to be found in Miller (1956).
6. In the Italian system 18 corresponds to a pass and 30 to the highest score.
7. As noted above the literature on overconfidence outlines the possible differences due to cultural, demographic and socio-economic factors, which could limit the generalization of results in small samples. However, despite our sample is small, it is homogeneous relatively to age, educational level, ethnic group and nationality (all students are Italian) and gender (students in the sample are equally split in female and male subjects).
8. The points in the table have to be considered in relation to the score given to the question. Let’s imagine that a question gives one point. That whole point is gained with a very confident correct answer. Therefore the six points of penalty become, for instance, two points less on the total score of the quiz.
9. Note that each of the six questions is randomly taken from a set of 10 questions, so that the set of six questions is different for each student. An example of the two sets of questions is given in the Appendix.
10. See for example the literature on overconfidence and entrepreneurial activity (Camerer and Lovallo, 1999).
11. The effect of knowing the score of the main quiz might after all be twofold: on one hand students have a reference for evaluation and this should lead the good ones to be more confident; on the other hand those who have scored a higher score in the main test have less interest to take risk.
12. We have considered as ‘best students’ the ones who got a score higher than the median one.
13. However being good and not losing points for wrong answers are two different things.
14. Other versions of the same indicator with different weights lead to similar results.
15. In this case to the versions of the same indicator with different weights lead to similar results.
16. Another indirect indicator of self-evaluation ability was calculated using the number of questions the students left unanswered in QUIZ where, in case of mistake, students had a penalty equal to 0.25, to disincentive random answers when the solution was not known. This indicator is not included in the tables as it did not lead to any significant result.
Appendix
Examples of the Quiz and CBM Questions
A lottery has a minimum price equal to 8 and an expected value equal to 16. In order to participate you have to pay 10. Choose the right answer:
(a) It is a fair lottery because its cost is higher than the minimum prize
(b) It is not a fair lottery because its expected value is higher than its cost
(c) It is a fair lottery because its expected value is higher than its cost
If the marginal revenue of a firm is equal to 5, the average cost is equal to 7 and there are no fixed costs
(a) For the firm it is convenient not to produce
(b) For the firm it is convenient to produce in order to cover at least partially the fixed costs
(c) There are no sufficient data to answer
When the returns of a production factor decrease, the average cost of production:
(a) Does not change
(b) Increases
(c) Decreases
According to standard theory of production in economics, when quantity produced increases:
(a) The average costs of a firm start increasing and then decrease
(b) The average costs of a firm are fixed
(c) The average costs of a firm start decreasing then increase
References
- Acker, D. & Duck, N.W. (2008).Cross-cultural overconfidence and biased self-attribution. Journal of Socio-Economics, 37(5), 1815-1824.
- Ambrose, S.A., Bridges, M.W., DiPietro, M., Lovett, M.C. & Norman, M.K. (2010). How learning works? Research-Based principles for smart teaching. Jossey Bass, San Francisco.
- Bashir, T., Fazal, S., Shabeer, I., Aslam, W. & Jelani, G. (2013). Impact of demographics and personality traits on confidence level: Determinants of overconfidence (Evidence from employees and students). IOSR Journal of Business and Management, 10(1), 58-67.
- Bengtsson, C., Persson, M. & Willenhag, P. (2005). Gender and overconfidence. Economics Letters, 86(2), 199-203.
- Camerer, C. & Lovallo, D. (1999). Overconfidence and excess entry an experimental approach. American Economic Review, 89(1), 306-318.
- Castellani, M., Di Giovinazzo, V. & Novarese, M. (2010).Procedural rationality & happiness. Journal of Socio Economics, 39(3), 376-383.
- Chew, S.L. (2011). http://www.youtube.com/playlist?list=PL85708E6EA236E3DB (last update, March 2015).
- Chew, S.L. (2012). Making students more effective learners by challenging their Misconceptions about learning. Seminar Presentation.
- Clayson, D.E. (2005). Performance overconfidence: metacognitive effects or misplaced student expectations? Journal of Marketing Education, 27(2), 122-129.
- Gigerenzer, G. (1991). How to make cognitive illusions disappear: Beyond "heuristics and biases" in Stroebe, W. & Hewstone, M. (Eds.). European Review of Social Psychology, 2, 83-115. Chichester, England: Wiley.
- Grimes, P.W. (2002). The overconfident principles of economics student: An examination of a metacognitive skill. Journal of Economic Education, 33 (1), 15-30.
- Grimes, P.W., Millea, M.J. & Woodruff, T.W. (2004). Grades – Who’s to blame? Student evaluation of teaching and locus of control. Journal of Economic Education, 35(2), 129-147.
- Johnson, A., Smyers, J. & Purvis, R. (2012). Improving exam performance by metacognitive strategies. Psychology Learning & Teaching, 11(1), 180-185.
- Kennedy, E.J., Lawton, L. & Plumlee, E.L. (2002). Blissful Ignorance: The problem of unrecognized incompetence and academic performance. Journal of Marketing Education, 77(6), 1121-1134.
- Koriat, A., Lichtenstein, S. & Fishhoff, B. (1980). Reasons for confidence. Journal of Experimental Psychology, 6, 107-118.
- Meisel, M.K., Ning, H., Campbell, W.K. & Goodle, A.S. (2015). Narcissism, overconfidence and risk taking in U.S. and Chinese student samples. Journal of Cross-Cultural Psychology, 47(3), 385-400.
- Miller, G.A. (1956). The magical number seven, plus or minus two: Some limits on our capacity to processing information. Psychological Review, 63(2), 81-97.
- Novarese, M. (2009). Past success and present overconfidence. Mimeo, http://mpra.ub.uni-muenchen.de/13754.
- Nowell, C. & Alston, R.M. (2007). I thought I got an A! Overconfidence across the economics curriculum. Journal of Economic Education, 131-142.
- Ochse, C. (2001). Are positive self-perceptions and optimistic expectations really beneficial in an academic context? Progressio, 23(2), 52-60.
- Russo, J.E. & Schoemaker, P.J.H. (1992). Managing overconfidence. Sloan Management Review, 7-17.
- Whitesell, N.R., Mitchell, C.M. & Spicer, P. (2009). A longitudinal study of self-esteem, cultural identity and academic success among American Indian adolescents. Cultural Diversity and Ethnic Minority Psychology, 15(1), 38-50.
- Willingham, D.T. (2009).Why don't students like school:A cognitive scientist answers questions about how the mind works and what it means for the classroom. Jossey-Bass, San Francisco, 1 edn.