Research Article: 2019 Vol: 20 Issue: 1
Childhood and Adulthood Skill Acquisition - Importance for Labor Market Outcomes
Kenneth Lykke Sørensen, Aarhus University
Karl Fritjof Krassel, VIVE-The Danish Centre of Applied Social Science
Abstract
Using Danish matched PISA and PIAAC data; the study investigates the return to cognitive and non-cognitive skills to labor market outcomes. It measured skills at childhood and adulthood after entering the labor market. Hence, both whether cognitive and/or non-cognitive skills relate to earnings and employment rate were measured as well as how important the timing of acquiring skills was for outcomes on the labor market. Overall it was found that cognitive skills are important for both earnings and the employment rate but that the timing of the acquisition of the skills is of less importance. On the contrary, non-cognitive skills are important for earnings independent on whether the worker had high or low cognitive skills at childhood, but only important for the employment rate for workers with high cognitive and low non-cognitive childhood skills. Overall findings suggested that both cognitive and non-cognitive skills are important but that the dynamics differ.
Keywords
Cognitive Skills, Non-Cognitive Skills, Earnings, Employment, PIAAC, PISA.
JEL
I20, J21, J24
Introduction
A robust finding of the labor market literature is that earnings or wages correlate well with observed human capital measured by educational attainment, experience accumulation, and tenure (the seminal works of Mincer, 1958; Becker, 1962; Ben-Porath, 1967). However, observable workers’ characteristics are only able to explain 30-40% of the variation in earnings or wages (Mortensen, 2005). Expanding wage regressions with worker and firm fixed effects normally emphasize the importance of unobserved worker heterogeneity in explaining wages (Abowd et al. (2004); Gruetter & Lalive (2009); Barth & Dale-Olsen, (2003); Sørensen & Vejlin (forthcoming)). The fixed effects approach thus contributes to explaining the variance of wages on a general level, but the interpretation of worker fixed effects is difficult as it is a composition of everything that is fixed for the worker (education, unobservable skills, intelligence, etc.). In order to understand the formation of labor market achievement contingent on individual skills data sources is required with deeper information than those normally available in labor market registers. This paper combines test scores from childhood at age 15 with scores after entering the labor market at age 27 and labor market registers to extract cognitive and non-cognitive skills and relates these to labor market outcomes.
In the literature it is often argued that cognitive skills contribute more than non-cognitive to the explanation of the formation of earnings (Herrnstein & Murray, 1994) while others find non-cognitive skills to play at least as big a role as cognitive skills in the formation of labor market outcomes (Heckman et al., 2006). In the recent years, another expanding literature has emerged which analyzes the formation of cognitive and non-cognitive skills and their subsequent influence on labor market outcomes (Cunha & Heckman, 2007; Cunha & Heckman, 2008; Heckman et al., 2006). However, it still remains an open question whether cognitive skills dominate non-cognitive skills in the formation of labor market outcomes or if it is the other way around. Lately, there have been studies trying to close this gap (Mueller & Plug, 2006; Lindqvist & Vestman, 2011; Gensowski, 2014).
This paper expands the literature by investigating the relation between cognitive/non-cognitive skills and labor market outcomes using a unique data set. Both cognitive/non-cognitive skills are measured at childhood and after entering the labor market. This strategy enables us to split up the relationship between labor market outcomes and contemporary skills contingent on cognitive and non-cognitive skills at childhood - i.e. before entering the labor market. In this way both cognitive and/or non-cognitive skills can be measured related to earnings and employment rate as well as how important the timing of skill acquisition is. The study is, hence, able to address the question of skill formation through dynamic complementary raised by Cunha & Heckman, 2007.
The post labor market entry cognitive and non-cognitive skills are derived from the Programmed for the International Assessment of Adult Competencies (PIAAC). Labor market outcomes are recorded from administrative registers, measured by earnings and a dummy for whether the worker has been employed for at least five weeks during the year. Our sample consists of workers who have participated in both PIAAC in 2011/2012 and OECD’s programmed for International Student Assessment (PISA) in 2000. Thus, not only cognitive and non-cognitive skill of sample in 2011/2012 is measured, but the study also conditions on childhood cognitive and non-cognitive skills in 2000. This particular feature delivers a unique opportunity to estimate returns to cognitive and non-cognitive skills on the labor market outcomes conditional on childhood cognitive and non-cognitive skills. Two challenges arise when evaluating the return to cognitive and non-cognitive skills. First, a definition of and distinction between cognitive and non-cognitive skills is desirable. As discussed by Borghanse et al., 2008, the economic literature tends to equate non-cognitive skills with personality traits and juxtapose cognitive and non-cognitive skills. Borghans et al., 2008 point out that, despite of the intuitive appeal, the definition and distinction can potentially be confusing as “few aspects of human behavior are devoid of cognition”. This overlap is recognized and provides detailed descriptions of the measures of both cognitive and non-cognitive skills and relates them to measures used in the existing literature. Second, cognitive and non- cognitive skills are latent variables and hence not observed by the econometrician. The literature has handled this by using directly observable proxy variables or by eliciting measures of the latent variables.1 This study follows the latter measuring cognitive skills are followed by using estimates of workers’ reading ability (measured both at childhood and adulthood). Our measures of non-cognitive skills are formed using exploratory factor analysis. The non-cognitive skills measured at childhood relate to the workers perseverance while the latter measure is capturing how much the worker enjoys learning.
To the best of our knowledge, this paper is the first to combine PISA scores from childhood with PIAAC scores from the early stages of a worker’s working life and adding register based labor market outcomes. Doing so, the important relations between cognitive and non-cognitive skills at childhood is extracted; we investigate how they affect cognitive and non-cognitive skills, and study their implications for labor market outcomes. It is observed that the combination of cognitive and non-cognitive skills is important for the formation of labor market outcomes. Specifically, the study shows that while cognitive skills are important for earnings the timing of the acquisition of those cognitive skills might be less so. The rest of the paper is organized as follows: Section 2 presents the data and our measures of cognitive and non-cognitive skills while Section 3 provides descriptive statistics. Our estimation strategy is presented in Section 4 while estimation results are presented in Section 5. Finally, Section 6 concludes.
Data
This paper uses combined survey data and register data from Denmark. The survey data consists of data from the Organization for Economic Co-operation and Development’s (OECD) Programme for International Student Assessment (PISA) from 2000 (OECD, 2001; Andersen et al., 2001) combined with data from the OECD Programme for the International Assessment of Adult Competencies (PIAAC) from 2011/2012 (OECD, 2013a; Rosdahl et al., 2013). The PIAAC sample is a sub-sample of the PISA sample and the interviews took place from November 2011 to April 2012. The contents of the two surveys differed and hence, only comparable but not identical measures across the waves are constructed. Using unique person identifiers, the survey data with register data is matched from Statistics Denmark using the Integrated Database for Labor market research (IDA).2
Register Data
It might be suspected, that if the labor market outcomes get regressed solely on cognitive and non-cognitive skills it would end up allocating more explanatory power to them than what could actually be observed. If e.g. workers with high non-cognitive skills are also more prone to have a qualifying education, then the estimated return to non-cognitive skills might be upward biased if it does not get controlled for having a qualifying education. Therefore the survey data is merged with IDA.
IDA is a matched employer-employee longitudinal administrative database containing socio-economic information on the entire Danish population, the population’s attachment to the labor market, and at which firms the worker is employed. Both workers and firms are registered from 1980 onwards. The reference period in IDA is given as follows; the linkage of workers and firms refers to the end of November, ensuring that seasonal changes (e.g. shutdown of establishments around Christmas) do not affect the registration, meaning that the creation of jobs in the individual firms refers to the end of November. Since the PIAAC data are collected primo 2012 and the register data are recorded ultimo 2012, the timing between explanatory variables and outcomes is not a concern. The data are confidential but our access is not exclusive. Following the literature on earnings and employment rate the information of a personal character included the gender of the worker, and whether he or she is cohabiting with a partner or not, educational attainment (measured by having completed a qualifying education or not-defined as having completed a vocational degree, a bachelor degree or above) and lastly labor market experience, defined by the years of actual employment.
Trimming the Sample
Since labor market outcomes is to be measured the entire sample cannot be used that participated in both PISA and PIAAC as some of these will still be in the educational system in 2012 and thus have not yet entered the labor market. However, to avoid biasing factors, measures of cognitive and non-cognitive skills on the full population are estimated i.e. they are estimated before the workers get excluded who are still in the education system at the time of labor market measure. In this way it is ensured that if e.g. all the highly skilled readers are excluded from the sample, then it will not be manually assigning the low skilled readers as highly skilled readers. After estimating the latent factors all that have not yet entered the labor market in 2012 (591 individuals) get excluded. Due to lack of PISA cognitive and non-cognitive skills for 2 and 76 individuals respectively, these have also been excluded. Moreover the sample is trimmed by excluding 2 workers for whom a non-cognitive measure from the PIAAC survey is not observed. Table 1 shows the process of trimming the sample, leading to a final sample size of 1,210 workers of which 92 workers have zero earnings.
| Table 1 Overview Of The Sample Selection |
||
| Corrections | Observations excluded/not used | Sample size |
| Joint PISA/PIAAC sample | 1,881 | |
| Have not yet entered the labor market | 591 | 1,290 |
| No measure of cognitive skills in PISA | 2 | 1,288 |
| No measure of non-cognitive skills in PISA | 76 | 1,212 |
| No measure of non-cognitive skills in PIAAC | 2 | 1,210 |
| Outcomes | ||
| Employment status not observed | 0 | 1,210 |
| Earnings equal to zero | 92 | 1,118 |
| Final analysis sample | 1,210 | |
I.e. when estimating the employment rate, the sample consists of 1,210 workers and when estimating earnings, due to the log transformation, the sample is restricted to 1,118 workers.
Cognitive Skills
As Humlum et al., 2012 cognitive skills are measured by using PISA and PIAAC test scores in reading. Both surveys measure literacy and as discussed in Rosdahl (2014), the definitions of literacy are similar in PISA and PIAAC. In both surveys literacy relates to being able to read and understand texts with the purpose of being able to participate in everyday life develop knowledge and understanding and achieve personal goals (Rosdahl, 2014). OECD (2013b) also finds that the definitions are highly comparable and that the measurements rely on the same concepts and methods. The main difference between the two measures relates to the age differences in the two populations. Another apparent difference between the two measures is the scales. PISA measures literacy on a scale from 0 to 1,000 while PIAAC uses a scale from 0 to 500. However, the difference has no practical importance as the measures are standardized.
The PISA and PIAAC reading scores are provided in the data as plausible values. In addition, the PISA reading score is also provided as a mean Weighted Likelihood Estimate (WLE). As the PISA reading score is only used to divide the sample above and below the median, WLE is relied. The reason for providing plausible values and not a single variable is that reading proficiency is measured with uncertainty at the individual level. The plausible values take this individual level uncertainty into account and are draws from a latent skill distribution for each observation (Wu, 2005). Estimation using variables provided as plausible values in the control set requires non-standard software. REPEST package is used provided by the OECD for Stata (Avvisati & Keslair, 2015).
Non-cognitive Skills
The measures of non-cognitive skills are derived using data collected along with the PISA and PIAAC literacy tests. In PISA the respondents answered a Student Questionnaire and a Cross-Curricular Competencies Questionnaire (CCCQ) while the respondents answered a Background Questionnaire (BQ) in PIAAC. The explorative factor analyses are conducted on the data from the CCCQ and the BQ.
Table A1 (Appendix) presents the 28 items from the CCCQ question battery one. All items are questions on the form “How often do these things apply to you?” with the response categories “totally disagree, partly disagree, both/and, partly agree and totally agree.” Table A2 (Appendix) presents the number of observations and Cronbach’s α overall and whether each item is left out one at a time. In addition, the table presents the results of an initial explorative factor analysis. The factor analysis is carried out following the method described by Truxillo, 2005. In short, the method utilizes information from all observations despite potential missing data. Notice, the factor analyses is conducted by using the full PISA-PIAAC sample.
Three factors satisfy the Kaiser criterion of an eigenvalue larger than one and are thus retained. To avoid cross loading across items, the factor analysis is carried out again including only items with rotated factor loadings higher than 0.5 and cross loadings below 0.3. The results of these subsequent factor analyzes are presented in Table A3 (Appendix). The wordings of the items comprised by each factor give inspiration to naming the factors. Hence, the factors are named self-confidence, perseverance and future orientation, respectively.
The goal of forming measures of non-cognitive skills using the associated survey data is to obtain measures predicting labor market outcomes. Psychology has a long tradition of using personality traits models to capture information on non-cognitive skills. An example of such a personality trait model is the five-factor model also denoted the “Big Five” model (Digman, 1990).3 A widely used version of the five-factor model is the Revised NEO Personality Inventory (NEO-PI-R) describing personality using the traits/factors openness to experience, conscientiousness, extraversion, agreeableness, and neuroticism (Costa & McCrae, 1992). The personality traits are broken down into facets and the facets of e.g. conscientiousness (using the NEO-PI-R) are competence, order, dutifulness, achievement striving, self-discipline and deliberation. As pointed out by MacCann et al., 2009, “conscientiousness has been linked to a myriad of positive outcomes” but also that different versions of the five-factor model define conscientiousness differently. Using conscientiousness items from different models MacCann et al., 2009 uncovers eight facets of conscientiousness including facet denoted perseverance.
The PISA-based measures of non-cognitive skills do not have a direct correspondence with traits or facets from the five-factor model. Nevertheless, the measure of perseverance is thought as in relation with, or in family to, conscientiousness. Since only PISA measure is used to divide out sample, for simplicity, the factors denoted self-confidence and future orientations is disregarded and focus solely on perseverance.
The PIAAC survey includes a Background Questionnaire in which the respondents are, among other things, asked about their attitudes towards new ideas and learning new things. The items are presented in Table B1 (Appendix) and as before an exploratory factor analysis is conducted to condense the data into fewer variables. The results are presented in Table B2 (Appendix). Cronbach’s α suggests keeping all items and the factor analysis results in one factor satisfying the Kaizer criterion. Given the wording of the items, the retained factor is named “enjoy learning.”
The PIAAC-based measure of non-cognitive skills thought to be related to the personality trait named Typical Intellectual Engagement (TIE). Cognitive skills are typically based on a measure of maximum intellectual engagement. An example is IQ tests but also our measures of cognitive skills based on the PISA and PIACC reading scores are measures of maximum intellectual engagement. Goff & Ackerman, 1992 suggest a distinction between maximum intellectual engagement and typical intellectual engagement. The distinction is motivated by a long-lasting effort in psychology to understand the link between personality and intelligence. An example is Johnson et al. (1983) trying to link 27 personality scales to different WAIS-measures (Wechsler Adult Intelligence Scale). Goff and Ackerman (1992) argue that typical intellectual engagement gives a clearer under- standing of the personality-intelligence link. In relation to the five-factor model, TIE is linked to openness to experience.
Table 2 displays the measures of cognitive and non-cognitive skills derived from the two OECD surveys. Whereas the measures of cognitive skills are comparable, the measures of non-cognitive skills are more diverse. The PISA and PIAAC surveys do not include the same batteries of questions and hence, the present measures are, on one hand, the art of the possible.
| Table 2 Measures Of Cognitive And Non-Cognitive Skills |
||
| Survey | Type of factor | Name |
| PISA | Non-cognitive Cognitive |
Perseverance Reading score (PISA) |
| PIAAC | Non-cognitive Cognitive |
Enjoy learning Reading score (PIAAC) |
As discussed above, a measure from PISA comparable to conscientiousness from the five-factor model is obtained while a measure from PIAAC is obtained comparable to openness (again from the five-factor model) and TIE. On the other hand findings in psychology suggest that all three measures are good predictors of academic performance (Premuzic et al., 2006; Von et al., 2011).
Von et al., 2011 go as far as denoting intellectual curiosity the third pillar of academic performance with intelligence and conscientiousness/effort as the first two. Hence, it is observed that the measures are highly relevant with respect to predicting labor market outcomes for young adults.
Worker Types
Figure 1 depicts four types of workers that are split our sample into. Type 1 workers are those who scored below the median in both the cognitive and non-cognitive dimensions i.e. they are characterized by having relatively low reading skills and low perseverance. Economic theory would predict type 1 workers to fare worse than other types in terms of earnings and maybe also employment rate. Type 4 workers, on the other hand-those with above median skills in both dimensions-are expected to excel at the labor market compared to the other types. Economic theory would, however, have difficulties at specifying an unambiguous expectation towards workers of Types 2 and 3. It is therefore interesting to investigate whether workers with low cognitive but high non-cognitive skills do better than workers with high cognitive and low non-cognitive skills on the labor market.
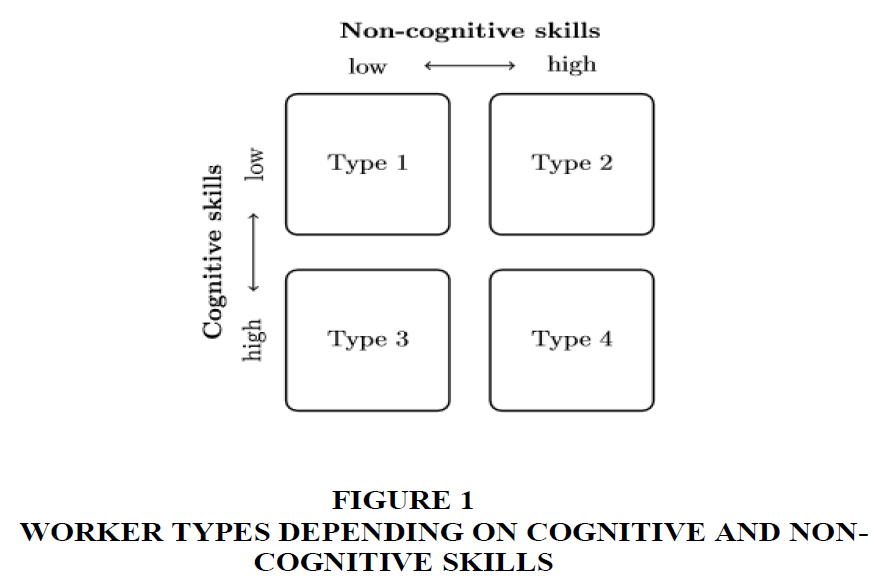
Figure 1: Worker Types Depending On Cognitive And Non-Cognitive
By applying the classification of worker types to skills acquired at childhood and also after labor market entry important knowledge is gained. Not only can the importance of cognitive versus non-cognitive skills get characterized but can also analyse the importance of the timing of acquisition of skills. The worker type framework deployed with respect to the skills measured in PISA can also be used with respect to skills measured in PIAAC. Again Type 1 refers to an observation with low cognitive and non-cognitive skills while Type 2 refers to a person with low cognitive skill and high non-cognitive skills etc. If childhood skills perfectly identify adulthood skills-i.e. if it observes complete persistence in PISA/PIAAC types-then grouping worker types in the way it is done would be redundant. On the contrary, if there is no association between childhood types and adulthood types, then the concern would be that allocation to a worker type would be random. To test for this concern, Table 3 presents a cross-tabulation of the PISA and PIAAC types with Pearson’s χ2 test for independence.
| Table 3 Pisa And Piaac Worker Types |
|||||
| PISA | |||||
| Type 1 | Type 2 | Type 3 | Type 4 | ||
| PIAAC | Type 1 | 170 (6.87) |
135 (4.31) |
48 (-5.38) |
48 (-6.69) |
| Type 2 | 89 (0.43) |
112 (5.60) |
36 (-4.11) |
54 (-2.31) |
|
| Type 3 | 50 (-4.05) |
29 (-6.08) |
91 (6.40) |
88 (4.50) |
|
| Type 4 | 49 (-4.28) |
38 (-4.71) |
78 (4.07) |
95 (5.57) |
|
Notes: The PIAAC types are based on the average of the 10 possible values. P-value: 0.000 (Pearson’s χ2-test). Adjusted residuals are in brackets.
Illustrated by the adjusted residuals in brackets, the Table 3 shows evidence of clustering on the diagonal indicating persistence in types across the years rejecting randomness of allocation to childhood type.4 It is also observed that although there are too few off-diagonal entries in order for the type allocation to be random, there are still considerable mass in order to reject perfect dependence between childhood types and adulthood types.
Descriptives
Table 4 represent the summary statistics for the entire sample and for each of the four worker types. On average each worker earns 276,000 DKK during 2012 conditional on having positive earnings the average earnings become 299,000 DKK.5 Splitting this into each worker type, it was observed that Types 1 and 2 are comparable and Types 3 and 4 are comparable and earn more than Types 1 and 2. This suggests that childhood cognitive skills might be more important for labor market earnings than childhood non-cognitive skills. Table 4 also shows that this observation is reflected in only somewhat higher employment probabilities among Types 3 and 4 compared to Types 1 and 2, indicating that wages might be higher for those with higher childhood cognitive skills.6
| Table 4 Average Outcomes And Explanatory Variables |
|||||
| OUTCOMES | |||||
| Earnings | 276,213 (144,949) |
256,714 (-149,865) |
258,219 (-142,602) |
300,651 (-143,086) |
298,836 (-136,919) |
| Earnings (earnings>0) | 298,942 (-126,253) |
285,415 (-129,465) |
282,511 (-123,968) |
319,599 (-125,252) |
314,274 (-121,857) |
| Employment rate | 0.849 (-) | 0.83 (-) | 0.822 (-) | 0.87 (-) | 0.884 (-) |
| EXPLANATORY VARIABLES | |||||
| PIAAC based | |||||
| Cognitive skills | -0.151 (-0.969) |
-0.487 (-0.927) |
-0.547 (-0.9) |
0.323 (-0.802) |
0.317 (-0.837) |
| Non-cognitive skills | -0.106 (-1.001) |
-0.26 (-1.067) |
-0.104 (-1.063) |
-0.121 (-0.899) |
0.1 (-0.894) |
| PISA based | |||||
| Cognitive skills | -0.103 (-0.955) |
-0.731 -0.693 |
-0.789 -0.667 |
0.744 -0.548 |
0.69 -0.488 |
| Non-cognitive skills | 0.005 -0.987 |
-0.782 -0.514 |
0.805 -0.608 |
-0.806 -0.518 |
0.835 -0.633 |
| Register based | |||||
| Woman | 0.502 (-) | 0.408 (-) | 0.475 (-) | 0.553 (-) | 0.604 (-) |
| Cohabiting | 0.616 (-) | 0.595 (-) | 0.624 (-) | 0.625 (-) | 0.625 (-) |
| Experience | 5.119 (2.856) |
6.040 (2.852) |
5.657 (2.843) |
4.110 (2.657) |
4.264 (2.510) |
| Qualifying education | 0.828 (-) | 0.796 (-) | 0.803 (-) | 0.854 (-) | 0.874 (-) |
| N | 1,210 | 358 | 314 | 253 | 285 |
Notes: Earnings are in units of 1,000 DKK. Employment rate is a dummy for being employed for at least five weeks during 2012. Numbers in parentheses denote standard deviations (left out for dummy variables).
Furthermore, it is seen that workers of Types 3 and 4 are more likely to be female with less work experience but higher probability of having a qualifying education compared to workers of Types 1 and 2.
Figure 2 shows average earnings and employment rate during 2012 for combined quintiles of PIAAC cognitive and non-cognitive skills. There is a positive relationship between the combination of high levels of cognitive and non-cognitive skills and earnings during 2012.
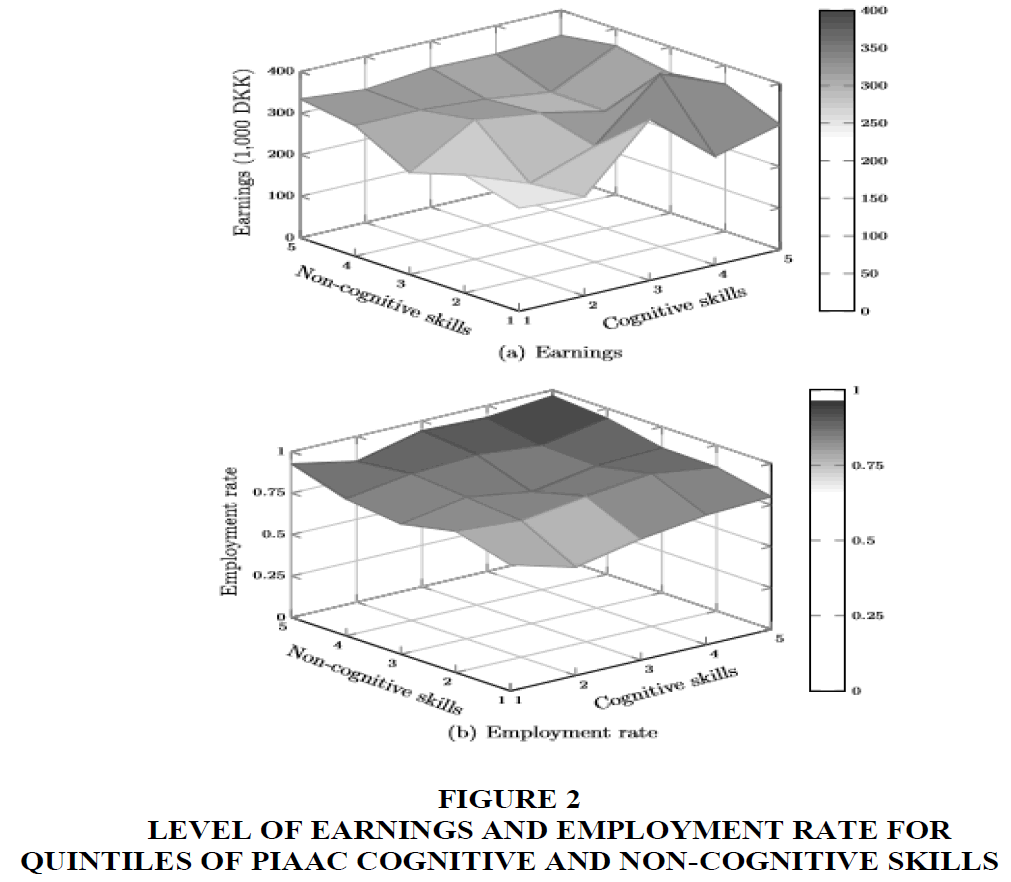
Figure 2: Level Of Earnings And Employment Rate For Quintiles Of Piaac Cognitive And Non-Cognitive Skills
Overall, the surface shape is slightly steeper in cognitive skills than it is in non-cognitive skills, although workers in the fifth quintile of the non-cognitive skills distribution seem to have the highest average earnings in total. Splitting the sample into the four worker types reveals that the average earnings differences from Table 4 go through the entire distribution of cognitive and non-cognitive skills for all worker types. Similar pattern was observed, only slightly steeper, for the employment rate where it is the combination of high cognitive and non-cognitive skills that follows higher average employment rates.
Model And Estimation
Consistent with the literature on the return to cognitive and non-cognitive skills on labor market outcomes, the model shows labor market outcomes as a function of cognitive skills (measured by the reading skills), non-cognitive skills (measured by how much the individual enjoys learning), and human capital.
Baseline model therefore becomes:


With, wi being log labor market earnings and yi a dummy for being employed for individual i. I.e., the log earnings is modeled by using OLS and employment with a logistic regression. xi is a vector of individual characteristics (gender, cohabitation, labor market experience, and education). The parameters of interest in this paper are δReading and δEnjoy learning that delivers returns to cognitive and non-cognitive skills measured after entering the labor market on our outcomes. In robustness analyses, it also includes squared versions of skills and an interaction term. This first estimate the direct impacts of reading and enjoy learning on our outcomes for our full sample and then for each worker type separately.
Results
This section presents the results on how cognitive and non-cognitive skills after labor market entry and at childhood affect labor market outcomes as a young worker. Log earnings are used as outcome in Earnings while employment rate is used as outcome in Employment rate.
Earnings
The first labor market outcome considered is log earnings and our estimation results are provided in Table 5. Columns 1 and 2 present the estimates of the return to cognitive and non-cognitive skills without and with controls, respectively. It is observed that the return to both cognitive and non-cognitive skills is significantly positive and even increases when adding the controls. The formation of cognitive and non-cognitive skills is likely to take place through a process where the two affect each other through dynamic complementarities. If cognitive skills are affected by non-cognitive skills, then the estimate of the return to cognitive skills in an estimation including non-cognitive skills might be misleading. To assess the bounds of the estimates to cognitive and non-cognitive skills, Columns 3 and 4 present the results with only one skill measure at the time. Comparing Columns 1 with 3 and 4 thus reveals upper bounds on the return to cognitive and non-cognitive skills, respectively. The differences between the point estimates in Column 1 are not statistically significantly different from the upper bounds found in Columns 3 and 4 so the measures are not suspected to be affected too much by each other. In Column 5 results are presented where squared skills have been added together with an interaction term allowing for a more flexible relationship between cognitive and non-cognitive skills and log earnings. As would be expected, the overall return to both cognitive and non-cognitive skills is concave on their supports reaching the maximum values at the upper end and at the value 1 for cognitive and non-cognitive skills, respectively.
| Table 5 Estimated Effect Of Cognitive And Non-Cognitive Skills On Log Earnings |
|||||
| -1 | -2 | -3 | -4 | -5 | |
| Cognitive skills (Reading) | 0.108*** (0.025) |
0.135*** (0.024) |
0.124*** (0.024) |
0.118*** (0.026) |
|
| Non-cognitive skills (Enjoys learning) | 0.105*** (0.026) |
0.115*** (0.025) |
0.121*** (0.026) |
0.082*** (0.02) |
|
| Cognitive skills sq. | -0.012 (0.023) |
||||
| Non-cognitive skills sq. | -0.033 (0.032) |
||||
| Cognitive×Non-cognitive | -0.053* (0.031) |
||||
| Constant | 5.557*** -0.02 |
4.875*** -0.131 |
5.549*** -0.02 |
5.547*** -0.02 |
4.946*** (0.149) |
| Controls | No | Yes | No | No | Yes |
| R2 | 0.046 | 0.141 | 0.026 | 0.026 | 0.153 |
| Observation | 1,118 | 1,118 | 1,118 | 1,118 | 1,118 |
Note: All regressions are estimated using ordinary least squares and dependent variable log earnings. The conditioning set used as controls consist of a dummy for being a woman, dummy for cohabitation, years of experience, years of experience squared and a dummy for having a qualifying education or not. ∗∗∗, ∗∗, ∗ indicates statistical significance at the 1%, 5%, and 10% level, respectively.
Since it is believed that cognitive and non-cognitive skills at childhood affect the return to cognitive and non-cognitive skills on labor market outcomes, estimates for each of the four worker types is shown in Table 6. It was observed in Table 4 that earnings on average were higher for workers of Types 3 and 4 (high childhood cognitive skills) than for workers of Types 1 and 2 (low childhood cognitive skills). Table 6 shows comparable estimates of the impact of adulthood non-cognitive skills on log earnings across worker types, but that adulthood cognitive skills are only significant for workers with low childhood cognitive skills. This result indicates that cognitive skills are important for earnings but the timing of the acquisition of those cognitive skills might be less important.
| Table 6 Estimated Effect Of Cognitive And Non-Cognitive Skills On Log Earnings For Each Worker Type |
||||
| Type1 | Type2 | Type3 | Type3 | |
| Cognitive skills (Reading | 0.088* (0.048) |
0.160** (0.069) |
0.069 (0.068) |
0.068 (0.066) |
| Non-cognitive skills (Enjoys learning | 0.098** (0.039) |
0.157** (0.073) |
0.073** (0.037) |
0.098* (0.058) |
| Constant | 4.957*** (0.263 |
4.947*** (0.304) |
4.996*** (0.179) |
4.406*** (0.291) |
| Controls | Yes | Yes | Yes | Yes |
| R2 | 0.157 | 0.133 | 0.144 | 0.229 |
| Observations | 322 | 287 | 238 | 271 |
Note: All regressions are estimated using ordinary least squares and dependent variable log earnings during 2012. The conditioning set used as controls consist of a dummy for being a woman, dummy for cohabitation, years of experience, years of experience squared and a dummy for having a qualifying education or not.
∗∗∗, ∗∗, ∗ indicates statistical significance at the 1%, 5%, and 10% level respectively.
Taking the estimates of the return to cognitive and non-cognitive skills at face value, this can be plotted conditional on the skill levels. Figure 3 shows the returns to cognitive and non-cognitive skills on earnings for each worker type. The support of skills for each worker type is cut below and above at 5% and all returns is normalized to pass through origo. Workers of type 1 (those with low levels of childhood cognitive and non-cognitive skills) follow a linear path with higher returns for higher skills (both cognitive and non-cognitive) i.e. for workers with low levels of childhood cognitive and non-cognitive skills, the acquisition of adulthood cognitive and/or non-cognitive skills comes with positive returns to earnings. Type 2 workers gain higher returns to earnings for low levels of both cognitive and non-cognitive skills, but have a diminishing path for high levels of cognitive and especially non-cognitive skills. This indicates that workers with low levels of cognitive and high levels of non-cognitive skills measured at childhood gain by acquiring cognitive and non-cognitive skills up to some threshold. Thus, there is an upper level of the return to skills. This level is more pronounced for adulthood non-cognitive skills than for adulthood cognitive skills, which comes natural, as this worker type is characterized by having low levels of childhood cognitive skills but high levels of non-cognitive skills. The opposite worker type, those of type 3 (i.e. high levels of cognitive skills and low levels of non-cognitive skills at childhood), has different return to earnings. Their return to adulthood cognitive skills is very limited while they follow a linear increasing path in the return to non-cognitive skills. As for worker type 2, this group exhibits that both cognitive and non-cognitive skills are important for adulthood earnings, but the timing of the acquisition seems to be of less importance. Finally, workers of type 4 have increasing returns to cognitive skills but a concave return to non-cognitive skills.
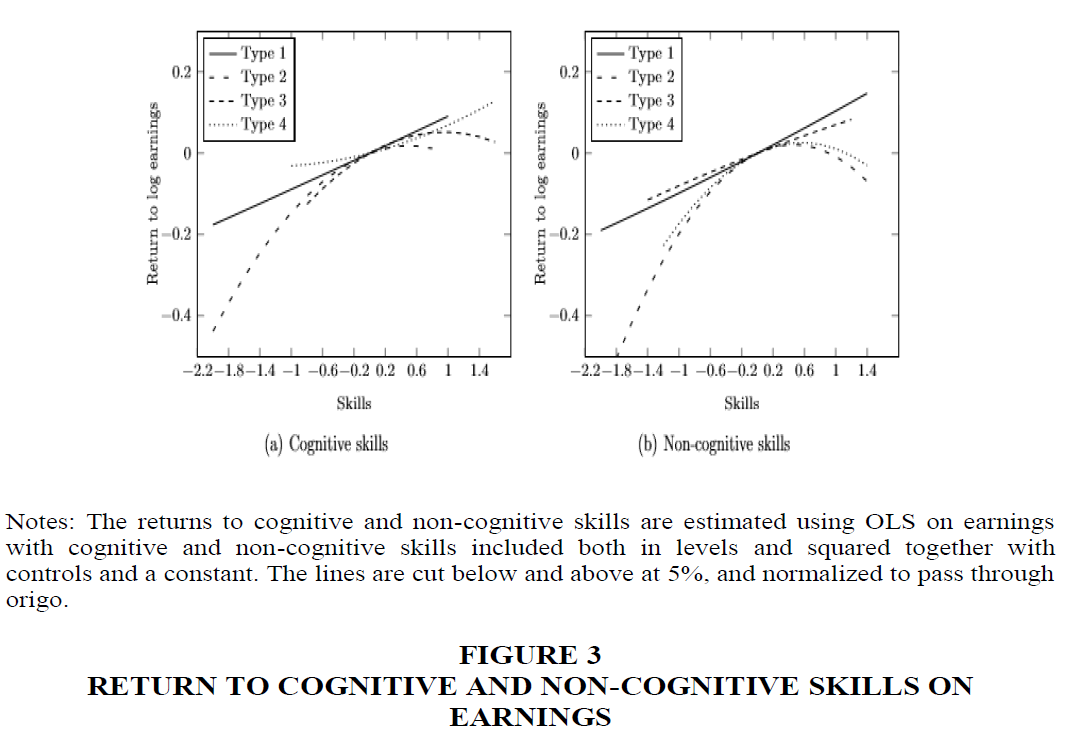
Figure 3: Return To Cognitive And Non-Cognitive Skills On Earnings
Employment Rate
Table 7 presents results from logit estimations with employment rate as the dependent variable. The parameter estimates are presented as exponentiated parameters and can hence be interpreted as odds ratios. As pointed out by Ai and Norton (2003), presenting marginal effects might be misleading for logit models if interaction terms are included, as the marginal effects of the interaction terms are not necessarily equal to the marginal interaction effects. Hence, the estimation results are presented as exponentiated coefficients. Note that the exponentiated parameter estimates for the interactions must be interpreted as multiplicative effects in relation to some baseline odds (Buis, 2010).
| Table 7 Estimated Effect Of Cognitive And Non-Cognitive Skills On Employment Rate |
|||||
| -1 | -2 | -3 | -4 | -5 | |
| Cognitive skills | 1.503*** (0.122) |
1.647*** (0.176) |
1.549*** (0.125) |
1.740*** (0.246) |
|
| Noncognitive skills | 1.238** (0.104) |
1.278*** (0.114) |
1.310*** (0.111) |
1.439*** (0.15) |
|
| Cognitive skills sq. | 1.008 (0.092) |
||||
| Noncognitive skills sq. | 1.066 (0.073) |
||||
| Cognitive×Non-cognitive | 1.131 (0.104) |
||||
| Baseline odds | 6.219*** (0.647) |
0.772 (0.224) |
6.003*** (0.598) |
5.598*** (0.514) |
0.724 (0.224) |
| Controls | No | Yes | No | No | Yes |
| Observations | 1,210 | 1,210 | 1,210 | 1,210 | 1,210 |
Notes: All regressions are estimated using logit regressions with dependent variable being the dummy of having more than five weeks of employment during 2012. Estimates are presented as exponentiated coefficients and can hence be interpreted as odds ratios. The conditioning set used as controls consist of a dummy for being a woman, dummy for cohabitation, years of experience, years of experience squared and a dummy for having a qualifying education or not. ∗∗∗, ∗∗, ∗ indicates statistical significance at the 1%, 5%, and 10% level, respectively
Column 1 included only the PIAAC-based measures of cognitive and non-cognitive skills in the control set along with a constant. All parameter estimates are significant at the 5% level. As the skill measures have been standardized, the baseline odds of 6.219 are the odds of being employed (vs. not being employed) for a person with average cognitive and non-cognitive skills. Moving e.g. one standard deviation in the distribution of cognitive skills changes the baseline odds by (moving down) 1.503−1 . 6.219=4.138 and (moving up) 1.5031 . 6.411 = 9.347. Hence, having cognitive skills one standard deviation above the average versus one standard deviation below the average increases the probability of being employed by a factor of 9.347/4.138 = 2.259.7
In column 2 the remaining control set is added among the cognitive and non-cognitive skill measures (parameter estimates not shown). The baseline odds drop as it is the baseline given all co-variants equal to zero. In the control set years of experience (both in level and squared) is included which is a strong predictor of employment. Having a qualifying education is also usually found to predict employment and hence, the drop is not surprising. More interesting is the stability of the estimates to cognitive and non-cognitive skills. This indicates that the skill measures capture elements not caught by the more traditional covariates. As both cognitive and non-cognitive skills have been standardized, the estimates show that the return to cognitive skills is higher than the return to non-cognitive skills in terms of employment probability.
As discussed regarding the return on earnings, the study also needs to assess the bounds of the estimates of the return to cognitive and non-cognitive skills. Column 3 and 4 thus present the results with only one skill measure at the time. In both columns the estimates are higher numerically (but not significantly different) than the estimates presented in column 1. Column 5 presents estimation results with squared skill measures and an interaction between the skill measures in levels. While the estimates to cognitive and non-cognitive skills in levels remain significant, the estimates to the squared skills measures and the interaction are insignificant.
Table 8 presents the employment rate estimations by worker type. As was the case regarding earnings, it is observed that workers of type 1 and 2 have statistically significant returns to cognitive skills while only workers of type 3 have statistically significant returns to non-cognitive skills. I.e. workers with low childhood cognitive skills gain in terms of a higher employment rate by acquiring cognitive skills in adulthood. Likewise, workers with high cognitive and low non-cognitive skills in childhood are the only group that gains employment by acquiring non-cognitive skills in adulthood. Comparing worker type 1 and 3 it is remarkable that type 1 does not benefit from non-cognitive skills like type 3. This indicates that cognitive skills are a prerequisite for positive returns to non-cognitive skills with respect to employment. For workers with high childhood cognitive and non-cognitive skills, worker type 4, there is no significant returns, neither adulthood cognitive nor non-cognitive skills. Employment is a dichotomous outcome, and hence it seems reasonable that cognitive and non-cognitive skills do not affect the already well-endowed workers. In comparison, return to cognitive skills with respect to earnings for worker type 4 was not capped as shown in Figure 3(a).
| Table 8 Estimated Effect Of Cognitive And Non-Cognitive Skills On Employment Rate For Each Worker Type |
||||
| Type 1 | Type 2 | Type 3 | Type 4 | |
| Cognitive skills | 1.706** (0.434) |
1.411* (0.263) |
1.252 (0.399) |
1.66 (0.597) |
| Non-cognitive skills | 1.156 (0.205) |
1.232 (0.225) |
1.918** (0.482) |
1.069 (0.197) |
| Baseline odds | 0.398 (0.227) |
0.754 (0.361) |
0.679 (0.522) |
1.451 (1.127) |
| Controls | Yes | Yes | Yes | Yes |
| Observations | 358 | 314 | 253 | 285 |
Notes: All regressions are estimated using logit and dependent variable the dummy of having more than 4 weeks of employment during 2012. Estimates are presented as exponentiated coefficients and can hence be interpreted as odds ratios. The conditioning set used as controls consist of a dummy for being a woman, dummy for cohabitation, years of experience, years of experience squared and a dummy for having a qualifying education or not. ∗∗∗, ∗∗, ∗ indicates statistical significance at the 1%, 5%, and 10% level respectively.
Table 8 shows the same overall pattern in employment rate which was done for earnings, that cognitive skills are important for labor market outcomes, but the timing of the acquisition of them is of minor importance. With respect to non-cognitive skills a somewhat different pattern is observed: Cognitive skills are a prerequisite for returns to non-cognitive skills and the returns to non-cognitive skills are not significant when the workers are already well-endowed.
Conclusion
Using combined PISA, PIAAC and register data from Denmark, the return to cognitive and non-cognitive skills is investigated with respect to labor market outcomes. The respondents were around age 15 and 27 in PISA and PIAAC, respectively, while the labor market outcomes were measured ultimo of the (last) year of the PIAAC survey. The cognitive skills are measured by reading scores available in both PISA and PIAAC while the construct measures of non-cognitive skills is done by using exploratory factor analyse. From PISA the associated Cross- Curricular Competencies Questionnaire is used while Background Questionnaire is used from PIAAC. The measures are the best available given the data and they resemble (facets) of conscientiousness and typical intellectual engagement both known from the psychology literature.
The study uses two register based outcomes: Log earnings and the employment rate. With respect to earnings it is found that the PIAAC-based cognitive and non-cognitive skills are equally important while cognitive skills are more important than non-cognitive skills with respect to employment. As the interest is in the formation of cognitive and non-cognitive skills and their subsequent influence on labor market outcomes, the four worker types was distinguished with each other. The worker types are given by the possible combinations of high/low cognitive and non-cognitive skills measured at childhood (i.e. in PISA). The by-type analyses suggest that the timing of the acquisition of cognitive skills is of less importance when it comes to earnings. With respect to employment it is overall found the same pattern. Cognitive skills are important for employment but the timing of the acquisition is of less importance. One difference seems to be that cognitive skills are a prerequisite for positive returns to non-cognitive skills, though.
Overall findings suggest that both cognitive and non-cognitive skills are important with respect to adulthood labor market outcomes. In addition, the results illustrate the complex nature of the relative importance of cognitive and non-cognitive skills and the acquisition hereof, as our results differ with the chosen outcome. Cognitive skills are a prerequisite for positive returns to adulthood non- cognitive skills when the outcome is employment while the timing of acquisition is of less importance when the outcome is earnings. In relation to the existing literature the results hence give support to the hypothesis of dynamic complementarities in skills but also suggest heterogeneous effects across outcomes.
Compliance With Ethical Standards
Funding: This study was funded by the Danish Council for Strategic Research (grant no. 09-070295) and the Danish Council for Independent Research | Social Sciences (grant no. FSE 4182-00281).
Conflict of Interest: The authors declare that they have no conflict of interest.
Endnotes
1. E.g. DellaVigna and Paserman (2005) use information on having a bank account as a measure of the non-cognitive skill patience.
2. Integrerede Database for Arbejdsmarkedsforskning in Danish. A description of the database can be found at www.dst.dk/da/Statistik/dokumentation/Times/ida-databasen.aspx.
3. The Big Five model has found its way into the economics literature. An example is Cobb-Clark and Tan (2011) using the Big Five to measure non-cognitive skills and predict occupational attainment.
4. Adjusted residuals are given by 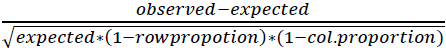
5. This corresponds roughly to 54,000 USD.
6. Earnings conditional on being employed are (in thousands) 285, 282, 319, and 314 DKK for type 1-4 respectively.
7. Which is equivalent to the ratio of the parameter estimates to the power of the change in cognitive skills 1.5031 /1.503-1 = 2.259.
Appendix
A PISA 2000 CCCQ
Table A1 |
No. Variable |
Q. 1 How often do these things apply to you? |
(Almost never, sometimes, often, almost always)
|
| Table A2 Pisa 2000-Crombach’s Α And Initial Factor Loadings |
|||||
| No. | Obs. | Cronbach’s | Factor loadings | ||
| α | 1 | 2 | 3 | ||
| 1 | 1,852 | 0.924 | 0.289 | 0.323 | 0.164 |
| 2 | 1,842 | 0.922 | 0.657 | 0.12 | 0.105 |
| 3 | 1,843 | 0.924 | 0.23 | 0.305 | 0.217 |
| 4 | 1,840 | 0.922 | 0.584 | 0.221 | 0.124 |
| 5 | 1,842 | 0.923 | 0.321 | 0.294 | 0.252 |
| 6 | 1,88 | 0.924 | 0.166 | 0.163 | 0.642 |
| 7 | 1,836 | 0.922 | 0.402 | 0.369 | 0.236 |
| 8 | 1,828 | 0.921 | 0.715 | 0.151 | 0.172 |
| 9 | 1,820 | 0.921 | 0.428 | 0.438 | 0.173 |
| 10 | 1,824 | 0.923 | 0.261 | 0.4 | 0.229 |
| 11 | 1,828 | 0.923 | 0.524 | 0.213 | 0.135 |
| 12 | 1,830 | 0.921 | 0.402 | 0.514 | 0.129 |
| 13 | 1,837 | 0.922 | 0.139 | 0.658 | 0.172 |
| 14 | 1,814 | 0.923 | 0.154 | 0.176 | 0.703 |
| 15 | 1,816 | 0.923 | 0.038 | 0.601 | 0.203 |
| 16 | 1,827 | 0.922 | 0.514 | 0.295 | 0.091 |
| 17 | 1,826 | 0.923 | 0.202 | 0.403 | 0.235 |
| 18 | 1,825 | 0.922 | 0.642 | 0.131 | 0.128 |
| 19 | 1,836 | 0.921 | 0.377 | 0.493 | 0.157 |
| 20 | 1,828 | 0.921 | 0.393 | 0.485 | 0.215 |
| 21 | 1,827 | 0.922 | 0.338 | 0.473 | 0.161 |
| 22 | 1,805 | 0.924 | 0.12 | 0.118 | 0.792 |
| 23 | 1,818 | 0.922 | 0.316 | 0.449 | 0.271 |
| 24 | 1,818 | 0.922 | 0.544 | 0.248 | 0.181 |
| 25 | 1,823 | 0.921 | 0.359 | 0.497 | 0.189 |
| 26 | 1,807 | 0.921 | 0.668 | 0.211 | 0.159 |
| 27 | 1,819 | 0.923 | 0.272 | 0.485 | 0.12 |
| 28 | 1,806 | 0.922 | 0.268 | 0.51 | 0.183 |
| Min. N | 1,806 | – | – | – | – |
| Cronbach’s α | – | 0.925 | – | – | – |
| Eigenvalues | – | – | 8.816 | 1.278 | 1.02 |
| Table A3 Pisa 2000 Factor Loadings |
||
| Factor | No. | Loading |
| Self-confidence | 2 | 0.654 |
| 4 | 0.630 | |
| 8 | 0.734 | |
| 11 | 0.600 | |
| 16 | 0.610 | |
| 18 | 0.676 | |
| 24 | 0.620 | |
| Perseverance | 26 | 0.722 |
| 13 | 0.778 | |
| 15 | 0.686 | |
| 28 | 0.506 | |
| Future orientation | 6 | 0.675 |
| 14 | 0.751 | |
| 22 | 0.802 | |
B PIAAC 2011/2012
| Table B1: Piaac Background Questionnaire |
| No. Variable |
| Q. To what extent do the following statements apply to you? |
(Not at all, very little, to some extent, to a high extent, to a very high extent)
|
| Table B2: Piaac Crombach’s αAnd Factor Loadings | ||||
| Factor | No. | N | Cronbach’s α | Loading |
| Factor 1 | 1 | 1,877 | 0.725 | 0.525 |
| 2 | 1,879 | 0.714 | 0.569 | |
| 3 | 1,880 | 0.715 | 0.537 | |
| 4 | 1,880 | 0.706 | 0.626 | |
| 5 | 1,879 | 0.685 | 0.688 | |
| 6 | 1,880 | 0.724 | 0.532 | |
| Min. N | – | 1,877 | – | – |
| Cronbach’s α | – | – | 0.748 | – |
| Eigenvalue | – | – | – | 2.035 |
References
- Abowd, J.M., Kramarz F., Langermann, P., & Perez-Duarte, S. (2004). Are good workers employed by good firms? A test of a simple assortative matching model for france and the United States. Working Paper.
- Ai, C., & Norton, E.C. (2003). Interaction terms in logit and probit models. Economics Letters, 80(1), 123-129.
- Andersen, A.M, Egelund, N., Jensen, T.P, Krone, M., Lindenskov, L., & Mejding, J. (2001). Expectations and skills-Danish young people in an International comparison. SFI - Det Nationale Forskningscenter for Velfærd, Copenhagen.
- Avvisati, F., & Keslair, F. (2015). Repest: Stata module to run estimations with weighted replicate samples and plausible values.
- Barth, E., & Dale-Olsen, H. (2003). Assortative matching in the labor market? stylized facts about workers and plants. Institute for Social Research, Oslo, Norway.
- Becker, G.S. (1962). Investment in human capital: A theoretical analysis. Journal of Political Economy, 70(5), 9-49.
- Ben-Porath, Y. (1967). The production of human capital and the life cycle of earnings. Journal of Political Economy, 75(4), 352-365.
- Borghans, L., Duckworth, A.L, Heckman, J.J., & Weel, B.T. (2008). The economics and psychology of personality traits. Journal of Human Resources , 43(4), 972-1059.
- Buis, M.L. (2010). Stata tip 87: Interpretation of interactions in nonlinear models. Stata Journal, 10(2), 305-308.
- Cobb-Clark, D.A., & Tan, M. (2011). Non cognitive skills, occupational attachment, and relative wages. Labour Economics, 18(1), 1-13.
- Costa, P.J, & McCrae, R. (1992). Revised NEO Personality Inventory (NEO-PI-R) and NEO Five-Factor Inventory (NEO-FFI) manual. Psychological Assessment Resources, Odessa, FL.
- Cunha, F., & Heckman, J.J. (2007). The technology of skill formation. American Economic Review, 97(2), 31-47.
- Cunha, F., & Heckman, J.J. (2008). Formulating, identifying and estimating the technology of cognitive and noncognitive skill formation. The Journal of Human Resources, 43(4), 738-782.
- Della, S., & Paserman, M. (2005). Job search and impatience. Journal of Labor Economics, 23(3), 527-588.
- Digman, J.M. (1990). Personality structure: Emergence of the five-factor model. Annual Review of Psychology, 41(1), 417-440.
- Gensowski, M. (2014). Personality, IQ and lifetime earnings, IZA Discussion Paper No. 8235.
- Goff, M., & Ackerman, P.L. (1992). Personality-intelligence relations: Assessment of typical intellectual engagement. Journal of Educational Psychology, 84(4), 537-552.
- Gruetter, M., & Lalive, R. (2009). The importance of firms in wage determination. Labour Economics, 16(2), 149-160.
- Heckman, J.J., Stixrud, J., & Urzua, S. (2006). The effects of cognitive and noncognitive abilities on labor market outcomes and social behavior. Journal of Labor Economics, 24(3), 411-482.
- Herrnstein, R.J., & Murray, C.A. (1994). The Bell Curve: Intelligence and Class Structure in American Life. New York: Free Press.
- Humlum, M.K., Kleinjans, K.J., & Nielsen, H.S. (2012). An economic analysis of identity and career choice. Economic Inquiry, 50(1), 39-61.
- Johnson, R.C., Nagoshi, C.T., & Ahern, F.M. (1983). Correlations of measures of personality and intelligence within and across generations. Personality and Individual Differences, 4(3), 331-338.
- Lindqvist, E., & Vestman, R. (2011). The labor market returns to cognitive and noncognitive ability:Evi-dence from the swedish enlistment. American Economic Journal: Applied Economics, 3, 101-128.
- MacCann, C., Duckworth, A.L., & Roberts, R.D. (2009). Empirical identification of the major facets of conscientiousness. Learning and Individual Differences, 19(4), 451-458.
- Mincer, J., (1958). Investment in human capital and personal income distribution. The Journal of Political Economy, 66(4), 281-302.
- Mortensen, D.T. (2005). Wage Dispersion-Why are similar workers paid differently. First MIT Press Paperback Edition.
- Mueller, G., & Plug, E. (2006). Estimating the effect of personality on male and female earnings. Industrial and Labor Relations Review, 60(1), 3-22.
- OECD (2001). Knowledge and Skills for Life: First Results from PISA 2000. OECD Publishing, Paris.
- OECD (2013a). OECD Skills Outlook 2013: First results from the survey of adult skills. OECD Publishing, Paris.
- OECD, (2013b). The survey of adult skills: Reader’s companion. OECD Publishing, Paris.
- Premuzic, T.C., Furnham, A., & Ackerman, P.L. (2006). Incremental validity of the Typical Intellectual En- gagement Scale as predictor of different academic performance measures. Journal of Personality Assessment, 87(3), 261-268.
- Rosdahl, A. (2014). From 15 years to 25 years. SFI – Det Nationale Forskningscenter for Velfærd.
- Rosdahl, A., Fridberg, T., Jakobsen, V. & Jørgensen, M. (2013). Skills in reading, expense and problem solving with IT in Denmark. SFI – Det Nationale Forskningscenter for Velfærd, Copenhagen.
- Sørensen, K.L, & Vejlin, R., (forthcoming) From mincer to akm: Lessons from danish matched employer-employee data. In Bunzel H, Christensen BJ, Mortensen DT (eds), Firm Heterogeneity, Labor Markets and International Trade: Evidence from Danish Mathed Employer-Employee Data (Con-tributions to Economics). Springer-Verlag Berlin and Heidelberg GmbH & Co.
- Truxillo, C. (2005). Maximum likelihood parameter estimation with incomplete data. Proceedings of the Thirtieth Annual SAS(r) Users Group International Conference.
- Von S., S., Hell, B., & Chamorro-P.T. (2011). The hungry mind: Intellectual curiosity is the third pillar of academic performance. Perspectives on Psychological Science, 6(6), 574-588.
- Wu, M. (2005). The role of plausible values in large-scale surveys. Studies in Educational Evaluation, 31(2-3), 114-128.