Research Article: 2023 Vol: 24 Issue: 4
Comparative analysis of teaching modalities and tools in introductory-level econometrics: unveiling profile dependencies and impact on achievement gaps
Citation Information: Erden, S. (2023). Comparative analysis of teaching modalities and tools in introductory-level econometrics: unveiling profile dependencies and impact on achievement gaps. Journal of Economics and Economic Education Research, 24(4), 1-19.
Abstract
This paper presents findings from an 11-year study on teaching introductory-level econometrics, a historically challenging course for students and instructors. Utilizing extensive data from Fall 2012 to Spring 2023, the study reveals that in-person instruction surpasses online teaching in effectiveness for this course for specific student profiles. It is the opposite for other types of student profiles. Additionally, the classroom response system emerges as the most impactful tool, bridging achievement gaps among students with diverse quantitative backgrounds and majors. Given different teaching modalities, the effect of the classroom response system on student performance depends on the student profile. When the teaching modality is online, polls help those students with a higher quantitative background and hurt those with a lower quantitate background. Conversely, the implementation of an online proctoring system significantly hampers student performance. The paper also addresses the transition from in-person to online and the subsequent return to in-person instruction, highlighting the opportunities that arose during the pandemic and were utilized to enhance in-person instruction afterward.
Keywords
Learning Econometrics, Higher Education Pedagogy, Teaching Modalities, In-person versus Online Teaching, Students’ Performance Gaps, Classroom Response Systems, Learner Engaged Teaching.
JEL Classifications
A22, C13, C33, C80.
Introduction
The first econometrics course in undergraduate college education has evolved over time, with the vast availability of software and data. Tools learned in college econometrics courses are in demand in private and public labor markets (Angrist & Pischke1, 2017, Terry2 ). According to a survey from the National Association of Colleges and Employers (NACE), 20223 , in the United States, “nearly 86% of employers are seeking evidence of problem-solving skills and 78% are looking for proof of analytical/quantitative skills. These figures have increased from 2021 (79% and 76% respectively in 2021).”
Hence, how we, the instructors of the econometrics courses, teach this material gains more importance for students and the field. On the other hand, most students find econometrics “scary,” and they dread taking their first Econometrics course in college. For this reason, we have tried innovative teaching/learning activities over the years. We have compiled 11 years of data and compared different teaching methods to determine how college students learn Econometrics the best. We have included what works the best in both online and in-class teaching for Econometrics.
Econometrics is a capstone course in Economics (Klein, 2013). The Econometrics Society first analyzed the teaching of econometrics in early 1952 as part of UNESCO’s general inquiry into teaching in the social sciences (Tintner, 1954). Although college-level econometrics courses have evolved with the vast availability of data, it has been found that very little have changed in the teaching methods of most introductory economics courses (Asarta, 2020). Applied econometrics was mainly concerned with estimating the parameters of a given economic theory (Johnson, 2012). Angrist & Pischke (2017) report that other than the Stock and Watson textbook4, none of the modern undergraduate econometrics textbooks discuss modern econometric tools. Angrist and Pischke surveyed econometrics textbooks published since the 1970s and compared them by the number of pages allocated to econometric topics. They make three specific suggestions for undergraduate econometrics instruction; focusing on causal question empirical examples rather than math, revising the material away from multivariate modeling towards controlled statistical comparisons, and lastly, putting emphasis on quasi-experimental methods. In our data set, all econometrics courses used updated editions of the Stock and Watson textbook as the required textbook.
Econometrics or any quant-heavy course requires active learning. In active learning pedagogical approach, instructors use in-class activities to engage students in the learning process. This approach contrasts with classic “chalk and talk” lectures in which students receive information that the educator delivers. Research shows that active learning is beneficial for all students (Becker & Watts, 1996) (Becker & Greene, 2001). There is broad agreement that working memory is closely related to attention (Oberauer, 2018). Active learning improves students’ performance (Freeman et al., 2014) and narrows achievement gaps (Theobald et al., 2020). It has been shown that regardless of how clearly a teacher or book tells them something, students will understand the material only after they have constructed their own meaning for what they are learning (Kennedy, 1998). The acquisition of knowledge does not occur solely through passive listening but rather through active engagement and experiential learning. For instance, when individuals aspire to undertake marathon training, it is unlikely that they would achieve their goals by idly sitting on a couch, indulging in popcorn, and passively watching recordings of marathon runners. The study done by the National Survey of Student Engagement (NSSE) from 1600 universities shows that hands-on, integrative, and collaborative active learning experiences lead to high levels of student achievement and personal development (Kuh et al., 2017). It has been shown that classroom response systems and low stake quizzes are helpful ways of “goal-targeted practices with targeted feedback” (Ambrose et al., 2010).
This paper analyzes data from 11 years of econometrics classes to shed light on students’ achievement gaps in the first econometrics course at the college level. These courses used different editions of the Stock and Watson textbook. The paper also addresses a personal account of the transition from in-person to online and the subsequent return to in-person instruction, highlighting the opportunities that arose during the pandemic and were utilized to enhance in-person instruction afterward.
Data
Data is compiled from the undergraduate Introduction to Econometrics course at Columbia University, Department of Economics, starting Fall 2012 and ending Spring 2023. Major variables and controls are listed in Table 1. There are three different dependent variables that measures the “outcome.” One of the dependent variables is the GPA which is the grade point average out of 4.0. It is calculated using the usual scale where A is 4.0, A- is 3.67, B+ is 3.33, and so on. GPA is measured after the curve is applied, so class-fixed effects do not affect the results. The other dependent variable we used is Performance. We divided students into three categories; the success category includes those students with GPAs A, A- and B+, the mediocre category includes those students between C and B, the failure category includes those students with B- and lower. The third dependent variable is Total which is the total grade of students out of 100 calculated by a formula given on the syllabus. Basically, it takes 30% of the problem set grades. There are nine problem sets, and the lowest grade is dropped. Then between the midterm and the final exams, the higher one counts as 40%, and the lower one counts as 30% of the Total course grade. Note that polls are done in some semesters, but they never count toward the course grade. They are done for the sole purpose of keeping students’ attention at the highest possible level. They are done after teaching a topic for 15 to 20 minutes. It is well established that an average student’s attention span lasts about that time. So right when their attention span is fading (Bradbury, 2016). I do a poll with one or two questions about what I have just taught. Having to answer a poll or two every 15 to 20 minutes helps students “wake up”; we have seen that this helps less successful students more. We suspect this might be because those students’ attention spans are shorter than the more successful ones. However, with our data, we have no way of testing this claim whether success and attention span have any simultaneously causal effects on each other. There are several scholarly works done on this issue.5
| Table 1 (Data for Intro to Econometrics from Fall 2012 to Spring 2023) | |
| Variables/Controls | Description |
| Total | Total grade out of 100 in the course |
| GPA | Grade point average version of the grade out of 4.0 |
| Performance | |
| Final | Final exam grade |
| Midterm | Midterm exam grade |
| Psets | Problem Set average grade (total of 9 problem sets) |
| School | CC = Columbia College; EN = School of Applied Sciences and Engineering; GS = General Studies; BC = Barnard College |
| Level | U01 = Freshmen; U02 = Sophomores; U03 = Junior; U04 = Senior; U00 = Other |
| Affiliation | School and major combination of the student (ex: CCECON is Columbia College Economics Major, GSECMA is General Studies Econ-Math major |
| Major | Declared major of the student (ex: Financial Engineering) |
| Econ | = 1 if student has the word Economics in Major or in Affiliation |
| Room | The classroom that the class took place (this control included Online as a separate classroom) |
| Polls | = 1 if Polls (Zoom or in-class) were used as a teaching tool; = 0 otherwise |
| Proctorio | = 1 if this online proctoring platform was used for exams; = 0 otherwise |
| Male | = 1 for male students, = 0 otherwise |
| Rigor | a numerical proxy for the mathematical (quantitative) rigor of a given major. Majors that are pure math or highly integrate math- such as Mathematics, Statistics, Physics, or Econ-Math- are given a 4, whereas majors that involve no major mathematical component- such as Philosophy, Comparative Literature, or Art History- are given a 1. Majors that occasionally use math are given a 2, and majors that consistently, but not primarily, use math are given a 3. |
| OnlineRigor | Interaction between Online and Rigor variables |
| PollsRigor | Interaction between Polls and Rigor variables |
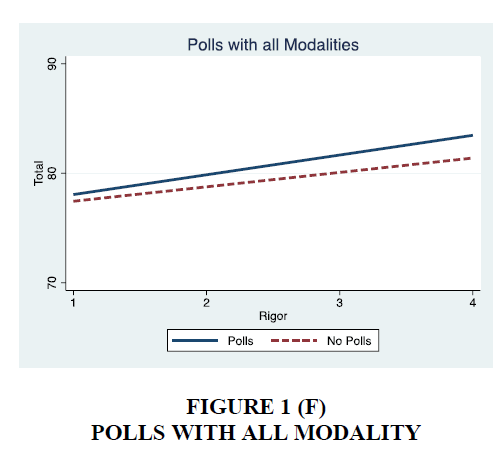
An essential variable of interest is called Rigor, a measure of student’s mathematical rigor of the students. It is a numerical proxy for a given major’s mathematical (quantitative) rigor. Majors that are pure math or highly integrated math -such as Mathematics, Statistics, Physics, or Econ-Math- are given a 4, whereas majors that involve no major mathematical component- such as Philosophy, Comparative Literature, or Art History- are given a 1. Majors that occasionally use math are given a 2, and majors that consistently, but not primarily, use math are given a 3. We introduce this variable to understand students’ interests. Those students in less quantitative majors inherently have less interest in quant-heavy courses. Since econometrics is a quant-heavy course, those students who show interest in non-quantitative majors tend to do worse in econometrics than those who show interest in more quantitative majors (Figure 1A to Figure 1F).
At the student level, we have also collected data on level (Freshmen to Senior), declared major, the school, affiliation, exam, and problem set grades, as well as their gender. At the class level, we have data on the time of the day, the day of the week, the specific classroom, the semester, the teaching modality, the classroom response system, and whether, for the exams, the online proctoring was used or not. We have used a machine learning program to determine the binary gender data.
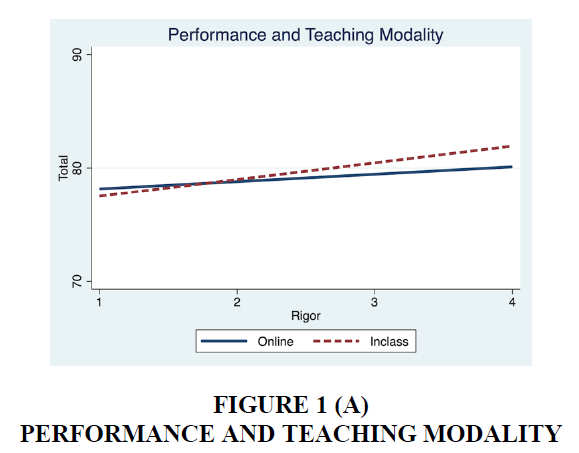
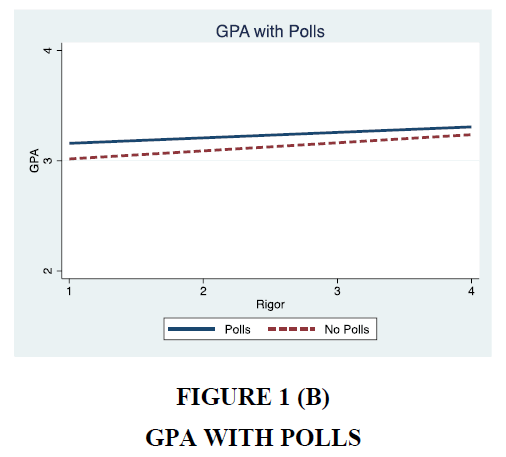
However, we showed that in semesters we used polls, this gap in performances between less and more rigorous students narrows for GPA (Figure 1b) but widens when we consider total grade out of 100 (Figure 1F). We also showed that online teaching is worse for student performances at most rigor levels, except for those students at majors with low math/quant levels (Figure 1A).
Empirical Results
We found that online teaching had significant adverse effects on students’ performances at most rigor levels except for those students with majors that do not involve math or quantitative analysis (Figure 1a). Those students do slightly better when the teaching modality is online. We use controls for class size, student’s major, time of the day, day of the week, physical classroom, gender, and rigor background. Online classes took place only half of the Spring 2020, Summer 2020, Fall 2020, Spring and Summer 2021. Outside of these five semesters, teaching has been in-class. We must note that these semesters coincide with the pandemic (Covid-19) era, and there may also be a possibility of low morale table 2. However, the sample size is large enough that we do not believe the randomness is affected. We have found that Polls are associated with higher GPAs overall. Polls significantly affect GPA when we control for all other variables. On average, Polls are associated with 0.37 higher GPA points at a 1% significance level – see Table 3, last column. Polls close the gap between less rigorous and more rigorous students – see Figure 1b as an example; this figure shows the regressions (with and without Polls). On the vertical axis, we have the Rigor level of the students, and on the horizontal axis, we have the GPA out of four. We must note that GPA and Total grade results differ because GPA is a curved grade; however, Total is the raw grade out of 100. The gap in the GPA of the students closes with polls. In other words, polls help mediocre and lower-level students more than they help successful students.
| Table 2 Total Grade Out of 100 | ||||
| VARIABLES | (1) Total |
(2) Total |
(3) Total |
(4) Total |
| Online | -4.954*** (1.732) |
-16.28*** (5.115) |
-16.36*** (5.259) |
-14.29*** (5.407) |
| Polls | 5.565*** (1.546) |
17.63*** (5.476) |
17.93*** (5.601) |
19.01*** (6.343) |
| Tues-Thur (vs MW) | 1.536** (0.747) |
1.578** (0.745) |
1.891** (0.753) |
|
| Male | -1.232** (0.625) |
-1.440** (0.626) |
-1.554** (0.628) |
|
| Econ | -3.139*** (0.743) |
-2.229*** (0.831) |
||
| Rigor | 1.461*** (0.474) |
|||
| Online x Rigor | -1.962* (1.060) |
|||
| Constant | 79.02*** (0.366) |
77.49*** (3.474) |
77.54*** (3.456) |
78.38*** (3.588) |
| Fixed Effects: Time of the day effects Day of the week effects |
No No |
Yes Yes |
Yes Yes |
Yes Yes |
| Classroom effects | No | Yes | Yes | Yes |
| School effects | No | Yes | Yes | Yes |
| Rigor Performance interactions | No | No | No | Yes |
| p-value for joint significance test of Rigor and its interaction | 0.0118** | |||
| Observation | 2,339 | 2,334 | 2,334 | 2,299 |
| Adjusted R-squared | 0.016 | 0.209 | 0.219 | 0.323 |
| Robust standard errors in parentheses *** p<0.01, ** p<0.05, * p<0.1 |
||||
| Table 3 Grade Point Average | ||||
| VARIABLES | (1) GPA | (2) GPA | (3) GPA | (4) GPA |
| Polls | 0.102** (0.00460 - 0.199) |
0.194* (-0.00591 -0.395) |
0.186* (-0.0192 -0.390) |
0.365** (0.0483 - 0.682) |
| Online | 0.213*** (0.0810) |
0.0617 (0.137) |
0.0733 (0.139) |
0.361 (0.233) |
| Proctorio | -0.0531 (0.0883) |
-0.0572*** (0.0192) |
-0.0517*** (0.0190) |
-0.0496** (0.0199) |
| Tues-Thur | 0.252*** (0.0863) |
0.258*** (0.0853) |
0.278*** (0.0866) |
|
| Econ | -0.183*** (0.0397) |
-0.138*** (0.0435) |
||
| Rigor | ||||
| 0.0687*** (0.0252) | ||||
| Rigor x Polls | -0.0672* (0.0406) |
|||
| Rigor x Online | -0.1035* (0.0627) |
|||
| Constant | 3.110*** (0.0177) |
3.723*** (0.288) |
3.745*** (0.296) |
3.627*** (0.303) |
| Fixed Effects: | ||||
| Gender dummy | No | Yes | Yes | Yes |
| Time of the day effects | No | Yes | Yes | Yes |
| Day of the week effects | No | Yes | Yes | Yes |
| Classroom effects | No | Yes | Yes | Yes |
| School effects | No | Yes | Yes | Yes |
| Rigor Polls and Rigor Online interactions |
No | No | No | Yes |
| F tests p-values for | ||||
| Rigor and all Rigor interactions | 0.0344** | |||
| Rigor and Polls | 0.0186** | |||
| Rigor and Online | 0.0139** | |||
| Adj R-squared | 0.004 | 0.286 | 0.395 | 0.396 |
| Observations | 2,430 | 2,388 | 2,388 | 2,388 |
| Robust standard errors in parentheses *** p<0.01, ** p<0.05, * p<0.1 |
||||
Polls help students with higher GPAs more; they help average students less and hurt failing students’ grades. Recall that we define students with GPA above 3.3 as successful, students with GPAs between 2.0 and 3.3 as mediocre, and students below 2.0 GPA as failing. Polls close the gap between these students, helping most to mediocre students and failing students less to successful students – see Table 4 and Table 5.
| Table 4 Performance (Ordered Logit) Effect of Polls and Proctorio | ||||
| VARIABLES | (1) Performance | (2) Performance | (3) performance | (4) performance |
| Polls | 0.275 (-0.0124 - 0.562) |
0.928*** (0.344 - 1.512) |
0.956*** (0.363 - 1.548) |
1.462*** (0.427 - 2.498) |
| Proctorio | -0.179 (-0.665 - 0.306) |
-0.706* (-1.454 - 0.0419) |
-0.723* (-1.481 - 0.0348) |
-0.683* (-1.436 - 0.0703) |
| Tues-Thur (vs MW) | 0.276*** (0.0969 - 0.455) |
0.286*** (0.106 - 0.467) |
0.293*** (0.112 - 0.474) |
|
| Econ | -0.277*** (-0.479 - -0.0742) |
-0.279*** (-0.488 - -0.0691) |
||
| Rigor | 0.127** (0.0113 - 0.242) |
0.150** (0.0245 - 0.276) |
||
| 2.Rigor#c.Polls | -0.439*** (-1.380 - 0.155) |
|||
| 3.Rigor#c.Polls | -0.922** (-1.792 - -0.214) |
|||
| 4.Rigor#c.Polls | -0.216** (-1.253 - 0.831) |
|||
| /cut1 | -2.597*** (-2.749 - -2.446) |
-2.680*** (-3.653 - -1.708) |
-2.504*** (-3.560 - -1.448) |
-2.498*** (-3.550 - -1.445) |
| /cut2 | -0.305*** (-0.388 - -0.222) |
-0.268 (-1.222 - 0.686) |
-0.0883 (-1.126 - 0.950) |
-0.0777 (-1.112 - 0.956) |
| Fixed Effects: Gender dummy Time of the day effects Day of the week effects Classroom effects (including online) School effects Rigor Polls interactions |
No No No No No No |
Yes Yes Yes Yes Yes No |
Yes Yes Yes Yes Yes No |
Yes Yes Yes Yes Yes Yes |
| Observations | 2,788 | 2,780 | 2,723 | 2,723 |
| *** p<0.01, ** p<0.05, * p<0.1 | ||||
| Table 5 Performance (Ordered Logit) Effect of Online and Polls | ||
| Ordered Logit | With Online, probabilities change | With Polls, probabilities change |
|
Probability (Perf =1) failing students |
↑by 2.4%* | ↓by 5.9%***
|
|
Probability (Perf =2) mediocre students |
↑by 6.2%* | ↓by 15.3%*** |
|
Probability (Perf =3) successful students |
↓by 8.7 %*
|
↓by 21.3%*** |
| *** p<0.01, ** p<0.05, * p<0.1 | ||
Proctorio (online proctoring platform) significantly negatively affects GPA and the total raw grade out of 100. When Proctorio was used, it was associated with about .05 lower GPA points at a 1% significance level (see Table 3). There are some cases where Online or Proctorio is not highly significant; however, this may be due to the high correlation between Proctorio and Online variables. Because online proctoring only occurred when the teaching modality was online. After returning to in-class teaching, Proctorio was no longer used since the exams were in-class again. Because the data from online semesters also mostly used Proctorio, we suspect another multicollinearity problem between Proctorio and Polls because the sample correlation between those two variables is 0.43. The higher the correlation, the more likely the individual significance test will under-reject6. As the correlation goes to one, each coefficient’s variance approaches infinity. The joint significance test of the population slopes is a common “solution” used in the literature. When we jointly test the population slopes of Online, Polls, and Proctorio jointly, we found that the p-value is 0.0009. Hence, we can keep all three variables in the regression to avoid omitted variable bias – Table 3.
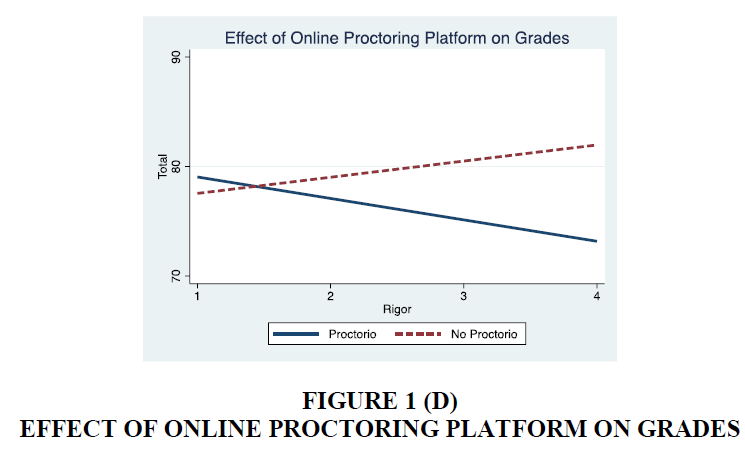
This online proctoring system hurts students’ grades increasingly; it hurts less rigorous students’ grades, with an increasing effect on students’ grades as their majors’ rigor increases. Thus, we have this widening gap in students’ performances with and without Proctorio, as rigor increases (Figure 1d).
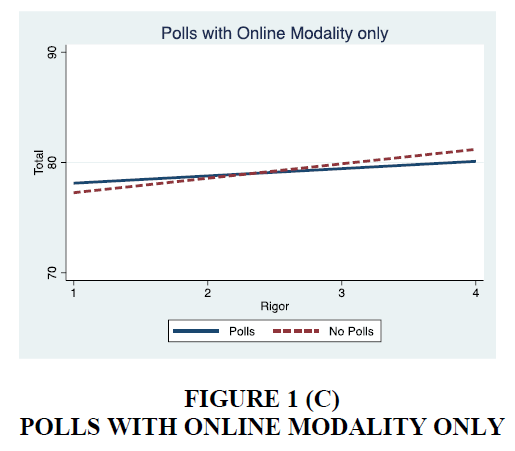
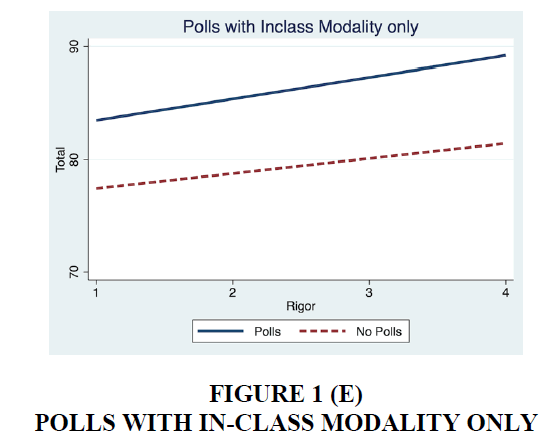
Polls have a significantly larger effect on students’ performances in the in-class modality than in the online modality. In both cases, polls help student performance; however, the helpful effect widens the gap in performance between less and more rigorous majors (Figures 1c, 1e and 1f) during the pandemic, students were allowed to pass/fail a course. However, instructors still had to calculate the grade out of 100. Table 2 shows the adverse effects of online teaching on students’ performances as calculated by the effect on their total grades.
Tuesday – Thursday classes have done significantly better than Monday – Wednesday classes; the difference is about 0.278 GPA points – Table 3. The same effect can also be observed under ordered logit – Table 4.
Fall semester classes have done significantly better than Spring semester classes. On average, 0.067 GPA points higher for Fall semester classes compared to Spring semester classes. Although the summer classes have a much smaller enrollment size, almost less than a quarter of the enrolment in a regular semester, summer class results are not significantly different from the other two semesters.
One particular classroom has a significant effect on grades. In the semesters when the class was taught in this classroom, on average, students received 0.24 GPA points higher with a p-value of 0.02. Morning classes (10:10 am) are performing better than those classes after lunch (1:10 pm); second best are the ones that are taught later in the afternoon (2:40 pm and 4:10 pm). Sophomores perform the best, then come juniors, followed by seniors. However, juniors perform significantly better when we include the interaction with the Polls variable. This result may indicate that Polls are most helpful to junior students’ grades. Students with an Economics major only (not including double majors, or those who major in Economics with a concentration such as Econ-Math, Econ-Stats, Econ-Political Science, or Financial Economics) do significantly worse in Econometrics with 0.18 less GPA points on average.
Engineering students end up with significantly higher grades when compared to all other schools; next, come the students in Columbia College, then General Studies, then the category under “others” which includes exchange students as well as professional studies. At the bottom of the success list are the students from Barnard College. The reason for this is understandable since the course is a quant-heavy course. Engineering students come with a stronger quantitative background. Among those who are Engineering majors, Financial Engineering and Electrical Engineering majors are significantly better, with 0.30 and 0.68 higher GPA points (compared to Operations Research majors).
Online teaching is associated with better performance for students associated with lower rigor majors, however for all the rest of the students in class teaching is associated with higher performance, with increasing gap as rigor increases Figure 1 (A).
Effect of Polls on grades of students at different Rigor levels; Polls close the gap in GPA and in general increase the GPA at all rigor levels Figure 1 (B).
Given online modality, polls mostly help students with higher rigor level and hurt the students with lower rigor level Figure 1 (C).
Given online modality, having exam with Proctorio (an online proctoring platform) widens the gap in total grades between different rigor levels Figure 1 (D).
In in-class setting, polls help all students’ performances Figure 1 (E).
Combining in class and online modalities, polls help more rigorous students slightly more. Students at lower rigor majors tend to perform worse with increasing gap in total grade as rigor level increases Figure 1 (F).
Online teaching during the pandemic is associated with lower performance for students at all rigor levels except the lower rigor levels. When performance is measured as a grade out of 100, there is a slight widening in the gap between online and in-class performances as the rigor level increases; however, that slope difference is not statistically significant, as can be seen in Figure 1(a).
When we consider performance with failing, mediocre and successful with a logit under online modality, the probability of being a failing student increase by 2.4%, the probability of being a mediocre student increase by 6.25% but the probability of being a successful student decrease by 8.7%. This result supports our finding about the comparison of two modalities - see Table 5. On the contrary, polls help decrease the probabilities of failing and mediocre students by 5.9% and 15.3%, respectively. However, polls increase the probability of successful students by 21.3% - see Table 5.
Engineering students come with a stronger quantitative background – all tables. Among those who are Engineering majors, Financial Engineer and ElectricalEngineer majors are significantly better, with 0.30 and 0.68 higher GPA points (compared to Operations Research majors).
Using Technology in Classroom7
This section presents a personal account of the transition from in-person to online and back to in-person teaching and the challenges and opportunities that arise during this process. Prior to the onset of the Covid-19 pandemic in Spring 2020, many instructors relied on traditional teaching tools and methods. However, with the shift to online instructions, new tools, and methods had to be rapidly implemented to ensure effective student learning. This shift presented a pedagogical challenge for instructors around the world. Upon the resumption of in-person instruction at Columbia University in the Fall 2021 semester, some of the technology that was adopted during the online period was carried over into the classroom setting. This section outlines the technology and teaching methods that were found to be effective in facilitating student learning during this transition period.
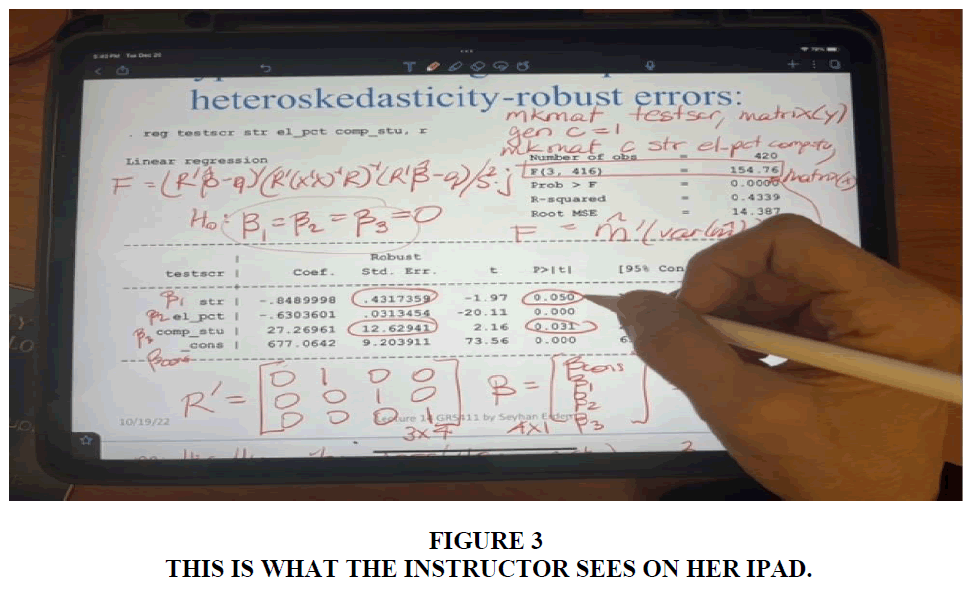
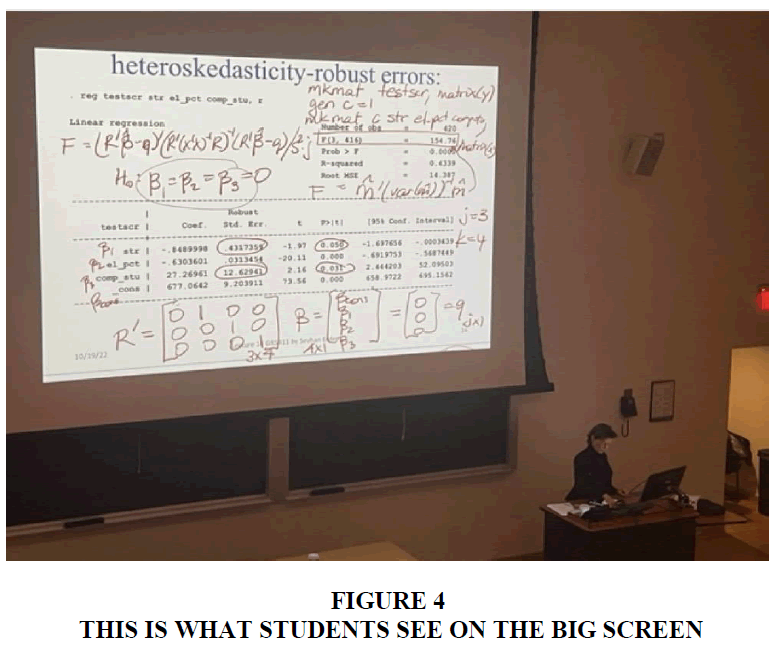
In the context of traditional in-person classroom instructions, my teaching methodology involved utilizing a blackboard as well as occasionally incorporating computer-based PowerPoint presentations. However, when transitioning to online teaching, I adopted a novel approach by substituting the blackboard with a tablet device (iPad) coupled with the utilization of a software application (Notability) that I can use as a “blackboard” on the tablet. This method served as an effective alternative to the traditional blackboard. Initially, I alternated between displaying PowerPoints and the blackboard-like software on the tablet. However, later I converted the slides to pdf files introducing additional empty spacing between slides. This modification enabled me to annotate the slides in real time, allowing students simultaneously view both the slides and my annotations. Remarkably, this technique surpassed the efficacy of the traditional blackboard employed within the physical classroom environment. Subsequently, upon resuming in-person instruction, I continued to use this method by showing the tablet screen on a larger display as a substitute for chalk and a traditional board. This transition presented several advantages, such as avoiding the need to turn my back to the students and maintaining face-to-face interactions while writing Figure 2 (Erden, 2023).
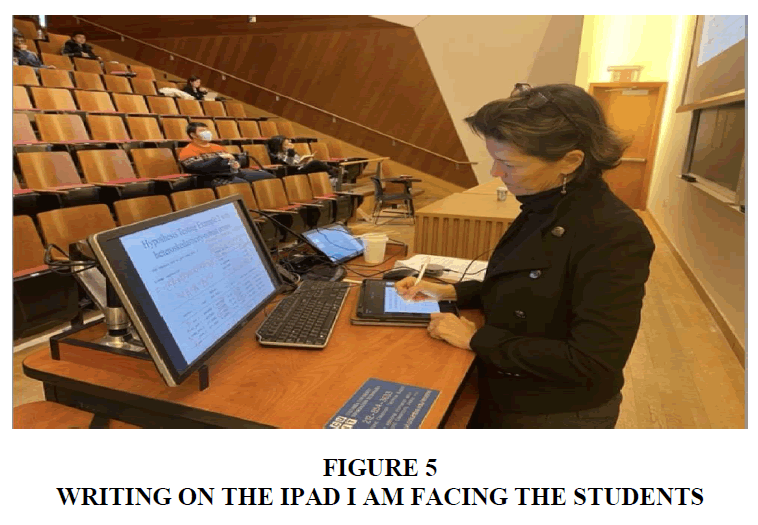
Moreover, the display screen provided a larger visual interface compared to the conventional blackboard. For illustrative purposes, Figures 3, 4, and 5 depict the visual perspectives observed on my tablet (3), the display content visible to my students in the classroom (4), and my personal viewpoint while instructing in the classroom (5). Notably, due to the absence of the physical blackboard, I can now share the contents I have written during class on the course website, Courseworks – a virtual classroom platform specifically designed for Columbia University. Formerly, students had to rely on their personal notes; however, with the integration of the software application, I can now publish my annotations, allowing students to access and review the entirety of the instructional content. Surprisingly, this inclusive approach did not diminish students’ inclination to engage in notetaking during lectures; they continued to maintain their individual notetaking practices. Consequently, they now benefit from the availability of two distinct sources of in-class notes; the material I posted on Courseworks and the notes they personally compile.
(Before the pandemic, I used to teach writing on the blackboard, I had to turn my back to the students. Another advantage with iPad: on the classroom computer in front of me, I can see what students see on the big screen behind/above me. I do not have to turn my back to look at the big screen).
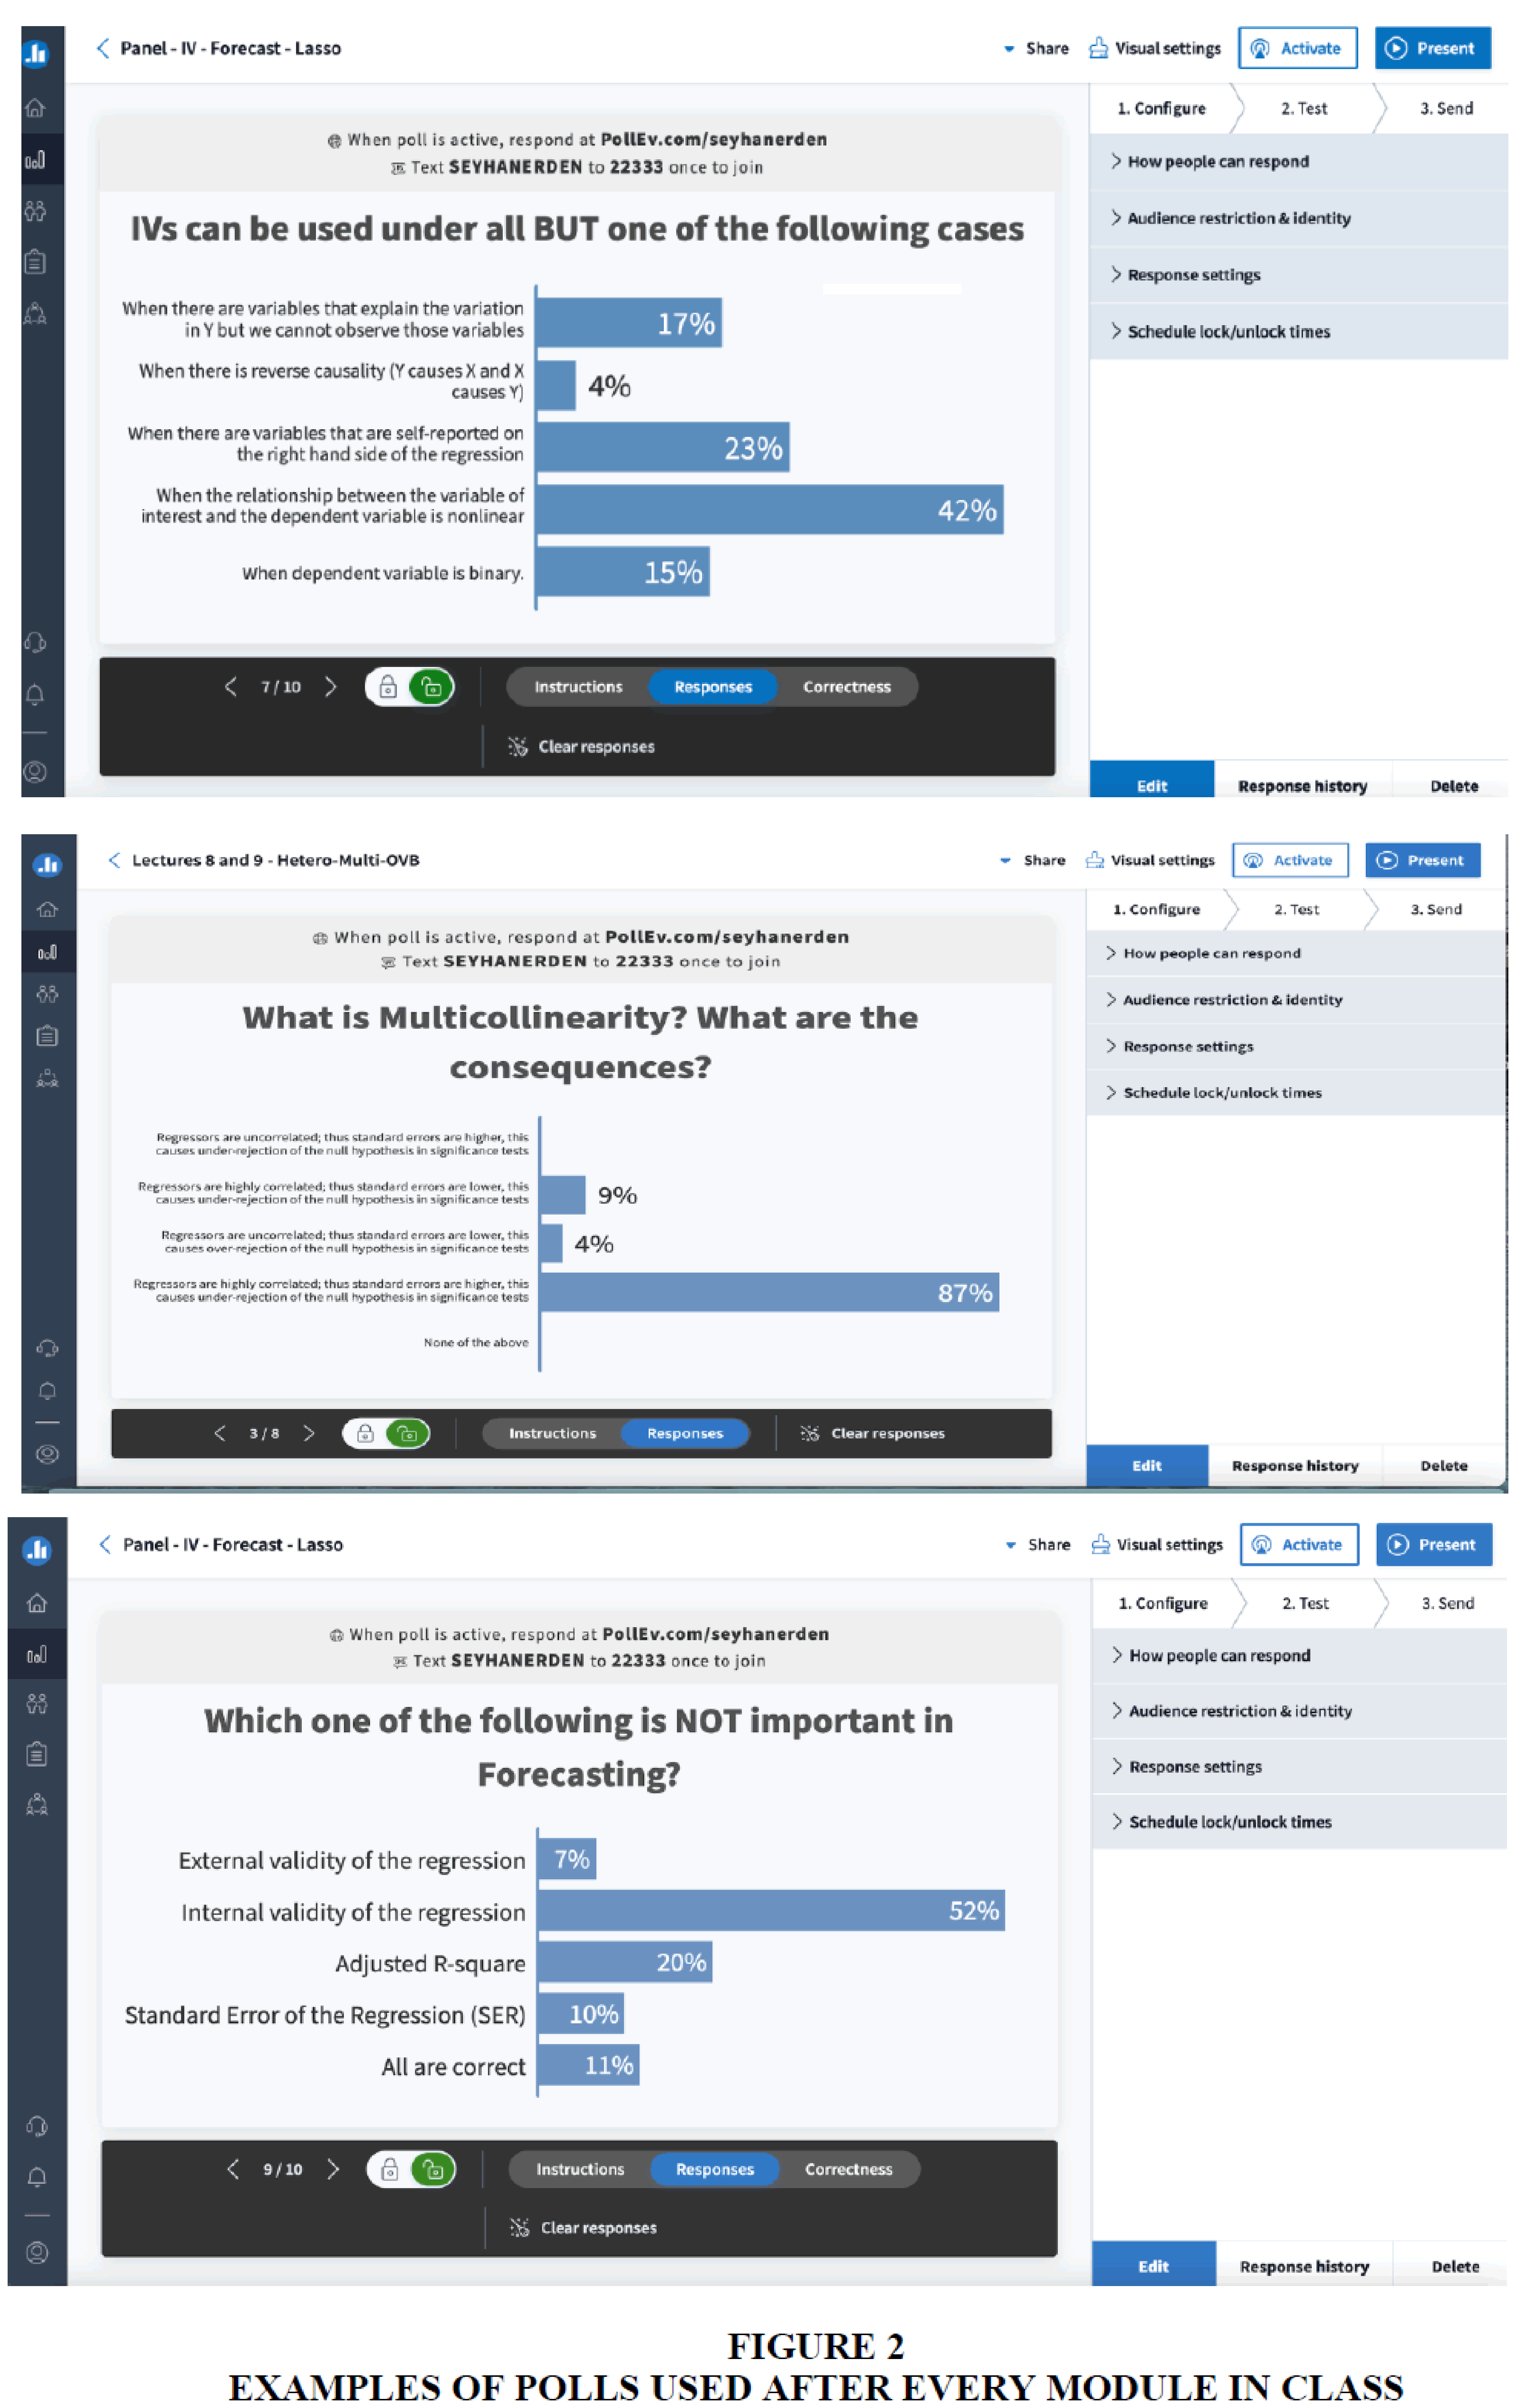
Before the move to online, I would walk around the class and ask students questions. At first, I tried to ask questions verbally under the online modality, but students were not answering. I started using the Poll feature in Zoom, which helped students pay attention and engage in the online setting. I would teach for about 15-20 minutes, then conduct polls about the topic I taught. This kept students engaged; they started asking questions if there was anything they did not understand, which helped me know that students were paying attention. Since moving back to in-person teaching, I still use polls every 15-20 minutes, now using Poll Everywhere; Figure 2 offers examples of the polls used in class, along with the instructor results view in Poll Everywhere. After each poll, we discuss the answers as a class, further helping students understand the topic. This is better than before the pandemic when I used to ask verbal questions, and only about 10% of the class would answer. With polls, every student answers, and their answers are just for me; it helps students who might be shy or afraid to give the wrong answer. It’s more inclusive. Since implementing polls, I have conducted academic research on the effectiveness of polls and found that polls help close the gap in performance between less successful students and those students who were already more successful.
When moving online, my first thought was it is impossible to teach my courses online! But not only was I able to teach online, I kept some of the online practices when I returned to the classroom. This made me a better teacher – it made me think about the best ways to teach different concepts in Econometrics, and what it is I want my students to learn about each concept. For example, there are concepts in Econometrics that we teach students by working on data, but I think it would be better if we also allow them to change the data and see what happens to the results interactively. There are these tools in Statistics and some concepts related to Econometrics, but they don’t exist for all major topics in Econometrics. It made me realize that there is a need for an interactive platform that teaches students by showing graphic results visually and interactively as data changes, which I have started planning to create with the help of the recently approved Provost Funded Grant Award on Innovative Course Design8 . I want to develop this platform keeping the “big picture” in mind. This idea evolved because of the move to online teaching in Spring 2020 because I had to think hard about the best ways to teach certain concepts in Econometrics without the chalk and blackboard.
Conclusion
We have used the last 11 years’ data from a course in econometrics, Introduction to Econometrics, taught by the author and offered by the Department of Economics at Columbia University to evaluate different means used by the instructor. Our findings suggest many significant results that would help the instructors who teach similar courses at different universities.
We have found that different methods (such as the classroom response system method) have different effects on students’ performances depending on the teaching modality of the course and depending on the student’s major’s rigor level. In semesters we had in-class teaching, students with higher rigor majors performed better compared to online modality; however, students with no math majors performed worse compared to online modality.
The most significant finding is the use of polls (see appendix for examples). In the semesters we used polls, students’ absolute grades increased significantly. Also, more importantly, the gap in the performance between less rigorous students and more rigorous students has been closed for the semesters we used polls as a teaching tool (see Figure 1b). We have shown that for a randomly selected student, polls improved the probability of being a successful student by 24.5%, decreased the probability of being a mediocre student by 17.8%, and decreased the probability of being a failing student by 6.7%. This result is the most striking one from our ordered logit regressions. Polls, Online, and Proctorio are the variables of interest for all our regressions. We have used many control variables. In the process, some of these variables also showed interesting results. During the pandemic, online teaching did significantly affect students’ performances. Proctorio, an online proctoring platform, significantly lowered performance for more rigorous students. Keeping all else equal, engineering students perform better; this is not surprising because econometrics is a quant-heavy course. We observed the “Monday effect” in this course. Tuesday – Thursday classes have done slightly better than Monday – Wednesday classes; the difference is about 0.278 GPA points. Fall semester classes have done significantly better than Spring semester classes. We observed the “senioritis effect,” i.e., seniors performed significantly worse in this course. Another interesting result is about the use of technology instead of “chalk and board.”
In conclusion, this 11-year study on the teaching of Econometrics has provided valuable insights into effective teaching methods for this challenging subject. By analyzing a vast amount of data, the study has identified polls as the most effective tool in helping students learn Econometrics and narrowing the achievement gap between the highest and lowest-performing students. The study also offers important lessons for instructors who find ways to communicate complex concepts in a clear and accessible manner. This paper contributes to ongoing efforts to improve the quality of economics education by sharing what works and what does not work in teaching Econometrics. Ultimately, the findings of this study can help instructors to become more effective educators.
End Notes
1.Angrist, J.D., Pischke, J.S., 2017. Undergraduate Econometrics Instruction: through our classes. Darkly. Journal of Economic Perspectives. 31, 125-144
2.Terry, C., 2019 Becoming an Econometrician: What You Need to Know [www document]. Noodle (accessed 10/30/22) https://www.noodle.com/articles/becoming-an-econometrician-what-you-need-to-know.
3.National Association of Colleges and Employers (NACE), 2022. Job Outlook 2022: The Attributes Employers Want to See on College Students’ Resumes [www document].
4.Stock, J.H. and Watson, M.W. (2015) Introduction to Econometrics. 3rd Edition, Addison Wesley, Boston.
5.National Library of Medicine. (2019). Journal of Cognition, https://www.ncbi.nlm.nih.gov/pmc/articles/PMC6688548/, Published online 2019 Aug 8. doi: 10.5334/joc.58
6.Here, under-rejection refers to the fact that standard errors of sample slopes increase as the correlation between regressors increases; hence the test statistics (z-score) decrease because the standard error of the sample slope is in the denominator. Thus, we are less likely to reject a significance test for a given critical value such as 1.64, 1.96, 2.58; this is what we refer to as under-rejection here. We are more likely to find the variables insignificant as the correlation between regressors increases.
7.Erden, S. (2023). Leverage Educational Technology to Create Engaging Classroom Experiences. Columbia University in the City of New York. https://ctl.columbia.edu/transformations/faculty/seyhan-erden/
8.https://vptli.columbia.edu/request-for-proposals/
References
Ambrose, Susan A., Michael W. Bridges, Michele Dipietro, Marsha C. Lovette and Marie K. Norman (2010). “How Learning Works – 7 Research Based Principles for Smart Teaching.” Jossey-Bass Higher and Adult Education Series.
Indexed at, Google Scholar, Cross Ref
Angrist, J.D., Pischke, J.S., (2017). Undergraduate econometrics instruction: through our classes, darkly. Journal of Economics Perspectives, 31, 125-144.
Indexed at, Google Scholar, Cross Ref
Asarta, C. J., Chambers, R. G., & Harter, C. (2020). Teaching methods in undergraduate introductory economics courses: results from a sixth national quinquennial survey. The American Economist.
Indexed at, Google Scholar, Cross Ref
Becker, W. E., & Watts, M. (1996). Chalk and talk: a national survey on teaching undergraduate economics. The American Economic Review, 86(2), 448–453.
Becker, W. E., & Greene, W. H. (2001). Teaching statistics and econometrics to undergraduates. The Journal of Economic Perspectives, 15(4), 169–182.
Indexed at, Google Scholar, Cross Ref
Bradbury, N.A. (2016). Attention span during lectures: 8 seconds, 10 minutes, or more?. Advances in Physiology Education.
Indexed at, Google Scholar, Cross Ref
Erden, S. (2023). Leverage Educational Technology to Create Engaging Classroom Experiences. Columbia University in the City of New York.
Freeman, S., Eddy, S. L., McDonough, M., Smith, M. K., Okoroafor, N., Jordt, H., & Wenderoth, M. P. (2014). Active learning increases student performance in science, engineering, and mathematics. Proceedings of the National Academy of Sciences, 111(23), 8410-8415.
Indexed at, Google Scholar, Cross Ref
Johnson, B. K., Perry, J. J., & Petkus, M. (2012). The status of econometrics in the economics major: a survey. The Journal of Economic Education, 43(3), 315–324.
Indexed at, Google Scholar, Cross Ref
Kennedy, P.E. (1998). Teaching undergraduate econometrics: a suggestion for fundamental change. The American Economic Review, 88(2), 487–492.
Klein, C. C. (2013). Econometrics as a capstone course in economics. The Journal of Economic Education, 44(3), 268–276.
Indexed at, Google Scholar, Cross Ref
Kuh, G.; Ken O’Donnell, Carol Geary Schneider (2017).“HIPS at Ten” The Magazine of Higher Learning, v49 n5, 8-16.
National Association of Colleges and Employers (NACE), 2022. Job Outlook 2022: The Attributes Employers Want to See on College Students’ Resumes [www document]. Job Outlook 2022.
Oberauer, K. (2018). Working memory and attention – a conceptual analysis and review. Journal of Cognition, 2(1).
Indexed at, Google Scholar, Cross Ref
Terry, C. (2019). Becoming an econometrician: what you need to know [www document]. Noodle (accessed 10/30/22).
Tintner, G. (1954). The Teaching of Econometrics. Econometrica, 22(1), 77–100.
Indexed at, Google Scholar, Cross Ref
Theobald, E. J., Hill, M. J., Tran, E., Agrawal, S., Arroyo, E. N., Behling, S., ... & Freeman, S. (2020). Active learning narrows achievement gaps for underrepresented students in undergraduate science, technology, engineering, and math. Proceedings of the National Academy of Sciences, 117(12), 6476-6483.
Indexed at, Google Scholar, Cross Ref
Received: 17-Jun-2023, Manuscript No. JEEER-23-13707; Editor assigned: 19-Jun-2023, PreQC No JEEER-23-13707(PQ); Reviewed: 26-Jun-2023, QC No. JEEER-23-13707; Published: 10-Jul-2023
