Research Article: 2018 Vol: 19 Issue: 2
Compartive Research On the Efficiencies of Universities and the Impact of Ownership
Mehmet Fatih Acar, Gediz University
Abstract
Keywords
Data Envelopment Analysis, Technical Efficiency, Ownership, Higher Education.
Introduction
In the ownership and efficiency literature, there are different perspectives such as agency theory, property-rights theory and public choice theory to discuss the relationship between these conceptions. These theories suggest different perspectives with a common argument, which draws attention to the fact that private ownership is superior to public ownership concerning efficiency of resource allocation (Tiemann, Schreyögg & Busse (2012). The main difference between private and public organization in this sense is the controlling of financial surplus for the benefit of organization or not. Unlike public organizations, financial surplus can be distributed as an incentive to the workers and managers in the private sector; which triggers higher self-motivation for employees. Therefore, performance level of private organizations can be better in terms of efficiency compared to their public counterparts (Hansmann, 1988; Jacobs, 1974; Clarkson (1972); cited by Tiemann, Schreyögg & Busse, 2012).
Although there is an extensive theoretical literature on the ownership and resource efficiency, empirical side seems to be a bit lacking. Currently, researchers on the efficiency and productivity analysis became highly talented to investigate the efficiency differences of the firms and/or organizations by the means of two mainstream methods including Stochastic Frontier Analysis (SFA) and Data Envelopment Analysis (DEA). Thanks to these methods which have different analytical procedures to estimate/measure efficiencies- efficiency performances of the chosen decision-making units (DMUs) are found out based on production, cost, profit and revenue frontiers (Erkoç, 2012).
In this research, efficiencies of HEIs in Turkey are estimated by employing exclusively non-parametric techniques and processes. This paper aims to estimate technical efficiencies of 123 HEIs in Turkey between 2009 and 2013 through comparing their efficiency performances as regards to their ownership by DEA. In other words, the analysis of this research sheds light on the extent to which public HEIs are using their resources in an efficient manner on the basis of their ownership within the framework of the non-parametric efficiency estimation technique.
The organization of the paper is as follows: Section II reviews the literature on the ownership and efficiency; Section III discusses the methodology. The section IV illustrates the dataset and variables that are used for this analysis and also puts forward models comprising different input/output sets. Section V summarizes the mean efficiency values for selected DEA models and examines them as well as compares the efficiency scores of universities based on their ownership structure. Section VI discusses the implications of the efficiency results and finally section VII concludes.
Ownership And Efficiency
Agency theory claims that agents like managers struggle to maximize their own utilities rather than that of the organizations’. Accordingly, the theory asserts that private organizations can face with this situation and they are more likely to achieve better efficiency scores (Fama & Jensen, 1983; Grossman & Hart, 1983; Pauly & Redisch, 1973; Newhouse & Toward, 1970; cited by Tiemann, Schreyögg & Busse, 2012). For instance, the owners of private organizations may consider profits as the measure of a manager’s success and the income of workers in private companies can depend on firm’s financial performance. However, in public organizations, the income of workers and managers are not based on the profit. According to the property-rights theory, there are mainly two advantages of owning a firm, the controlling of the management and getting the profits (Tiemann, Schreyögg & Busse, 2012).
In addition, the property-rights theory suggests that potential conflicts between owners and managers in private organizations are reduced because owners enable to sell their share or decide to change top management with respect to performance of managers. Therefore, the private ownership leads to better efficiency than other types of ownership. The public choice theory suggests politicians want to apply their politics on public organizations to gain votes, so these objectives prevent to gain more profit and to become more efficient for state-owned organizations (Cuervo & Villalonga, 2000; Tiemann, Schreyögg & Busse, 2012).
Not only consumers but also suppliers have preferences and priorities among institutional forms including private, public and non-profit sector in relation to the provision of public services. Weisbrod (1988) argues that as long as regulation of non-profit organizations (NPOs) is easier than regulation of outputs/production process/distribution of output carried out by public institutions in production of collective goods, than NPOs become more attractive to provide that particular public service provision. Moreover, heterogonous demands among the collective goods cause an institutional bifurcation between non-profit and public sector. That is to say, whilst public sector is more preferable in the markets where consumers have homogenous demand, heterogeneous demands of society in particular sectors necessitates non-profit sector for meeting the needs of this sort of consumer choice (Weisbrod, 1988).
Ben-Ner (2002) states that both NP and public-sector organizations face more obstacles for operating in the efficient levels than for-profit counterparts. That is to say, if these organizations were to produce identical goods in the same circumstances, for-profit firms would be quite advantageous to be more productive than their rivals in the public and NP sector. After saying that he points out that several contingencies like ‘size of communities, educational attainment of consumers and extent of social capital’ do influence the comparative degree of efficiency in public and non-profit organizations. On the contrary, Borzaga & Bacchiega (2003) assert that NPOs would perform well in the provision of personal and collective goods that are not provided by for-profit and public organizations efficiently due to two main reasons. Firstly, these services usually entail market and contractual failures and secondly, ‘a certain degree of redistribution from financiers to consumers’ might be needed for production to begin.
Until now, one of the components of the comparison between NPOs and governments is contingent upon the notion of cost-effectiveness of service provisions. This notion stresses the reality that means of income redistribution per se encompass both production and distribution costs. That is to say, if an institution were formed for redistribution, that institution would have administrative/bureaucratic costs in order to go on its operations. Okun (1975) clarifies this argument with “Leaky-Bucket” experiment: “However, the program (for income redistribution) has an unsolved technological problem: the money must be carried from the rich to poor in a leaky bucket. Some of it will simply disappear in transit, so the poor will not receive all the money that is taken from the rich”.
Unlike other for-profit entities that have been under scrutiny in terms of efficiency performance by researchers such as banking and airlines companies, not-for-profit motive among HEIs run either public or non-profit entrepreneurs has attracted attentions of researchers to test the fundamental arguments around incentive-efficiency dichotomy claiming that lack of profit motivation among non-profit and public organizations would lead them to operate less efficient then their for-profit counterparts (Ben-Ner, 2002). Eventually, a remarkable number of papers whose results are discussed in the following section-, have accumulated on the efficiencies of HEIs that were applied to various country cases including Britain, Sweden, Canada, Australia, China and Greece.
Non-Parametric Efficiency Measurement
So as to illustrate basic DEA model mathematically, let’s assume that each decision-making units (DMUs) use m inputs for the production of n outputs in a given technology level. X_it denotes the amount of input i (i=1, 2, …, m) produced by tth DMU(j=1, 2, …, k), whereas Y_st represents the quantity of output s (s=1, 2, …, n) produced by tth DMU (t=1, 2, …, k). The variables ur (r=1, 2, …, n) and wi (i=1, 2, …, m) are weights of each output and input, respectively. The efficiency of DMU0 can be written as:
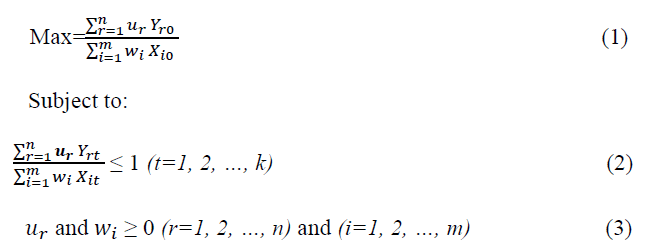
This optimization model above aims to specify best-fitted values for u and w that maximize efficiency level of the observed firm subject to all efficiency scores are less than or equal to 1. To avoid infinite solutions (Coelli et al., 2005) and obtain a linear programming model, Charnes-Cooper transformation can be used as following.
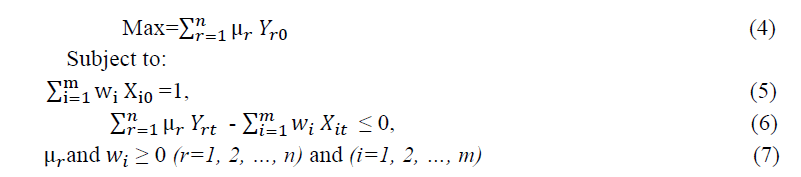
Via using duality property of linear programming, equivalent form of this envelopment system with variable-return to scale (VRS) is illustrated as:
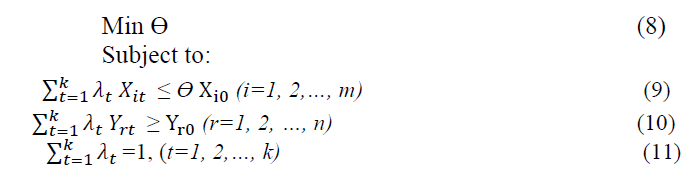
where ϴ is a scalar and λ is a k × 1 vector of constants. The solution of this linear system ends up with finding ϴs corresponding to the efficiency level of each DMU. Therefore ϴ should be less than or equal to 1 as well as the firm with ϴ=1 is technically efficient that means operating on the frontier concerning Farell’s (1957) proposition.
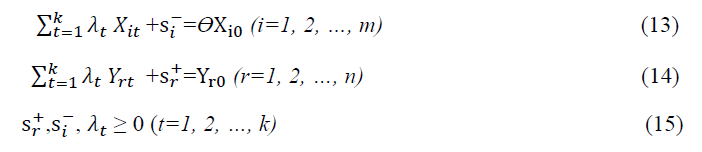
In addition to the Farell’s (1957) proposition, Koopman’s (1951) stipulates lack of “coordinate-wise improvements” to reach the best-practising frontier. Therefore, there is a precise need to integrate slack variables into the linear programming model through which efficiency scores are gauged concerning the slack usage of any input. The model becomes as follows:

Subject to:
 and
and are constrained to become non-negative and transformed inequalities into equations.
 means that
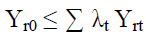 must be satisfied by every single solution, whereas
 denotes that
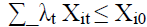 must be sustained for each input used by DMU0
As a result of all these linear programming iterations, efficiency level of the observed DMU-DMU0 in this case- is equal to 100% if and only if:.
Data, Variable And Model Specification
Higher education sector in Turkey is fundamentally consisted of public and non-profit institutions as well as supervised by The Council of Higher Education (Yüksek Öğretim Kurulu-YÖK) that is an autonomous governmental organization. This council appoints deans and rectors of the universities even non-profit ones evoking statist and patriarchal type of administration in higher education. Moreover, whereas public universities are financed by governmental budget assigned by Ministry of Education annually, tuition fees and donations are the chief resources in non-profit universities.
Financing higher education has been an essential policy issue for the government due to the fact that public universities’ individual budgets are determined and allocated by centrally planned budget scheme. The constitutional reference that describes higher education as a public service motivates government to support universities financially. Whilst the public universities are mostly sustained by “public finance”, non-profit universities have “private finance” mechanism mostly consisting of tuition fees and private donations. This private financing scheme in non-profit universities procures more autonomous administration, which results in more academic freedom and research orientated innovation. On the other hand, allocations from central budget for public universities can be enumerated as the key factor behind lower levels of autonomy in decision-making process (Darling et al., 1989).
This research covers 123 universities (29 non-profit and 94 public) existing in Turkish Higher Education between 2009 and 2013 including four full academic years, corresponding to 492 observations. The data for inputs and outputs were collected from the website of the YÖK, archives of Measurement, Selection and Placement Centre (ÖSYM) and the annual ranking reports of University Ranking by Academic Performance (URAP).
The ideal output bundle of universities consists of various fields of activity including teaching, research, community service and cooperation with business sector due to the fact that services offered by HEIs are not appealing merely to the students and academia. To reflect the contribution of universities into the society as a whole, more comprehensive data ranging from community services and the consequences of university-business sector cooperation is needed. However, lack of sufficient data on related activities does not allow researchers to map out HEIs fully, thus efficiency estimation may not be performed properly. Within this scenario, efficiencies of universities that are good at providing community services as well as developing effectual relations with business sector would culminate in downwardly biased values. Furthermore, data on the quality of outputs must be incorporated to the models which is seen as the most challenging and deficient side of efficiency analysis since the measurement of quality variables contains considerable difficulties (Abbott & Doucouliagos, 2003).
While being aware of these weaknesses and limitations, certain output variables that are currently measurable are used in this paper departing from the discussions in the literature. For HEIs in Turkey, the following variables are taken into the analysis:
1) Number of Full-time Undergraduate Students (UG): This refers to total number of registered undergraduate students within one academic year. (Graduates are excluded);
2) Number of Full-time Postgraduate Students (PG): This corresponds to total number of registered master’s and doctoral students within one academic year. (Graduates are excluded);
3) URAP’s SSCI score (SSCI): It denotes the total number of publications appeared in SCI, SSCI and AHCI indexes plus the number of publications per academic staff;
4) URAP’s Document score (DOC): This measures the total amount of scientific document (conference paper, journal articles etc.) plus the number of scientific document per academic staff;
5) URAP’s Citation score (CITE): This corresponds to the number of citations occurred during the last four academic years plus the number of citations per academic staff.
Universities produce those outputs by employing certain set of inputs. In the literature of efficiency analysis of HEIs, for input variables, expenditures of universities that are divided into different factors such as labour, material, capital, library and total expenditures are used by researchers (Katharakia & Katharakis, 2010). In this paper, similar variables are situated into the DEA model as shown below:
1) Number of Professors (PROF): It is the total number of professors including both full and part-time;
2) Number of Associated Professors (ASSOC): It represents the total number of associated professors;
3) Number of Assistant Professors (ASSIS): It corresponds to the total number of assistant professors;
4) Number of Doctoral Students (PHD): This is the total number of doctoral students.
Table 1 summarizes the data set for the all variables whose explanations are indicated above.
| Table. 1: Descriptive Statistics | |||||
| Variable | Mean | Std. Dev. | Minimum | Maximum | Obs |
|---|---|---|---|---|---|
| Output(s) | |||||
| UG | 31536.5 | 170632 | 402 | 2.26E+06 | 492 |
| PG | 1299.4 | 1908.64 | 0 | 12401 | 492 |
| SSCI | 94.5494 | 40.1064 | 0 | 192.61 | 492 |
| DOC | 93.6163 | 44.8589 | 0 | 199.12 | 492 |
| CITE | 90.2027 | 49.4611 | 0 | 199 | 492 |
| Input(s) | |||||
| PROF | 113.136 | 199.313 | 0 | 1500 | 492 |
| ASSOC | 100.773 | 122.525 | 0 | 801 | 492 |
| ASSIS | 166.041 | 148.148 | 0 | 785 | 492 |
| PHD | 401.996 | 809.147 | 0 | 5593 | 492 |
The different specifications of DEA model are needed to perform robustness checks for the efficiency values assigned to the HEIs. In this paper, each model is consisted of different sets of outputs and inputs departing from the fact that “DEA analysis can be sensitive to the variables included” as well as to reflect the theoretical discussions on the selection of variables (outputs and inputs) in the efficiency analysis of higher education (McMillan & Datta, 1998).
Alternative DEA models are developed in this research to check whether universities experience different efficiency scores when the model changes. Besides, thanks to the research weighted and teaching weighted models, universities’ expertise is illuminated concerning the specific production choices. In another model, undergraduate teaching is excluded to see the impact of Anadolu University’s highly dominance in it, as this university is the national provider of distance learning in Turkey. In all models, variable returns to scale (VRS) optimization method is applied. The illustration of these alternative models is shown below:
Model 1 is the full model that comprises all variables in the dataset, whereas Model 2 rules out undergraduate teaching to differentiate the influence of Anadolu University over to the sample. Model 3 is the only teaching output specification, takes solely the undergraduate and postgraduate teaching into account. On the contrary, Model 4 is the only research specification, which omits teaching output variables from the model. The difference of the Model 5 and 6 from the Model 3 and 4 is that doctoral students are not included into the specification in the latter bundle due to the ambiguity of the PhD students’ impact onto the teaching and research performances of the universities (Table 2).
| Table 2: Alternative Dea Models | ||||||
| Variable | Model 1 | Model 2 | Model 3 | Model 4 | Model 5 | Model 6 |
|---|---|---|---|---|---|---|
| Output(s) | ||||||
| UG | X | X | X | |||
| PG | X | X | X | X | ||
| SSCI | X | X | X | X | ||
| DOC | X | X | X | X | ||
| CITE | X | X | X | X | ||
| Input(s) | ||||||
| PROF | X | X | X | X | X | X |
| ASSOC | X | X | X | X | X | X |
| ASSIS | X | X | X | X | X | X |
| PHD | X | X | X | X | ||
Results
This section sets out the mean efficiency scores of the higher education institutions relying on the specified 6 models as well as examines the impact of ownership onto to the efficiency performances by the means of mean comparison t-test and Kruskal-Wallis ranking test. Besides Spearman Rank Correlation Coefficients are summarized to check the robustness of the individual efficiency scores of the given universities.
Efficiency Scores
| Table 3: Summary Statistics For Technical Efficiencies | |||||
| Model/Technical Efficiencies | Orientation | Mean | St. Dev. | Min | Mx. |
|---|---|---|---|---|---|
| Model 1 | Input | 0.6250 | 0.3381 | 0.0850 | 1 |
| Output | 0.7832 | 0.1936 | 0.1665 | 1 | |
| Model 2 | Input | 0.3842 | 0.2912 | 0.0462 | 1 |
| Output | 0.6608 | 0.2487 | 0.0041 | 1 | |
| Model 3 | Input | 0.3493 | 0.2650 | 0.0406 | 1 |
| Output | 0.3733 | 0.2717 | 0.0144 | 1 | |
| Model 4 | Input | 0.2681 | 0.3011 | 0.0208 | 1 |
| Output | 0.6411 | 0.2297 | 0.0046 | 1 | |
| Model 5 | Input | 0.4974 | 0.3516 | 0.0482 | 1 |
| Output | 0.4892 | 0.2757 | 0.0639 | 1 | |
| Model 6 | Input | 0.3951 | 0.4034 | 0.0208 | 1 |
| Output | 0.6548 | 0.2334 | 0.0046 | 1 | |
Mean efficiency scores of the Turkish universities are varying from one model to another as shown in the Table 3. The highest technical efficiencies are computed at Model 1 where all input and output variables are included. To this particular model, overall efficiency scores of the universities correspond to the 62% and 78% in the input and output-oriented methods respectively. When the number of undergraduate students is dropped out of the model (i.e., Model 2) dramatic shrinkage occurred, which means that bachelor students compose the significant proportion of teaching output of the universities. Moreover, the gap between the bundles of Models 3 and 4 and Models 5 and 6 indicates that inclusion of doctoral students into the input variables do matter for the efficiency performances. Mean efficiency with input orientation increased from 26% to 39% as far as the research output models are concerned.
In addition to the overall efficiency scores, the numbers of universities situated to the different efficiency intervals are demonstrated in the Table 4. Firstly, the number of full-efficient universities has the highest figure in the Model 1 (full-model) compared to the both Models 5 and 6. Secondly, even though the numbers of full-efficient universities are almost same in the Models 5 and 6, the worst performing universities refer to a greater proportion in the Model 6. Thirdly and lastly, in all three models, inefficiencies among the universities seem to be highly widespread.
Spearman Rank Correlations
| Table 4: Number Of Universities And Efficiency Intervals | |||
| Efficiency Intervals | Model 1 | Model 5 | Model 6 |
|---|---|---|---|
| Full-Efficient Universities | 175 | 134 | 135 |
| 0.8-1.0 | 69 | 11 | 7 |
| 0.6-0.8 | 40 | 28 | 15 |
| 0.4-0.6 | 54 | 43 | 14 |
| Below 0.4 | 154 | 276 | 321 |
One of the most convenient ways to check the robustness of DEA results is to calculate spearman efficiency ranking correlations between the specified models. Although mean efficiency scores may differ from model to model, high correlation between the spearman rankings would provide reliable insights at least in the efficiency rankings of the universities. To Table 5, there are moderate correlations among the many models, particularly between the Models 1 and 5, Models 3 and 5 and Models 4 and 6. The strongest correlation pair of the full model, Model 1, is the Model 5 (84%) that refers to the only teaching output specification. The weakest correlations occur between the teaching output and research output models, implying the fact that universities with teaching output orientation diverge from the universities with research output orientation on the basis of their efficiency rankings. Eventually, the higher correlation coefficients among the Models 3 and 5 (70%) as well as the Models 4 and 6 (88%) states that inclusion/exclusion of doctoral students do not have a substantial impact on the efficiency rankings of the universities.
| Table 5: Spearman Rank Correlations For Dea Models | ||||||
| Models | M1 | M2 | M3 | M4 | M5 | M6 |
|---|---|---|---|---|---|---|
| M1 | 1 | |||||
| M2 | 0.61 | 1 | ||||
| M3 | 0.60 | 0.88 | 1 | |||
| M4 | 0.56 | 0.38 | 0.25 | 1 | ||
| M5 | 0.84 | 0.55 | 0.70 | 0.32 | 1 | |
| M6 | 0.69 | 0.24 | 0.18 | 0.88 | 0.50 | 1 |
Ownership and Efficiency
The main inquiry of this research is to differentiate the performances of public and non-profit universities as far as their efficiency scores are concerned. In the following tables and figures, this question is dealt with by the classical and non-parametric tests of hypotheses. Initially, the comparison between public and non-profit universities is carried out in accordance with the Model 1 efficiency results. As indicated in the Table 6, there is an evident difference in the mean efficiency scores of public and non-profit universities. The t-statistics (3.255) rejects the null hypothesis claiming that the difference is statistically negligible. To this individual estimate, non-profit universities are performing fairly well than the public ones within the 99% confidence interval. In a similar vein, Figure 1 depicts that the dispersion of non-profit universities is narrower than the public universities as well as mean efficiency and worst performing universities are in the higher points.

Figure 1:Mean Efficiency Scores Of Public And Non-Profit Universities (Model 1).
| Table 6: Two-Group T Test With Equal Variances (Model 1) | ||||||
| Group | Obs | Mean | Std. Err. | Std. Dev. | [95% Conf. Interval] | |
|---|---|---|---|---|---|---|
| 0 | 116 | 0.713 | 0.028 | 0.302 | 0.657 | 0.769 |
| 1 | 376 | 0.597 | 0.017 | 0.344 | 0.562 | 0.632 |
| Diff | N/A | 0.115 | 0.035 | N/A | 0.045 | 0.185 |
| diff=mean(0) - mean(1), H0: diff=0 | t=3.255 | |||||
In addition to the full model analyses, Tables 7 and 8 as well as Figures 2 and 3 refer to the results of teaching and research output based models. As seen in the Table 7, even though non-profit universities have higher mean efficiency scores than their public counterparts, this difference is not statistically significant due to the fact that estimated t-value is 0.548. That is to say, efficiency performances of public and non-profit universities do not diverge evidently as far as the teaching output is concerned. On the other hand, t-value becomes significant on the basis of 90% confidence interval level, when the comparison is conducted in relation to the research output. Table 8 states that non-profit universities are more efficient than public ones when the research outputs of the universities are solely taken into consideration. Moreover, Figure-3 below indicates that there is an inverse relationship between the efficiency scores of the universities with teaching output model and the universities with research output.

Figure 2:Distribution Of Mean Efficiency Scores Of Universities (Model 1).

Figure 3:Mean Efficiency Scores Of Public And Non-Profit Universities (Models 5 And 6).
| Table 7: Two-Group T Test With Equal Variances (Model 5) | ||||||
| Group | Obs | Mean | Std. Err. | Std. Dev. | [95% Conf. Interval] | |
|---|---|---|---|---|---|---|
| 0 | 116 | 0.513 | 0.031 | 0.341 | 0.450 | 0.575 |
| 1 | 376 | 0.492 | 0.018 | 0.354 | 0.456 | 0.528 |
| Diff | N/A | 0.020 | 0.037 | N/A | -0.052 | 0.093 |
| diff=mean(0) - mean(1), H0: diff=0 | t=0.548 | |||||
| Table 8: Two-Group T Test With Equal Variances (Model 6) | ||||||
| Group | Obs | Mean | Std. Err. | Std. Dev. | [95% Conf. Interval] | |
|---|---|---|---|---|---|---|
| 0 | 116 | 0.453 | 0.037 | 0.402 | 0.379 | 0.527 |
| 1 | 376 | 0.376 | 0.020 | 0.402 | 0.336 | 0.417 |
| Diff | N/A | 0.076 | 0.042 | N/A | -0.007 | 0.16 |
| diff=mean(0) - mean(1), H0: diff=0 t=1.8010 | ||||||
In the efficiency literature, there is another method that helps researchers to differentiate the efficiencies of the decision-making units (DMUs) belonging to different groups. This test is called Kruskal-Wallis rank test, which allows examining the rankings of the DMUs as well as concluding whether the rankings are significantly distinctive or not. In this particular case, efficiency rankings of the non-profit universities are found significantly better than public universities concerning the full model (Model 1) and research output model (Model 6) as seen in the Table 9. However, this difference disappears when the teaching output becomes the only output in the model (Model 5). It is apt to state here that these findings are totally in line with the t-test results discussed in the previous paragraphs above.
| Table 9: Kruskal-Wallis Rank Test | ||||||
| Groups/Models | Model 1 | Model 5 | Model 6 | |||
|---|---|---|---|---|---|---|
| Ownership | Obs | Rank Sum | Obs | Rank Sum | Obs | Rank Sum |
| 0 | 116 | 32885 | 116 | 29759 | 116 | 31185 |
| 1 | 376 | 88393 | 376 | 91519 | 376 | 90093 |
| Chi-Squared | 10.276 | 0.757 | 3.746 | |||
| Probability | 0.0013 | 0.3841 | 0.0529 | |||
Discussion And Managerial Implications
There are number of noteworthy findings coming out of this research that may have significant implications for the managerial aspect of the higher education institutions in Turkey. First of all, Model 2 shows that the number of undergraduate students is an important output factor for universities as mean efficiency scores of that model decreases compared to the Model 1. Therefore, managers of higher education organizations should consider the number of registered students to the undergraduate programs. This finding is not surprising since one of the main goals of universities is providing diploma for students. However, managers should also take into account the qualification of education beside this outcome. The lack of the qualification causes serious problems related to image or reputation of organizations.
Moreover, analysis shows research outputs are important factor for universities. The strongest correlation pair of the full model, Model 1, is with the Model 5 (0.84). Managers should encourage academics to publish articles, conference proceedings and books by the means of promotions, sponsorships and scholarships. Citation is also a critical output factor for academic organizations, thus academics struggle to publish their research in international journals rather than national ones. At this point, it would be appropriate to state that universities are expected to lead their staffs to publish in international environment focusing particularly on the seminars and conferences organized outside the Turkey.
In the analysis, correlation between the Models 3 and 5 (70%) as well as the Model 4 and 6 (88%) indicates that inclusion/exclusion of doctoral students do not have any crucial effect on the efficiency rankings of the organizations. In fact, doctoral students are one of the main components of the academic environment, however the importance of them is not observed in the results. There may be two reasons for this issue; firstly, doctoral students write their research with their supervisors who are assistant/associate professors or professors in the universities. Because outputs of doctoral students are also outputs of other professors and these are taken into account in the Model 4 and 6, correlations between these models are high and exclusion of PhD students does not seriously affect efficiency scores. In addition, many courses are taught by professors and assisted by doctoral students and even PhD candidates organize some of the courses entirely; therefore, exclusion of them from Models 3 and 5 does not affect efficiency scores seriously. However, in fact, lack of doctoral students means the lack of assistants in universities, which may cause less additional courses that are organized for problem solving or analyzing case studies and this situation can affect the quality of education.
Furthermore, full model results imply that non-profit universities are more efficient rather than public ones. This is an interesting point because non-profit universities have been established for last years and the analyses show that they fill the gap between public organizations in the short time. There are some reasons that why non-profit ones are more efficient such as management philosophy, salary, scholarship etc. Academic staffs in non-profit organizations are not permanent; contracts are renewed for specific times based on performances. This issue triggers the improvement of academic performance such as; academic papers, conference proceedings etc. However, in public universities some of academics are permanent staffs so one of the most important antecedents of high performance is lack. Government should change this structure for public universities and each academic staff should be evaluated according to their academic performances for determined times. Secondly, non-profit organizations’ salary and encouragement policy is generally better than public universities; hence, motivation level of academic staffs may be higher in the non-profit ones. Government should also arrange the financial support policy to improve the motivation of academics for academic researches.
Conclusion
Financing higher education has been an essential policy issue for the government due to the fact that public universities’ individual budgets are determined and allocated by centrally planned budget scheme. The constitutional reference that describes higher education as a public service motivates government to support universities financially. Whilst the public universities are mostly sustained by “public finance”, non-profit universities have “private finance" mechanism mostly consisting of tuition fees and private donations. This private financing scheme in non-profit universities procures more autonomous administration, which results in more academic freedom and research orientated innovation. On the other hand, allocations from central budget for public universities can be enumerated as the key factor behind lower levels of autonomy in decision-making process.
The purpose of this paper is to estimate technical efficiencies of 123 HEIs in Turkey between 2009 and 2013 by the means of non-parametric technique named as Data Envelopment Analysis (DEA) as well as to investigate to what degree ownership influences the efficiencies of universities. In doing so, overall efficiencies of HEIs are computed on the basis of certain production models motivated by different sets of input/output. The results of those models, firstly, have shown that HEIs in Turkey are performing in unsatisfactory levels although some of them are doing fairly well. Secondly, after employing mean-comparison t-test and Kruskal-Wallis rank procedures, results indicate that efficiency scores are significantly diverging between public and non-profit universities. Accordingly, the ownership seems to matter for the efficiency performances of HEIs in Turkey, which refers that the non-profit universities are apparently more efficient than their public counterparts. Thirdly, efficiencies of universities are evidently varying from each other concerning the teaching and research output models. Consequently, even though those findings might be suffering from a number of methodological problems, they would be used as the departure points both for academic and policy-making interests.
References
- Abbott, M. & Doucouliagos, C. (2003). The efficiency of Australian universities: A data envelopment analysis. Economics of Education Review, 22(1), 89-97.
- Ben-Ner (2002). The shifting boundaries of the mixed economy and the future of the non-profit sector. Annals of Public and Cooperative Economics, 73(1), 5-40.
- Borzaga, C & Bacchiega, A. (2003). The economics of the third sector. In the study of the non-profit enterprise. Springer US.
- Clarkson, K. (1972). Some implications of property rights in hospital management. Journal of Law and Economics, 15(2), 363-84.
- Coelli, T.J., Rao, D.S.P., O'Donnell, C.J. & Battese, G.E. (2005). An introduction to efficiency and productivity analysis. Springer Science & Business Media.
- Cuervo, A. & Villalonga, B. (2000) Explaining the variance in the performance effects of privatization. Academy of Management Review, 25(3), 581-90.
- Darling, A.L., England, M.D., Lang, D.W. & Lopers-Sweetman, R. (1989). Autonomy and control: A university funding formula as an instrument of public policy. Higher Education, 18(5), 559-583.
- Erkoç, T.E. (2012). Estimation methodology of economic efficiency: Stochastic frontier analysis vs. data envelopment analysis. International Journal of Academic Research in Economics and Management Sciences, 1(1), 155-200.
- Fama, E.F. & Jensen, M.C. (1983). Separation of ownership and control. The Journal of Law and Economic, 26, 301-25.
- Farell’s, M.J. (1957). The measurement of productive efficiency. Journal of the Royal Statistical Society, 120(3), 253-290.
- Grossman, S & Hart, O. (1983). An analysis of the principal-agent problem. Econometrica; 51(1), 7-745.
- Hansmann, H. (1988). Ownership of the firm. Journal of Law, Economics & Organization, 4(2), 267-304.
- Jacobs, P. (1974). A survey of economic models of hospitals. Inquiry, 11(2), 83-97.
- Katharakia, M. & Katharakis, G. (2010). A comparative assessment of Greek universities’ efficiency using quantitative analysis. International Journal of Educational Research 49(4), 115-128.
- Koopman’s T.C. (1951). Analysis of production as an efficient combination of activities. Operations-Research-Spectrum, 13(2), 33-37.
- Lin, W.T. & Shao, B.B.M. (2006). Assessing the input effect on productive efficiency in production systems: the value of information technology capital. International Journal of Production Research, 44(09), 1799-1819.
- McMillan, M.L. & Datta, D. (1998). The relative efficiencies of Canadian universities: A dea perspective. Canadian Public Policy/Analyse de Politiques, 24(4), 485-511.
- Newhouse, J.P. & Toward, A. (1970). Theory of non-profit institutions: an economic model of a hospital. American Economic Review, 60(1), 64-74.
- Okun, A.M. (1975). Equality and efficiency: The big trade-off. Washington, DC: The Brookings Institution.
- Pauly, M.V. & Redisch, M.S. (1973). The not-for-profit hospital as a physician’s cooperative. The American Economic Review, 63(1), 87-99.
- Tiemann, O., Schreyögg, J. & Busse, R. (2012). Hospital ownership and efficiency: a review of studies with particular focus on Germany. Health Policy, 104(2), 163-171.
- Weisbrod, B.A. (1988). The non-profit economy. Harvard University Press.