Research Article: 2018 Vol: 22 Issue: 3
Convergence of The Global Cell Phone Market and Universal Cell Phone Behaviours
Matti J Haverila, Thompson Rivers University
Jenny Haverila, University of Liverpool
Abstract
Purpose: This study investigated the convergence of global cell phone markets in six countries and the possibility that specific cell phone behaviours have become universal as a consequence. In addition, the impact of national culture in the context of the same six countries was examined. Design/Methodology/Approach: The study was conducted among high school and undergraduate college students in Finland, the United Arab Emirates, China, Canada and New Zealand. Following the relevant literature review, the paper analysed 1,326 responses of respondents residing in metropolitan areas, so that 408 of the responses came from Finland, 190 from the United Arab Emirates, 314 from China, 280 from Canada and 134 from New Zealand. Findings: The results indicate that there is significant evidence of convergence in global cell phone markets, in terms of ownership during the 2000-2015. In the six countries studied, the fast pace of convergence has not, however, caused the cell phone behaviours to become fully universal, as significant differences exist in cell phone behaviours. The paper concludes with a discussion regarding the academic and managerial implications. Originality: There has been a significant movement towards full convergence, but the market is not yet there. In terms of behaviours, the results indicate lack of full convergence. Also, as regards to the cultural issues, it was discovered that the more masculine the country the less concerned the people are with cost efficiency. In addition, “Safety/security” is positively related to power distance and masculinity indicating that the higher the power distance/masculinity the more concerned the individuals are with safety and security. Also, it appears that the more masculine the country, the more dependent individuals appear to be to their cell phones.
Keywords
Mobile Communication, High School Students, Undergraduate Students, Convergence, Universals, Behaviour.
Introduction
Cell phones are one of the most important items we carry every day (D'Costa, 2013; Kannon, 2006; Srivastava, 2005) and thus they have a profound impact on our behaviour. Moreover, cell phones are deeply rooted in today’s global culture (Chen & Katz, 2009; The Economist, 2009). The ubiquitous nature of cell phone communication appears to be especially immersive among younger people (Oksman, 2006) and therefore, the market consisting of younger users is perceived to be crucial for the cell phone industry (International Telecommunications Union, 2004; Oksman, 2010). The statistics by ITU (International Telecommunications Union, 2016a) indicate that cell phone penetration has exceeded 100%, indicating possible market saturation. The penetration rates were at 108% globally. Growth rates have fallen, but according to Cellular News (2010), growth is still robust in developed markets, in spite of the fact that penetration levels are greater than 100%. The growth of cell phone subscriptions in the studied countries, in 2000-2015, is presented in Figure 1.
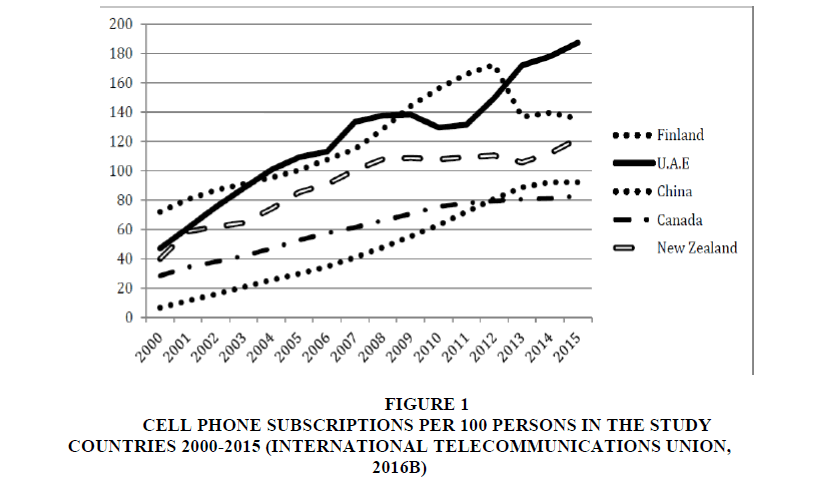
Figure 1: Cell Phone Subscriptions Per 100 Persons In The Study Countries 2000-2015 (International Telecommunications Union, 2016b)
The countries under investigation in this study had varying degrees of cell phone penetrations in 2015, with the United Arab Emirates leading the pack with 187.4 per 100 inhabitants. This is followed by 135.5 in Finland, 121.8 in New Zealand, 83.0 in Canada and 92.2 in China.
One of the key concepts in this research is the convergence phenomenon (De-Mooij & Hofstede, 2002) and many authors (Assael, 1998; Bullmore, 2000; Czinkota & Ronkainen, 2013; Jain, 1987) generally expect the dynamic convergence phenomenon to lead to homogeneous consumer needs, tastes, behaviours and lifestyles (Shim et al., 2016). It is possible that the on-going globalisation process is contributing to the convergence of income, media and technology (De-Mooij & Hofstede, 2002). The convergence of income, for example, appears very visibly in a Hans Rosling TED Talk (Rosling, 2006), where he visually demonstrated the overlapping trend of GDP per capita in the world during the last few decades. Cell phone markets have been rapidly growing during last 20-30 years, which has meant that the technology adoption curve of cell phones have been the second fastest after the Internet (Algoso, 2010). Furthermore, cell phone markets have also been converging at a very rapid rate in terms of ownership. The interesting question here is: Is the globalization and subsequent convergence of the cell phone market related to universal cell phone behaviours in the youth segment in the sample countries of this study? As regards to cause and effect, previous research has claimed that with the universal One of the key concepts in this research is the convergence phenomenon (De-Mooij & Hofstede, 2002) and many authors (Assael, 1998; Bullmore, 2000; Czinkota & Ronkainen, 2013; Jain, 1987) generally expect the dynamic convergence phenomenon to lead to homogeneous consumer needs, tastes, behaviours and lifestyles (Shim et al., 2016). It is possible that the on-going globalisation process is contributing to the convergence of income, media and technology (De-Mooij & Hofstede, 2002). The convergence of income, for example, appears very visibly in a Hans Rosling TED Talk (Rosling, 2006), where he visually demonstrated the overlapping trend of GDP per capita in the world during the last few decades. Cell phone markets have been rapidly growing during last 20-30 years, which has meant that the technology adoption curve of cell phones have been the second fastest after the Internet (Algoso, 2010). Furthermore, cell phone markets have also been converging at a very rapid rate in terms of ownership. The interesting question here is: Is the globalization and subsequent convergence of the cell phone market related to universal cell phone behaviours in the youth segment in the sample countries of this study? As regards to cause and effect, previous research has claimed that with the universal
Previous research has indicated that the cell phone behaviours among younger people are different from that of older users. Younger people use their cell phones for the purpose of social stimulation, to remain continually available, for domestic reasons, to leave themselves memos and reminders, for time-keeping, for emergency purposes and to use the phone's phonebook function (Anderson, 2015; Totten, et al., 2005). Furthermore, the convenience of the cell phone enables communication without the surveillance of parents, families and teachers (Auter, 2007; Grant, 2015).
This study analyses, on the one hand, the world telecommunications markets in terms of the convergence phenomenon; and on the other hand, the high school and undergraduate students in Finland, the United Arab Emirates, China, Canada and New Zealand in terms of cell phone behaviours. The investigation of cellular communications as part of our globalized culture is a focal research area. Thus, the first objective of this research is to investigate the convergence/divergence phenomenon in the global cell phone market and to determine whether the global cell phone market has in fact been converging or diverging and also if the global cell phone market can be said to be converged or not.
As mentioned above, the convergence phenomenon can lead to homogeneous consumer (product usage) behaviours and therefore the second objective of this research is to examine the universality of the cell phone behaviours (Aoki & Downes, 2003). Aoki and Downes (2003) investigated young people’s use and attitudes towards cell phones as opposed to behaviours. These two concepts are related as a person’s attitude affects thoughts, while his/her behaviour affects actions and therefore ‘attitude’ will be used as a preceding proxy for the actual ‘behaviour’ in this research (Ajzen, 1991; Ajzen & Fishbein, 1980; Rhodes, 2016). In spite of the fact that the Aoki and Downes (2003) research was published fifteen years ago, the research instrument has been referred to and used in many recent papers (Vanden, 2014; Balakrishnan & Gopal, 2012; Shambare, Rugimbana & Zhowa, 2012; Tessier, 2013). Consequently, the instrument can be concluded to be valid in spite of the fact that cell phones have gone through tremendous change.
Using three different methods to assess the homogeneity may indicate varying degree of universality of the cell phone behaviours. The results may have significant implications for the design and marketing of cell phones. The third research objective is to examine the impact of national borders, which act as surrogates for culture (Dawar & Parker, 1994; Ghemawat & Reiche, 2011) on the cell phone behaviours using the Hofstede cultural dimensions (Hofstede, 1980) as the theoretical framework. It is noteworthy that the original research by Hofstede on cultural dimensions has received critique, but the attractiveness of his indices has not diminished (Baskerville, 2003; McSweeney, 2002).
This exploratory research is organized as follows: Following the introduction section, the convergence of the cell phone communications technology is discussed. This includes the discussion about marketing universals. This is followed by discussion about cell phone behaviours and the Hofstede cultural dimensions. Next the methodology of the research is reviewed. After this, the data analysis will be carried out, which will be followed by the discussion. Finally, recommendations are made for future research, which is followed by the limitations review of the research.
The exploratory research conducted initially analyses the convergence of the cell phone communications technology including a discussion about marketing universals. The discussion then moves onto cell phone behaviours and the Hofstede cultural dimensions. A review of the methodology is then mentioned. A data analysis is then conducted, followed by a discussion about the results and any limitations found. Finally, recommendations are made for future research.
Theoretical Background
Age and the Use of Communications Technology
Younger people tend to use digital products and services more than older people (Kangas, Lundvall & Sintonen, 2008). Daily usage time of the Internet for example has been discovered to be longer and frequency of use has been found to be higher with youth (O’Neal et al., 2015; Pontes, Szabo & Griffiths, 2015). Peak Internet and cell phone use occurs in the 15-24 years age bracket (International Telecommunications Union, 2004). Consequently, younger people have been called the “sweet spot” of the communications industry (Charny, 2002; Goldenberg et al., 2003) especially in the case of younger males (Kennedy & Funk, 2016) because they are early adopters of new technology and new communications applications. It is no wonder that younger people are therefore the target of advanced mobile communication methods for promotional communications by the media industry (International Telecommunications Union, 2004; Luzi, 2009). At the same time the older population, however, represents more revenue potential for service providers. Moreover, the older populations are likely to favour simplicity over innovation in technology (Krasner, 2007).
More importantly, communication devices are used in different ways on the basis of user needs. Demographic variables like age have an impact on our needs (physiological, safety and security, love and belonging, esteem and self-actualization) (Loo, 2009). For example, previous research (Kannon, 2006) has indicated that more than 75 percent of mobile phone users carry a phone for a sense of security, which is particularly true among older users (over 60 years) (Oksman, 2010) and females (Haverila, 2011). As regards to social interaction among younger people (Oksman, 2010), they perceive communication technology as ‘liberating’ (Ito, Okabe & Matsuda, 2006; Oksman & Turtiainen, 2004).
Age and Cell Phone Behaviour
It has been found that young people use their cell phones in unusual ways when compared with older people (Auter, 2007; International Telecommunications Union, 2004; Lee, 2007; Rainier & Keeter, 2006). Their natural enthusiasm for new technology, higher ‘cell phone’ literacy, spare time and ‘critical mass’ effect could be contributing factors. Furthermore, the use of communication technology and cell phones are constantly changing particularly among younger people (International Telecommunications Union, 2004). Therefore, over time the perceptions and use of the cell phone are changing. Previous research has discovered that cell phone usage of people probably advances through different patterns of use similar to human development theories (Erikson, 1982; Erikson, 1998; Oksman & Rautiainen, 2003).
Regarding the actual use of cell phones, younger people are heavy users (Auter, 2007) (International Telecommunications Union, 2004) and among the first to adopt new mobile technologies and applications (International Telecommunications Union, 2004; Oksman, 2006). Oksman and Rautiainen (2003) have claimed that the cell phone is a natural, fixed and stable part of everyday life management and maintenance of social relationships for young people. Furthermore, younger people feel attached to their cell phones (Alexander, Ward & Braun, 2007; Rainier & Keeter, 2006).
Previous research has discovered that age has an impact on consumer behaviour (Cole et al., 2008; Hervé & Mullet, 2009; Lambert-Pandraud & Laurent, 2010) and some even highlight the need for more sophisticated age-based segmentation in high involvement consumer decision-making (Simcock, Sudbury & Wright, 2006) such as electronics (Suh, 2009). In the area of cell phone communication, Aoki and Downes (2003) discovered there are 30 different cell phone behaviours, which the researchers were able to collapse into six unique behavioural factors as follows: Necessity in modern times, cost efficiency, safety/security, dependency, negatives and functionality. These variables and factors will be used as the analytical framework for the study.
In conclusion, cell phone communication research has primarily been done among university undergraduate students (Aoki & Downes, 2003; Auter, 2007; Economides & Grousopoulou, 2009; I??klar & Büyüközkan, 2007; Oksman & Rautiainen, 2002; Oksman & Turtiainen, 2004). The research regarding the convergence of the cell phone market and the cell phone behaviours in various countries is scarce, however (Lee, 2007).
Convergence and Marketing Universals
As indicated earlier, convergence is a phenomenon that leads to homogeneous consumer needs, tastes and lifestyles. Divergence has the opposite effect to convergence. De-Mooij and Hofstede (2002) used the measure of convergence, which is the coefficient of variation (CV), where the standard deviation of a variable (e.g. ownership) is divided by its mean across countries at various points of time (Williamson & Fleming, 1996). In addition, Williamson and Fleming (1996) also measured the mean rate of convergence/divergence per year. De-Mooij and Hofstede (2002) specify that a CV below 0.30 indicates convergence across countries.
As an example of converged markets in Europe in terms of ownership, De-Mooij and Hofstede (2002) specify televisions (CV=0.11), telephone main lines (CV=0.17), automobiles (CV=0.18), sales of household cleaning products (CV=0.24) and consumption of soft drinks (CV=0.29) to be converged. Regarding the rate of convergence, it was mentioned that between 1960 and 1997 the rate of convergence in Europe for television ownership was 2.4%. For radio ownership, the average annual rate of divergence was 0.2%. Their conclusion was that “countries converge with respect to relatively recent media (e.g. televisions) whereas they diverge with respect to relatively old media (e.g. radio or newspapers)” (De-Mooij and Hofstede, 2002). Thus, one could expect that cell phone markets would be converging in terms of ownership on a global basis.
De-Mooij and Hofstede (2002) also mention that “although there is evidence of converging economic systems in Europe, there is no evidence of converging value systems”. In fact, they deduced that there is evidence that consumer behaviour is diverging in Europe by saying that “converging technology and disappearing income differences across countries will not lead to homogenization of consumer behaviour. Rather, consumer behaviour will become more heterogeneous because of cultural differences”. From the point of view of this research, the notion by De-Mooij and Hofstede (2002) of the existence of global teenagers is interesting due to the age range of the sample population of this study (young people between 15 and 25 years). Global teenagers possess similar values regardless of their country of origin (Assael, 1998).
Marketing universal is a concept related to the convergence phenomenon. Dawar and Parker (1994) define “marketing universals as consumer behaviours within a segment and toward a particular product category that are invariant across national cultures”. Against this definition, the assessment of the universal nature of cell phone behaviours, as defined by Aoki and Downes (2003), is appropriate because the context of the study is the youth (segment) and the product category is cell phones. The issue here is that if cell phone behaviours are universal, managers should consider not using national borders as the basis of segmentation; rather individual criteria should be used as segmentation criteria.
Dawar and Parker (1994) state that nationality is typically used as a surrogate for culture due to the fact that all members of a given nation share a similar history, language, political and educational environment. Thus the internal communality within samples determines the operational definition of national culture in most cross-cultural studies in marketing. They also emphasize that consumer behaviour is “culture bound”, when national borders are the basis for segmentation. This is typically the case in many food products where local adaptation strategies are needed. Many other products (e.g. medical products) are culture-independent (Dawar & Parker, 1994).
Thus, the issue in this study is the investigation of national (culture bound) versus individual segmentation strategy. The testing of the marketing universality in the Dawar and Parker (1994) study was done on three levels as follows: (1) Whether specific consumer behaviours exist in a national culture, (2) whether the relative order of importance across national cultures is the same and finally (3) whether the absolute level of behaviours is the same across national cultures. The simple existence is not perceived to be sufficient criteria for the presence of marketing universal and thus more rigorous tests are needed.
Rank order is the assessment criteria for the second level and the detection of significant differences is the assessment criteria for the third level. As regards to the third level, Dawar and Parker (1994) underline, however, that the emphasis should be in the discovery of managerially relevant (substantive) differences rather than statistical differences. This means that statistical differences might exist between populations, but whether these differences are managerially meaningful is another issue (Sawyer & Peter, 1983).
Dimensions of National Culture
The assessment of the differences in national culture is in many cases done using the dimensions developed by Hofstede (1980). The original study concluded that there are four dimensions according to which the various cultures can be assessed. These are Power Distance (PDI), Individualism/Collectivism (IDV), Masculinity/Femininity (MAS) and Uncertainty Avoidance (UAI). Later on, a fifth dimension, Long-Term versus Short-Term Orientation (LTO) was introduced. This was not used, however, in this research due to insufficient data. All dimensions were originally measured with an index ranging from 0 to 100. Some countries that were not part of the original study can, however, have an index with a value over 100. The four original dimensions will be briefly discussed in the following paragraphs.
Power distance (PDI) has been defined as the extent to which less powerful members of a society accept and expect the power to be distributed unequally (Hofstede, 2013). In countries like Saudi Arabia (PDI index 95) and China (PDI index 80) every person has his/her equitable place in a society, older people are respected and status is an important element of power. In countries with relatively low power distance like Canada (PDI index 39), New Zealand (PDI index 22) and Finland (PDI index 33) people try to look younger and the powerful people try to look less powerful (De-Mooij & Hofstede, 2002; Hofstede, 2013).
Individualism (IDV) has been defined as a preference for a loosely-knit social framework in which individuals are expected to take care of themselves and their immediate families only. The opposite of individualism has been called collectivism and represents a preference for a tightly-knit framework in society in which individuals can expect their relatives or members of a particular in-group to look after them in exchange for unquestioning loyalty (Hofstede, 2013). Individualistic cultures appreciate more explicit verbal communication, whilst in collectivistic cultures communication is more implicit. Thus, individuals in collectivistic countries like the United Arab Emirates (IDV index 25) and China (IDV 20 index) are more concerned about personal ties, belonging to a group, acceptance and respect in a group and tend to distrust people outside their group. In relatively individualistic countries like Canada (IDV index 80), New Zealand (IDV index 79) and Finland (IDV index 63), individuals are more likely to leave the parental home at a younger age and also prefer to live alone than with a friend or acquaintance.
The masculinity (MAS) dimension signifies a preference in society for achievement, heroism, assertiveness and material reward for success and thus the society is more competitive. Femininity on the other hand indicates a preference for cooperation, modesty, caring for the weak and quality of life and thus the society is more consensus-oriented (Hofstede, 2013). Thus, individuals in relatively masculine countries like China (MAS index 66), New Zealand (MAS index 58), Canada (MAS index 52) and the United Arab Emirates (MAS 50 index) have communication styles that are more direct, concise and unemotional. In relatively feminine countries like Finland (MAS index 26), individuals are more likely to appreciate gender equality and thus there are less prescriptive role behaviours linked to each gender.
Finally, the Uncertainty Avoidance (UAI) dimension states the degree to which the members of a society feel uncomfortable with uncertainty and ambiguity. The issue here is how a society deals with the fact that the future can never be known. Thus, the question is that should we try to control the future or just let it happen (Hofstede, 2013). Countries having strong a UAI index like the United Arab Emirates (UAI index 80) or a relatively strong UAI index like Finland (UAI index 59), New Zealand (UAI index 49) and Canada (UAI index 48) have (relatively) rigid codes of belief and behaviour and do not like unorthodox behaviour and ideas. Countries with a weak UAI index like China (UAI index 30) maintain a more relaxed attitude where practice counts more than principles (Hofstede, 2013).
Methodology
Sample
The respondents for the behavioural part of the study are high school and undergraduate students located in the metropolitan areas in Finland, the United Arab Emirates, China, Canada and New Zealand as data collection was conveniently available in these countries. The sampling method applied was cluster sampling (Hoang, 2007). The cluster was high school and higher education students. An e-mail with a link to an Internet survey was sent to the respondents. English was used as the language in the survey as all respondents had good command of this language. The respondents were between 15 and 25 years of age. See Table 1 for a breakdown of respondent characteristics. Dawar and Parker (1994) point out that taking a random sample in multiple countries is not appropriate for the studies of marketing universals where the focus is a particular product launched in several markets and targeted to a specific market segment.
| Table 1 Sample Population |
||
| # of respondents | Average age (Standard deviation) | |
| Finland | 408 | 21.35 (4.14) |
| United Arab Emirates | 190 | 19.14 (2.46) |
| China | 314 | 17.63 (1.88) |
| Canada | 280 | 19.20 (2.26) |
| New Zealand | 134 | 21.66 (3.60) |
| Total | 1326 | 19.73 (3.42) |
Measurement and Questionnaire Development
In order to calculate the CV, the cell phone ownership statistics provided by ITU (International Telecommunications Union, 2016b) were used in this study. As mentioned, the measure of convergence, the CV, is calculated by dividing the standard deviation of a variable (ownership) by its mean across countries at various points in time.
The cell phone attitudes (Appendix) as developed by Aoki and Downes (2003) were used preceding proxy for the actual ‘behaviour’. We asked the respondents to indicate their preference to the behaviours using an Internet-based questionnaire with a Likert type scale 1-7 (1=very unimportant, 7=very important).
Method
JMP software (version 13 for Mac) by SAS was used for the statistical analysis. To meet our first research objective, i.e. the convergence/divergence phenomenon in the global cell phone market, we calculated the means and standard deviations of cell phone ownership in 198 countries using the data provided by ITU (International Telecommunications Union, 2016). The time frame was 2000-2015. Second, the differences in cell phone behaviours and behavioural factors between the countries were assessed using ANOVA. Third, the analysis was done so that all countries were included in the data set when assessing the convergence of the cell phone markets. Fourth, the analysis was carried out on a country by country basis in order to assess the universality of cell phone behaviours when all six countries were present in the analysis, as well as on a country by country basis. Finally, the relationship between the cell phone behaviours and Hofstede cultural dimensions was examined using ANOVA.
Data Analysis And Discussion
Convergence Data
The convergence results in terms of cell phone ownership in 198 countries can be seen in Table 2 and are also demonstrated in Figures 2 and 3. The remaining countries which did not have complete data in the ITU (International Telecommunications Union, 2016b) statistics during 2000-2015 were excluded from this analysis. These countries were typically very small and thus the impact of this exclusion is negligible. The results in Table 2 are based on the fact that the average ownership (cell phone subscriptions per 100 people) has been increasing by about 13.43% p.a. between 2000 and 2015. At the same time the standard deviation has also increased, but by a much lower rate of 4.23% and also, since 2006, the standard deviation has stabilized too slightly above 40. In other words, the dualization of cell phone ownership in the 198 countries has moderated.
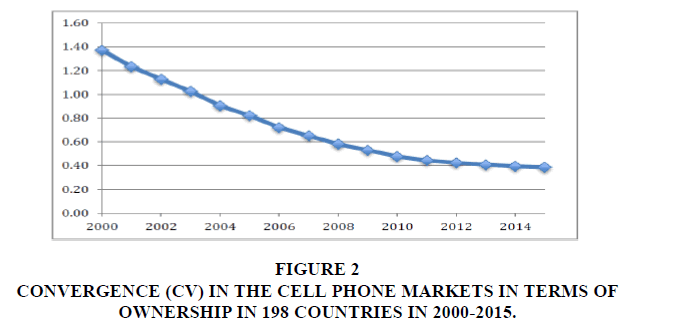
Figure 2: Convergence (cv) in the cell phone markets in terms of ownership in 198 countries in 2000-2015.
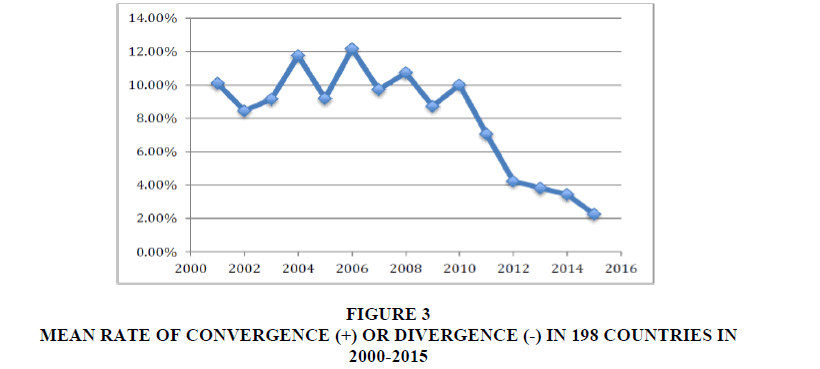
Figure 3: Mean Rate Of Convergence (+) Or Divergence (-) In 198 Countries In 2000-2015
The values in Table 2 indicate that the cell phone markets have been converging in terms of ownership as the convergence values (CV) have decreased dramatically. As mentioned, De-Mooij and Hofstede (2002) used 0.30 as a threshold value, meaning that the market is converged if the value is below 0.30. Since the latest convergence value in 2015 was still above 0.30, it is apparent that the cell phone market is not yet fully converged on a global basis in terms of ownership. Therefore, one might also expect that there are still significant differences in cell phone behaviours between the countries present in this study and thus the behaviours are not yet universal.
| Table 2 Convergence (Cv) And Speed Of Convergence In The Cell Phone Markets In Terms Of Ownership In 198 Countries In 2000-2015 (International Telecommunications Union, 2016b) |
||||
| Average ownership | Standard deviation | CV | Speed of convergence | |
| 2000 | 16.38 | 22.46 | 1.37 | - |
| 2001 | 21.42 | 26.40 | 1.23 | 10.11% |
| 2002 | 25.74 | 29.04 | 1.13 | 8.47% |
| 2003 | 30.94 | 31.71 | 1.02 | 9.15% |
| 2004 | 37.32 | 33.75 | 0.90 | 11.76% |
| 2005 | 45.43 | 37.31 | 0.82 | 9.20% |
| 2006 | 55.78 | 40.23 | 0.72 | 12.16% |
| 2007 | 65.07 | 43.02 | 0.65 | 9.73% |
| 2008 | 75.57 | 43.93 | 0.58 | 10.74% |
| 2009 | 82.95 | 44.01 | 0.53 | 8.73% |
| 2010 | 90.05 | 42.99 | 0.48 | 10.01% |
| 2011 | 96.08 | 42.63 | 0.44 | 7.06% |
| 2012 | 100.5 | 42.71 | 0.42 | 4.22% |
| 2013 | 104.1 | 42.53 | 0.41 | 3.81% |
| 2014 | 106.3 | 41.94 | 0.39 | 3.43% |
| 2015 | 108.4 | 41.80 | 0.39 | 2.25% |
When looking at Figure 3, which demonstrates the speed of convergence in the 198 countries, it can be said that the speed of convergence has been very fast and much faster than in any of the markets mentioned in the De-Mooij and Hofstede (2002) study. The average speed of convergence between 2001 and 2015 was 10.11%, which slowed to 2.25% in 2015. Whether the speed of convergence in 2015 will remain at a much lower level remains to be seen. It is quite likely that passing underneath the convergence level of 0.30 in the cell phone market in terms of ownership will still take a few years.
Descriptive Statistics and Tests of the Cell Phone Behaviour Universality
As mentioned in the literature review, the Aoki and Downes (2003) cell phone behaviours and factors (i.e., linear aggregation of the relevant behaviours) are used as the analytical framework for the study. Furthermore, the testing procedure of marketing universals necessitates a matched sample of respondents across countries in order to prevent attributing differences (Dawar & Parker, 1994). This was the case in this study due to the fact that all respondents were students between 15 and 25 years old.
Table 3 includes the mean values and standard deviations of the behavioural variables and factors in the data set. The behaviour number 19 “With a cell phone I can keep in touch with my family members” was perceived to be the most important one and the behaviour number 26 “I am often distracted by my cell phone when driving” was perceived to be the least important cell phone behaviour among all respondents. The behavioural factor “Safety and security” was perceived to be the most important and the factor” Non-calling functionality” was the least important behavioural factor.
The first criterion for the existence of marketing universal was whether specific consumer behaviours exist in a culture. As the data in Tables 3 and 4 reveals, most behaviours and behavioural factors scored higher than 4 on the 7-point Likert scale. Those factors with a score just below 4 had standard deviation of at least 1.5 indicating that all behaviours meet the first criteria for the existence of marketing universal. The simple existence of a behaviour is not, however, sufficiently informative in the marketing context (Dawar & Parker, 1994).
| Table 3 Importance Of Cell Phone Behaviours In All Countries (1=Very Unimportant, 7=Very Important) |
||
| # | Variables/factors | Mean (Std. Dev.) |
| 1 | Time efficiency | 4.99 (1.61) |
| 2 | Wasted time | 4.39 (1.80) |
| 3 | Successful | 5.17 (1.68) |
| 4 | Multi-tasking | 5.03 (1.67) |
| 5 | Out-of-touch | 4.69 (1.88) |
| 6 | Brand | 4.57 (1.92) |
| 7 | Re-schedule appointments | 4.28 (1.97) |
| Factor 1 | Necessity in modern times | 4.73 (1.26) |
| 8 | Financially beneficial | 4.36 (1.79) |
| 9 | Affordable | 4.23 (1.79) |
| 10 | Cell phone instead | 4.23 (1.88) |
| 11 | Long distance calls | 3.80 (1.81) |
| 12 | Cell phone cheaper | 3.74 (1.90) |
| Factor 2 | Cost efficiency | 4.07 (1.53) |
| 13 | Safe at night | 4.94 (1.87) |
| 14 | In touch with parents | 5.05 (1.85) |
| 15 | Not worry | 4.84 (1.88) |
| 16 | Safe driving | 4.12 (1.93) |
| 17 | Emergency | 4.73 (1.98) |
| 18 | My parent | 4.61 (1.83) |
| 19 | Family members | 5.74 (1.40) |
| Factor 3 | Safety/security | 4.86 (1.34) |
| 20 | Disconnected | 5.23 (1.83) |
| 21 | Lost | 4.87 (1.93) |
| 22 | Always on | 5.30 (1.85) |
| 23 | Upset | 3.57 (1.79) |
| Factor 4 | Dependency | 4.74 (1.44) |
| 24 | Distracts | 3.73 (1.77) |
| 25 | Embarrassed | 4.85 (1.76) |
| 26 | Distracts driving | 3.40 (1.77) |
| 27 | Accessible | 3.59 (1.87) |
| 28 | Addictive | 4.39 (1.93) |
| Factor 5 | Negatives | 3.99 (1.23) |
| 29 | Learn non-calling functions | 3.83 (1.98) |
| 30 | Use non-calling functions | 3.67 (1.98) |
| Factor 6 | Non-calling functionality | 3.75 (1.70) |
| Table 4 Mean Values And Standard Deviations Of Cell Phone Behaviours (1=Very Unimportant, 7=Very Important)* |
||||||
| # | Behavioural variable | Finland | UAE | China | Canada | New Zealand |
| 1 | Time efficiency** | 5.08 (1.42) | 5.25 (1.69) | 4.71 (1.65) | 4.70 (1.70) | 5.63 (1.49) |
| 2 | Wasted time** | 4.03 (1.82) | 4.39 (1.88) | 4.61 (1.70) | 4.21 (1.72) | 5.32 (1.59) |
| 3 | Successful** | 5.05 (1.66) | 5.45 (1.70) | 5.11 (1.60) | 5.02 (1.72) | 5.62 (1.74) |
| 4 | Multi-tasking** | 4.79 (1.79) | 5.32 (1.77) | 4.97 (1.54) | 4.90 (1.69) | 5.80 (1.42) |
| 5 | Out-of-touch** | 4.50 (1.92) | 5.04 (1.98) | 4.73 (1.80) | 4.45 (1.89) | 5.13 (1.60) |
| 6 | Brand* | 4.37 (1.98) | 4.74 (2.09) | 4.77 (1.81) | 4.48 (1.85) | 4.67 (1.82) |
| 7 | Re-schedule appointments** | 4.03 (1.87) | 4.66 (2.06) | 4.34 (1.89) | 4.04 (1.99) | 4.87 (2.09) |
| 8 | Financially beneficial** | 4.88 (1.54) | 4.24 (1.99) | 4.03 (1.75) | 4.20 (1.92) | 4.10 (1.96) |
| 9 | Affordable** | 5.12 (1.38) | 3.78 (1.90) | 3.84 (1.69) | 3.83 (1.81) | 3.91 (1.91) |
| 10 | Cell phone instead** | 5.08 (1.61) | 3.66 (1.95) | 4.07 (1.67) | 3.92 (1.91) | 3.50 (2.01) |
| 11 | Long distance calls** | 4.60 (1.48) | 3.65 (1.86) | 3.91 (1.70) | 3.36 (1.82) | 2.34 (1.68) |
| 12 | Cell phone cheaper** | 4.66 (1.71) | 3.22 (1.84) | 3.54 (1.74) | 3.58 (1.96) | 2.50 (1.51) |
| 13 | Safe at night** | 4.57 (1.94) | 5.33 (1.95) | 4.84 (1.63) | 4.97 (1.81) | 5.69 (1.91) |
| 14 | In touch with parents** | 4.33 (1.87) | 5.64 (1.87) | 5.59 (1.50) | 5.11 (1.78) | 5.07 (1.91) |
| 15 | Not worry** | 4.13 (1.88) | 5.55 (1.78) | 5.40 (1.57) | 4.81 (1.85) | 4.72 (2.00) |
| 16 | Safe driving** | 3.61 (1.85) | 4.52 (2.01) | 4.42 (1.66) | 4.08 (1.96) | 4.48 (2.20) |
| 17 | Emergency** | 4.16 (1.98) | 5.28 (2.01) | 5.55 (1.45) | 4.56 (1.90) | 4.15 (2.32) |
| 18 | My parent** | 4.34 (1.81) | 5.31 (1.84) | 4.77 (1.74) | 4.70 (1.73) | 3.90 (1.86) |
| 19 | Family members** | 5.75 (1.17) | 6.01 (1.41) | 5.83 (1.37) | 5.41 (1.62) | 5.84 (1.47) |
| 20 | Disconnected** | 4.91 (1.90) | 5.73 (1.79) | 5.25 (1.69) | 5.03 (1.88) | 5.84 (1.61) |
| 21 | Lost** | 4.51 (2.02) | 5.43 (1.90) | 5.01 (1.75) | 4.67 (2.01) | 5.31 (1.70) |
| 22 | Always on** | 5.19 (1.91) | 5.50 (1.97) | 5.03 (1.79) | 5.30 (1.78) | 6.04 (1.58) |
| 23 | Upset** | 3.01 (1.74) | 3.56 (1.98) | 4.00 (1.66) | 3.67 (1.84) | 4.04 (1.34) |
| 24 | Distracts** | 3.14 (1.62) | 3.69 (1.98) | 4.31 (1.61) | 4.26 (1.59) | 3.07 (1.80) |
| 25 | Embarrassed** | 4.58 (1.84) | 4.72 (1.97) | 5.33 (1.40) | 4.81 (1.90) | 4.75 (1.42) |
| 26 | Distracts driving** | 3.03 (1.65) | 3.55 (1.85) | 3.76 (1.61) | 3.37 (1.90) | 3.54 (1.85) |
| 27 | Accessible** | 3.44 (1.88) | 3.80 (2.03) | 3.89 (1.61) | 3.64 (1.86) | 2.98 (2.02) |
| 28 | Addictive** | 3.93 (1.93) | 4.68 (2.07) | 4.30 (1.73) | 4.83 (1.81) | 4.68 (2.12) |
| 29 | Learn non-calling functions** | 3.46 (1.83) | 3.71 (2.09) | 5.00 (1.62) | 3.26 (1.93) | 3.60 (2.07) |
| 30 | Use non-calling functions** | 3.88 (1.90) | 3.82 (2.06) | 3.45 (1.86) | 3.31 (2.04) | 4.07 (2.14) |
*) ** significance at<0.001, * significance at<0.05
It is important to note that the shading in Tables 3 and 4 signifies the factors in the Aoki and Downes (2003) study as follows: “Necessity in modern times” (variables 1-7), “Cost efficiency” (variables 8-12), “Safety/security” (variables 13-19), “Dependency” (variables 20-23), “Negatives” (variables 24-28) and “Non-calling functionality” (variables 29-30).
For the second and more rigorous level for the assessment of the existence of universal cell phone behaviours, the means and standard deviations of the behavioural factors (i.e. linear aggregation of the behavioural variables of the Aoki and Downes (2003) study) and the rank order of the behavioural factors in the study countries are presented in Table 5.
| Table 5 Mean Values And Rank Order Of The Cell Phone Behavioural Factors In The Study Countries (1=Very Unimportant, 7=Very Important)* |
|||||||||||
| # | Behavioural factor | Finland | UAE | China | Canada | New Zealand | |||||
| Mean (Std. Dev.) | Rank | Mean (Std. Dev.) | Rank | Mean (Std. Dev.) | Rank | Mean (Std. Dev.) | Rank | Mean (Std. Dev.) | Rank | ||
| F1 | Necessity in modern time | 4.55 (1.20) | 2 | 4.98 (1.23) | 3 | 4.75 (1.22) | 3 | 4.54 (1.29) | 3 | 5.29 (1.26) | 2 |
| F2 | Cost efficiency | 4.87 (1.20) | 1 | 3.71 (1.53) | 6 | 3.88 (1.48) | 6 | 3.78 (1.55) | 5 | 3.27 (1.51) | 6 |
| F3 | Safety/security | 4.41 (1.27) | 3 | 5.38 (1.42) | 1 | 5.20 (1.18) | 1 | 4.81 (1.28) | 1 | 4.84 (1.46) | 3 |
| F4 | Dependency | 4.41 (1.44) | 4 | 5.05 (1.43) | 2 | 4.82 (1.37) | 2 | 4.67 (1.49) | 2 | 5.31 (1.19) | 1 |
| F5 | Negatives | 3.62 (1.14) | 6 | 4.09 (1.41) | 4 | 4.32 (1.16) | 4 | 4.18 (1.17) | 4 | 3. 81 (1.18) | 5 |
| F6 | Non-calling functionality | 3.67 (1.61) | 5 | 3.77 (1.95) | 5 | 4.23 (1.25) | 5 | 3.29 (1.82) | 6 | 3.84 (1.96) | 4 |
When looking at the rank orders of the behaviour factors (Table 6) it can be said that strictly speaking there is a lack of coherence in the rank orders. A more careful analysis reveals, however, that the general rank order of the behaviour factors follows the same general pattern. In the case of Factor 1 (Necessity in modern times), the rankings were 2, 3, 3, 3, 2 and for Factor 3 (Safety/security), the rankings were 3, 1, 1, 1, 3. Also in the case of Factor 5 (Negatives), the rankings were 6, 4, 4, 4, 5 and for Factor 6 (Non-calling functionality), the rankings were 5, 5, 5, 6, 4 for Finland, the UAE, China, Canada and New Zealand, respectively. Therefore, it can be concluded that Factors 1 (Necessity in modern times), 3 (Safety/security), 5 (Negatives) and 6 (Non-calling functionality) are universal.
| Table 6 The analysis of variance results for the cell phone behaviour factors. |
|||||
| # | Behavioural factor | Degrees of freedom between groups | Degrees of freedom within groups | F ratio | Significance |
| F1 | Necessity in modern times | 4 | 1321 | 12.65 | <0.0001 |
| F2 | Cost efficiency | 4 | 1321 | 49.68 | <0.0001 |
| F3 | Safety/security | 4 | 1321 | 25.28 | <0.0001 |
| F4 | Dependency | 4 | 1321 | 13.89 | <0.0001 |
| F5 | Negatives | 4 | 1321 | 18.54 | <0.0001 |
| F6 | Non-calling functionality | 4 | 1321 | 18.54 | <0.0001 |
Regarding Factor 2 (Cost efficiency), it can be said that this factor is universal in the UAE, China, Canada and New Zealand (rankings 6, 6, 5, 6, respectively) but Finland cannot be included because this factor was perceived to be the most important one by the Finnish respondents (ranking 1). Similarly, Factor 4 (Dependency) posed quite different rankings (4, 2, 2, 2, 1) and again Finland cannot be included because this factor was perceived to be the fourth (ranking 4) most important one by the Finnish respondents. In fact, with the exception of Finland regarding two behavioural factors (Factor 2 Cost efficiency and Factor 4 Dependency) it can be said the cell phone behaviours can be deemed to be universal in the countries present in this study. Universality in rank order does not imply, however, that each behaviour is important to the same extent across cultures (Dawar & Parker, 1994).
For the third and most stringent level in the assessment, i.e. the existence of universal cell phone behaviours, it is required that there are no statistically significant and/or managerially meaningful differences between the absolute level of behaviour across cultures (Table 6). In this case, it is probable that the individual differences dominate cultural differences in explaining behaviour (Dawar & Parker, 1994). The analysis of variance results for the cell phone behaviour factors can be seen Table 6.
In case the sample size is relatively large, it is likely that there will be statistically significant differences at normal levels of significance criteria requirement (0.05 or 0.01 for example) and therefore meeting the strict statistical significance criteria will be challenging. When looking at the individual behaviours, when all six countries were present in the data set (Table 4), all behaviours were significantly different from each other at a level of 0.001 except the “Brand” behaviour in which the level of significance was 0.05. Similarly, when all six countries were present in the data set, the analysis also revealed that there were significant differences in all behavioural factors (Table 6).
When the statistical analysis was conducted on a country by country basis, there were significant differences on the behavioural factor level (Table 7) and behavioural variable level (Table 8), but not in every country by country pairing. At the behavioural factor level, the most similar country pairing was the UAE and New Zealand (3 out of 6 statistically significantly different factors) and the most dissimilar countries were China/Finland and China/New Zealand (6 out of 6 statistically significantly different factors). The most amount of similarity was shown for Factor 5 (Negatives) in which case 5 out of 10 country pairings did not show any statistically significant differences. The most amount of dissimilarity was shown for Factor 1 (Necessity in modern times) in which case 9 out of 10 country pairings did show statistically significant differences. To conclude, it can be said that regarding the third and most stringent level of assessment using statistical significance testing procedure, the cell phone behaviours are not universal in absolute importance.
| Table 7 Significant Differences In Cell Phone Behavioural Factors Between The Countries |
||||||||||||
| # | Behavioural factor | Finland vs. | UAE vs. | China vs. | Canada vs. | # of significant differences | ||||||
| UAE | China | Canada | NZ | China | Canada | NZ | Canada | NZ | NZ | |||
| 1 | Necessity in modern times | ** | * | - | ** | ** | ** | * | * | ** | ** | 9/10 |
| 2 | Cost efficiency | ** | ** | ** | ** | - | - | * | - | ** | ** | 7/10 |
| 3 | Safety/security | ** | ** | ** | ** | ** | ** | ** | ** | ** | - | 9/10 |
| 4 | Dependency | ** | ** | * | ** | * | ** | - | - | ** | ** | 8/10 |
| 5 | Negatives | ** | ** | ** | - | - | - | - | - | ** | ** | 5/10 |
| 6 | Functionality | - | ** | ** | - | ** | ** | - | ** | * | ** | 7/10 |
| # of significant differences | 5/6 | 6/6 | 5/6 | 4/6 | 4/6 | 4/6 | 3/6 | 3/6 | 6/6 | 5/6 | ||
*p<0.05, ** p<0.01
| Table 8 Significant Differences In Cell Phone Behaviours Between The Countries |
|||||||||||||
| # | Finland vs. | UAE vs. | China vs. | Canada vs. | # of significant differences | ||||||||
| UAE | China | Canada | NZ | China | Canada | NZ | Canada | NZ | NZ | ||||
| 1 | Time efficiency | - | ** | ** | ** | ** | ** | * | - | ** | ** | 8/10 | |
| 2 | Wasted time | * | ** | - | - | - | - | ** | ** | ** | ** | 6/10 | |
| 3 | Successful | ** | - | - | - | * | ** | - | - | ** | ** | 5/10 | |
| 4 | Multi-tasking | ** | - | - | - | * | ** | ** | - | ** | ** | 6/10 | |
| 5 | Out-of-touch | ** | - | - | - | - | ** | - | - | * | ** | 4/10 | |
| 6 | Brand | * | * | - | - | - | - | - | * | - | - | 3/10 | |
| 7 | Re-schedule appointments | ** | * | - | - | - | ** | - | - | ** | ** | 5/10 | |
| 8 | Financially beneficial | ** | ** | ** | ** | - | - | - | - | - | - | 4/10 | |
| 9 | Affordable | ** | ** | ** | ** | - | - | - | - | - | - | 4/10 | |
| 10 | Cell phone instead | ** | ** | ** | ** | - | - | - | - | ** | * | 6/10 | |
| 11 | Long distance calls | ** | ** | ** | ** | - | - | ** | ** | ** | ** | 8/10 | |
| 12 | Cell phone cheaper | ** | ** | ** | ** | - | * | ** | - | ** | ** | 8/10 | |
| 13 | Safe at night | ** | * | ** | ** | - | * | - | - | ** | ** | 7/10 | |
| 14 | In touch with parents | ** | ** | ** | ** | - | ** | * | ** | ** | - | 8/10 | |
| 15 | Not worry | ** | ** | ** | ** | - | ** | ** | ** | ** | ** | 9/10 | |
| 16 | Safe driving | ** | ** | ** | ** | - | ** | - | * | - | - | 6/10 | |
| 17 | Emergency | ** | ** | ** | ** | - | ** | ** | ** | ** | - | 8/10 | |
| 18 | My parent | ** | - | ** | ** | ** | ** | ** | - | ** | ** | 8/10 | |
| 19 | Family members | * | - | ** | ** | - | ** | - | ** | - | ** | 6/10 | |
| 20 | Disconnected | ** | * | - | - | ** | ** | - | - | ** | ** | 6/10 | |
| 21 | Lost | ** | ** | - | - | * | ** | - | * | - | * | 6/10 | |
| 22 | Always on | - | - | - | - | ** | - | ** | - | ** | ** | 4/10 | |
| 23 | Upset | ** | ** | ** | ** | ** | - | * | * | - | * | 8/10 | |
| 24 | Distracts | ** | ** | ** | ** | ** | ** | ** | - | ** | ** | 9/10 | |
| 25 | Embarrassed | - | ** | - | - | ** | - | - | ** | ** | - | 4/10 | |
| 26 | Distracts driving | ** | ** | * | * | - | - | - | ** | - | - | 5/10 | |
| 27 | Accessible | * | ** | - | - | - | - | ** | - | ** | ** | 5/10 | |
| 28 | Addictive | ** | ** | ** | ** | * | - | - | ** | * | - | 7/10 | |
| 29 | Learn non-calling functions | - | ** | - | - | ** | * | - | ** | ** | - | 5/10 | |
| 30 | Use non-calling functions | - | ** | ** | ** | * | ** | - | - | ** | ** | 7/10 | |
| # of significant differences | 25/30 | 24/30 | 18/30 | 18/30 | 13/30 | 18/30 | 13/30 | 14/30 | 22/30 | 20/30 | |||
*p<0.05, ** p<0.01
As indicated in the literature review, the test of “managerially meaningfulness” emphasizes managerially relevant differences instead of strict statistical differences (Dawar & Parker, 1994; Sawyer & Peter, 1983). Whether the differences are or are not managerially meaningful is a subjective question. It is clear that the concept “managerially meaningful” means that the acceptance criteria for a behaviour to be universal has to be lowered from the strict statistical requirements, for example to the rank order requirement (level 2) and if this is the case, the cell phone behaviours used in this study can be said to be universal for all factors except for Finland regarding Factor 2 (Cost efficiency) and Factor 4 (Dependency).
Discussion
Using the convergence theory and measures by Williamson and Fleming (1996) (also used by De-Mooij and Hofstede, 2002), the theory of marketing universals by Dawar and Parker (1994), the cell phone behaviours determined by Aoki and Downes (2003), the cultural dimensions of Hofstede (1980) and the cell phone behavioural data collected in Finland, the universal nature of cell phone behaviours were assessed in this study. The analysis was performed with cell phone subscription data provided by the ITU and behavioural data collected in United Arab Emirates, China, Canada and New Zealand.
Convergence of the Cell Phone Markets in Terms of Ownership
The convergence process in the global cell phone market in terms of cell phone ownership has been very strong during the 2000-2011 time-period and in fact much stronger than for example in the ownership of televisions during 1960-1997 in Europe. This finding supports the claim by De-Mooij and Hofstede (2002) when they state that “countries converge with respect to relatively recent media (e.g. televisions) whereas they diverge with respect to relatively old media (e.g. radio or newspapers). Using the 0.3 threshold value for CV as a criterion, it can be said that the global cell phone market has not fully converged as of yet, in spite of the rapid pace of convergence.
Prior research has concluded that convergence can lead to homogenous consumer needs, tastes and lifestyles (Assael, 1998; Bullmore, 2000; Czinkota & Ronkainen, 2013; Jain, 1987). The findings of this research do not quite yet support this in the cell phone markets among youth this in spite of the fact that the speed of convergence has been fast during the 2000-2015 period. At the moment, CV stands at about 0.40 and thus the threshold lever of 0.30 has not yet been reached. The convergence phenomenon evident in the context of this research is consistent with previous research as the existence of inter-market segments transcending the geographical borders has been discovered (Haverila, Rod & Ashill, 2013). Universal Cell Phone Behaviours?
When analysing the universal nature of cell phone behaviours, the three levels of assessment procedure described by Dawar and Parker (1994) was used. These three levels are the existence of the behaviours, the rank order of the behaviours and the absolute level of behaviours across cultures. The conclusion of the analysis was that cell phone behaviours can be deemed to be universal at the rank order level for all countries except for Finland for the behavioural factors 2 ”Cost efficiency” and 4 ”Dependency”. The third and most stringent criterion for the universal nature of cell phone behaviours, i.e. the lack of statistically significant differences, was not met across countries (Table 6).
Dawar and Parker (1994) also discuss the managerially relevant differences in this context, but they do not actually define what these differences should be. One way to examine this is to look at standard deviations of the mean values (Table 9). It is important to note that all behavioural factors were normally distributed using the Shapiro-Wilk test. If the standard deviation is large, that means that the distribution curve is relatively flat (platykurtic) and if the standard deviation is small, that means that the distribution curve is relatively peaked (leptokurtic) in comparison to the perfectly normal distribution.
| Table 9 The Mean Values Of Cell Phone Behavioural Factors In The Various Countries (1=Very Unimportant, 7=Very Important) (Aoki & Downes, 2003) |
||||||||||
| # | Behavioural factor | Finland | UAE | China | Canada | New Zealand | Mean | Std. dev. | Max-Min | Kurtosis value |
| F1 | Necessity in modern times | 4.55 | 4.98 | 4.75 | 4.54 | 5.29 | 4.73 | 1.26 | 0.74 | 0.11 |
| F2 | Cost efficiency | 4.87 | 3.71 | 3.88 | 3.78 | 3.27 | 4.07 | 1.53 | 1.60 | -0.48 |
| F3 | Safety/security | 4.41 | 5.38 | 5.20 | 4.81 | 4.84 | 4.86 | 1.34 | 0.97 | -0.23 |
| F4 | Dependency | 4.41 | 5.05 | 4.82 | 4.67 | 5.31 | 4.74 | 1.44 | 0.90 | -0.11 |
| F5 | Negatives | 3.62 | 4.09 | 4.32 | 4.18 | 3.81 | 3.99 | 1.23 | 0.70 | 0.02 |
| F6 | Non-calling functionality | 3.67 | 3.77 | 4.23 | 3.29 | 3.84 | 3.75 | 1.70 | 0.93 | -0.66 |
The statistical measure for the flatness/peakedness is kurtosis (De-Carlo, 1997; Hair, et al., 2006). The platykurtic distribution has a negative kurtosis value and the leptokurtic distribution has a positive kurtosis value and the perfectly normal distribution has a kurtosis value of 0. On this basis, one could claim that the more leptokurtic a distribution of responses is, the more managerially insignificant the differences in responses are due to the fact that all responses are closer to the mean value. Therefore, Factors 1 (Necessity in modern times) and 5 (Negatives) with positive kurtosis values can be deemed to have managerially less relevant differences and thus an individual approach for example when segmenting the market is more feasible. The positive kurtosis values are, however, quite small. For all the other factors, the differences are managerially more relevant and, thus, a culture specific approach is perhaps more feasible. This is particularly true in case of Factor 2 (kurtosis value-0.48) and Factor 6 (kurtosis value-0.66). In conclusion, the results on the basis of the standard deviations and kurtosis values, as far as treating the cell phone behaviours as universal marketing behaviours are interesting, but inconclusive.
The other option to assess the managerially relevant differences is to lower the strict statistical significance requirement and use the second level of the Dawar and Parker (1994) assessment of relative importance of the behavioural factors as a criterion. On this basis, the conclusion was that, with the exception of Finland, regarding two behavioural factors (Factor 2 Cost efficiency and Factor 4 Dependency) the cell phone behaviours can be deemed to be universal in the countries present in this study. Then if the behaviours are indeed universal, it means that individual segmentation criteria (e.g. demographic or psychographic) or alternatively the cluster analysis approach using the behavioural factors or variables as cluster variates could be considered.
Finally, in Table 10 the Pearson correlations across the behavioural factors are reported. The factors appear to be correlated in most of the cases except between Factor 6 (Non-calling functionality) and Factor 1 (Necessity of modern times). It is quite logical that respondents who feel that a cell phone is a “Necessity of modern times” also want to learn the non-calling functions of their cell phones and therefore there is lack of correlation between the two factors (please note the negative wording of Factor 6).
| Table 10 Behavioural Factor Correlations (Aoki & Downes, 2003) |
|||||||
| # | Behavioural factor | 1 | 2 | 3 | 4 | 5 | 6 |
| F1 | Necessity in modern times | 1 | |||||
| F2 | Cost efficiency | 0.347* | 1 | ||||
| F3 | Safety/security | 0.496* | 0.240* | 1 | |||
| F4 | Dependency | 0.655* | 0.245* | 0.489* | 1 | ||
| F5 | Negatives | 0.309* | 0.173* | 0.383* | 0.381* | 1 | |
| F6 | Non-calling functionality | 0.014 | 0.110* | 0.198* | 0.054 | 0.319* | 1 |
*p<0.0001
In addition, there was lack of correlation between Factors 6 and 4 (Dependency). The lack of correlation between these factors indicates that those respondents who feel disconnected without their phones (Q 20), feel lost when they left their cell phones at home (Q 21), leave their cell phones always on (Q 22), feel upset when they miss a call (Q 23) and do not care to learn the non-calling functions of their cell phone. In all other cases, the correlations were moderate/strong and significant. This means that there are people among the respondents for whom the cell phone behaviours are generally more important. For example, those respondents who are more dependent on their cell phone(s) are likely to feel that the cell phone is more a necessity of modern times, perceive cost efficiency to be more important, are more safety/security oriented and care more about the negative aspects of the cell phone.
Impact of the National Culture
As discussed earlier, Hofstede (1980) discovered four dimensions against which the cultural differences between countries can be compared. These are Power Distance (PDI), Individualism/Collectivism (IDV), Masculinity/Femininity (MAS) and Uncertainty Avoidance (UAI). The fifth dimension Long Term Orientation although very interesting will not be discussed here due to lack of data. A summary table of the Hofstede cultural dimension values in the countries of this study can be found in Table 11. To examine the possible impact of national culture on the consumption, correlation analysis was conducted using the ITU cell phone penetration statistics and Hofstede cultural dimensions.
| Table 11 CULTURAL DIMENSION VALUES IN THE STUDY COUNTRIES (DE-MOOIJ & HOFSTEDE, 2002) |
||||
| PDI | IDV | MAS | UAI | |
| Finland | 33 | 63 | 26 | 59 |
| United Arab Emirates | 90 | 25 | 50 | 80 |
| China | 80 | 20 | 66 | 30 |
| Canada | 39 | 80 | 52 | 48 |
| New Zealand | 22 | 79 | 58 | 49 |
Similar to De-Mooij and Hofstede (2002), the relationship between the cell phone subscriptions and the cultural indexes will be discussed next. Figure 4 shows the correlations between the cell phone subscriptions and the cultural indexes in 2000-2015.
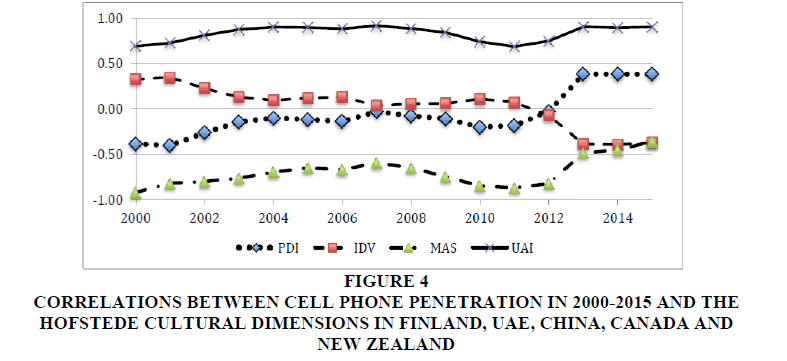
Figure 4: Correlations Between Cell Phone Penetration In 2000-2015 And The Hofstede Cultural Dimensions In Finland, Uae, China, Canada And New Zealand
The results in Figure 4 reveal that the correlation between the cell phone subscriptions and uncertainty avoidance (UAI) remained at a very high level during the 2000-2015 periods, in spite of the strong convergence trend and the fact that cell phone subscriptions have increased tremendously. In other words, it is feasible that cell phone ownership is perceived to be important in order to avoid future uncertainty and ambiguity. Furthermore, cell phone ownership is recognized as a true necessity of modern times and a sign of being well groomed in relatively strong uncertainty avoidance countries like the UAE and Finland.
The correlation remained at a very high negative level between cell phone penetration and masculinity (MAS), this happened in spite of the increased number of global subscriptions and strong convergence trend. De-Mooij and Hofstede (2002) state that luxury articles can be classified as manifestations of one’s success and therefore luxury items are more attractive to individuals in masculine cultures. Consequently, it is possible that the opposite is the case for cell phones and therefore it can be said that cell phones are not perceived to be luxury items any more. An interesting comparison can be made to the two categories of watches (value below $150 and value above $1,500) mentioned in the De-Mooij and Hofstede (2002) study. In the cheap category of watches there was a high negative correlation with masculinity and in the case of expensive watches a high positive correlation. It is common knowledge that the prices of cell phones have decreased and also that the cell phone market lacks an expensive and meaningfully large cell phone category (above $1,500) from the volume point of view (also taking into account the ultra-expensive Vertu brand). Even smartphones have not had an impact on the negative correlation between masculinity and cell phone penetration.
Interestingly the correlation between cell phone penetration and individualism (INV) was positive and moderately high in the beginning of the period 2000-2015 but started to decrease in 2002 and was non-significant 2004-2012, turning significantly negative in 2013. Thus, the ownership of a cell phone was a demonstration of individualism earlier on, then disappeared and turned negative since 2013, potentially due to the convergence of the cell phone markets and the tremendous increase of cell phone subscriptions on a global basis.
Similarly, the correlation between cell phone penetration and power distance (PDI) was negative and moderate but started to increase in 2001, was non-significant in 2004-2012 and became positive and significant in 2013. One possible explanation for this is the tremendous increase of cell phone penetration in high power distance countries China and United Arab Emirates.
The National Culture and the Cell Phone Behaviours
Finally, the relationship between the behavioural factors and the national culture dimensions will be discussed.
On the basis of the results in Table 12 it is evident that Factor 1 “Necessity of modern times” is not related to any of the cultural dimensions implying that Factor 1 is not impacted by any of the cultural dimensions. Factor 2 “Cost efficiency” is negatively correlated to masculinity. In other words, the more masculine the country the less concerned the members of the society are with cost efficiency.
| Table 12 The Correlation Between The Behavioural Factors And Cultural Dimensions In Finland, Uae, China, Canada And New Zealand (Aoki & Downes, 2003) |
||||
| Factor | PDI | IDV | MAS | UAI |
| Factor 1 Necessity of modern times | 0.042 | -0.041 | 0.091 | 0.025 |
| Factor 2 Cost efficiency | -0.122* | 0.043 | -0.312* | 0.074 |
| Factor 3 Safety/security | 0.235* | -0.193* | 0.220* | -0.029 |
| Factor 4 Dependency | 0.075 | -0.052 | 0.145* | -0.001 |
| Factor 5 Negatives | 0.159* | -0.114* | 0.205* | -0.115* |
| Factor 6 Non-calling functions | 0.111* | -0.152* | 0.087 | -0.084 |
*) Significance <0.0001, Shading implies moderate correlations above 0.200
Factor 3 “Safety/security” is positively correlated with power distance and masculinity indicating that the higher the power distance/masculinity the more concerned the individuals are with safety and security. Factor 3 is also negatively correlated with individualism implying that the more individualistic the country, the less concerned the individuals are with safety and security. Factor 4 “Dependency” is positively correlated with masculinity, but the correlation is quite weak. The meaning of this is that the more masculine the country, the more dependent individuals appear to be to their cell phones.
Factor 5 “Negatives” is positively correlated with power distance and masculinity. This implies that the larger the power distance and the more masculine the country the less concerned the individuals are about the negative connotations with the cell phone behaviour. Finally, factor 6 “Non-calling functions” is positively correlated with power distance and negatively correlated with individualism, but again the correlations are only weak to moderate.
Limitations Of The Study And Future Research
For the product category (cell phones) and demographic group (youth) examined, it would appear that the cell phone behaviours are at least partially universal. It is obvious; however, that necessary caution in the interpretation of insignificant results should be used. It is also likely that the findings might be quite different for more cultural products than the cell phone which can be regarded to be quite universal. It is evident, however, that the cell phone behaviours are not completely universal using strict statistical criteria. It is probable that the trend of the cell phone behaviours to become more and more universal will continue due to the very strong convergence phenomenon. It would be interesting to see whether similar conclusions can be drawn in other technological consumer product categories.
As indicated the sample of this study was reasonably uniform consisting of young people between the ages of 15 and 25. It is of course possible that many of the differences disappeared because of the homogeneity of the samples. The choice of similar samples was intentional in order to remove the impact of age and educational level as impacting variables on the differences in behaviours. In addition, it is worthy acknowledging the weakness inherent in the data in looking at convergence in one age group but at penetration across the whole population. Referring to the literature review section of this paper, it can be safely assumed, however, that the cell phone penetration rates among the target audience of this research paper are as high, if not higher, than in the data provided by ITU for the general population. The approach in this study is exploratory and therefore the validity of the results in broader country settings should be examined. Questions like “What kind results are there in other countries and cultures?” and “How about the cell phone penetration rate? Does it have an impact on the results?” remain open.
Another issue is that mobile communications is advancing fast and thus the nature of communication and behaviours will evolve as well. It is possible that the findings of this research are not valid in a few years’ time. Therefore, the study should be replicated in the current as well as other settings. It is quite feasible that technology advancement causes attitude and behavioural changes regarding the use of the cell phones and thus it is quite realistic that the results of this study do not hold longitudinally.
Appendix
Appendix: The questionnaire: The cell phone behaviours (1=strongly disagree, 7=strongly agree)
• A cell phone allows me to use my time efficiently (“Time efficiency”).
• I use my cell phone to make use of time that otherwise would be wasted (“Wasted time”).
• We need a cell phone to be successful in the world today (“Successful”).
• A cell phone allows me to do two things at once (“Multi-tasking”).
• Those people who don’t have a cell phone are out of touch with modern times (“Out-of-touch”).
• The brand of a cell phone is important to me (“Brand”).
• I often use my cell phone to schedule/reschedule an appointment at the last minute (“Re-schedule appointments”).
• It is financially beneficial to use a cell phone as opposed to a landline (“Financially beneficial”).
• A cell phone is more affordable than a landline phone service (“Affordable”).
• If I had to choose, I would use a cell phone instead of a landline because a cell phone is cheaper (“Cell phone instead”).
• A cell phone is a cheaper alternative for long distance calls than a landline (“Cheaper in long distance calls”).
• I don’t use landlines because having a cell phone is cheaper (“Cell phone cheaper”).
• Having a cell phone makes me feel safe while I am walking alone at night (“Safe at night”).
• My parent wanted me to have a cell phone so I can get in touch with her/him if necessary (“In touch with parents”).
• I use my cell phone to keep my parent from worrying about me (“Not worry”).
• Having a cell phone makes me feel safe while I am driving (“Safe driving”). I got my cell phone to use in case of emergency (“Emergency”).
• My parent worries about me less because I have a cell phone (“My parent”).
• With a cell phone, I can keep in touch with my family members (“Family members”).
• When I don’t have my cell phone with me, I feel disconnected (“Disconnected”).
• I feel lost when I leave my cell phone at home (“Lost”).
• I always leave my cell phone on (“Always on”).
• I feel upset when I miss a call to my cell phone (“Upset”).
• A cell phone distracts me from being aware of my surroundings (“Distracts”).
• I feel embarrassed by my cell phone ringing at inappropriate times (“Embarrassed”).
• I am often distracted by my cell phone when driving (“Distracts driving”).
• I am tired of being accessible all the time (“Accessible”).
• A cell phone is addictive (“Addictive”).
• I don’t care to learn how to use non-calling functions on my cell phone (“Learn non-calling functions”).
• I don’t care to learn how to use non-calling functions on my cell phone (“Learn non-calling functions”).
References
- Ajzen, I. & Fishbein, M. (1980). Understanding attitudes and predicting social behaviour. Englewood Cliffs: Prentice-Hall.
- Ajzen, I. (1991). The theory of planned behaviour. Organizational Behaviour and Human Decision Processes, 50(2), 179-211.
- Alexander, E., Ward, C. & Braun, C. (2007). Cell phone attachment: A measure and its benefits. IABE-2007 Annual Conference. Las Vegas.
- Algoso, D. (2010). What does complexity mean? What do we do about it? Find What Works. Retrieved June 18, 2017, from http://findwhatworks.wordpress.com/2010/09/07/what-does-complexity-mean-what-do-we-do-about-it/
- Anderson, M. (2015). 6 facts about Americans and their smartphones. Retrieved from Pew Research Center: http://www.pewresearch.org/fact-tank/2015/04/01/6-facts-about-americans-and-their-smartphones/
- Aoki, K. & Downes, E.J. (2003). An analysis of young people’s use of and attitudes toward cell phones. Telematics and Informatics, 20(4), 349-364.
- Assael, H. (1998). Consumer behaviour and marketing action. Cincinnati, Ohio, USA: South Western College Publishing.
- Auter, P.J. (2007). Portable social groups: Willingness to communicate, interpersonal communication gratifications and cell phone use among young adults. International Journal of Mobile Communications, 5(2), 139-156.
- Balakrishnan, V. & Gopal, R. (2012). Exploring the relationship between urbanized Malaysian youth and their mobile phones: A quantitative approach. Telematics and Informatics, 29(3), 263-277.
- Baskerville, R.F. (2003). Hofstede never studied culture. Accounting, Organizations and Society, 28(1), 1-14.
- Bullmore, J. (2000). Alice in Disneyland, a creative view of international advertising. In J.P. Jones, International Advertising: Realities and Myths (pp. 41-56). Thousand Oaks: Sage.
- Cellular News. (2010). Retrieved January 29, 2017, from Global Mobile Subscriber Base Passes the 5 Billion Mark: http://www.cellular-news.com/story/44103.php
- Charny, B. (2002). Virgin, Sprint create teen venture (News.com). Retrieved January 30, 2017, from http://news.com/2100-1033-937859.html
- Chen, Y.F. & Katz, J.E. (2009). Extending family to school life: College students’ use of the mobile phone. Human-Computer Studies, 67(2), 179-191.
- Cole, C., Laurent, G., Drole, A., Ebert, J., Gutches, A., Raphaëlle, L.P., Etienne, M., Michael, I.N. & Ellen, P. (2008). Decision making and brand choice by older consumers. Marketing Letters, 19(3-4), 355-365.
- Czinkota, M.R. & Ronkainen, I.A. (2013). International Marketing. Fort Worth, Texas, USA: The Dryden Press.
- Dawar, N. & Parker, P. (1994). Marketing universals: Consumers' use of brand name, price, physical appearance and retailer reputation as signals of product quality. Journal of Marketing, 58(2), 81-95.
- D'Costa, K. (2013). Just the essentials: A look at the things we carry. Retrieved January 2017, from Scientific American: http://blogs.scientificamerican.com/anthropology-in-practice/2013/03/31/just-the-essentials-a-look-at-the-things-we-carry/
- DeCarlo, L.T. (1997). On the meaning and use of kurtosis. Psychological Methods, 2(3), 292-307.
- De-Mooij, M. & Hofstede, G. (2002). Convergence and divergence in consumer behaviour: Implications for international retailing. Journal of Retailing, 78(1), 61-69.
- Economides, A.A. & Grousopoulou, A. (2009). Students’ thoughts about the importance and costs of their mobile devices’ features and services. Telematics and Informatics, 26(1), 57-84.
- Erikson, E.H. (1982). The life cycle completed. New York, NY, USA: Norton.
- Erikson, E.H. (1998). The Life Cycle Completed: Extended Version with New Chapters on the Ninth Stage of Development. New York, NY, USA: Norton.
- Geser, H. (2004). Sociology of the mobile phone. Retrieved from Sociology in Switzerland: http://socio.ch/mobile/t_geser1.pdf
- Ghemawat, P. & Reiche, S. (2011). National cultural differences and multinational business. Retrieved from AACSB Globalization Note Series: http://www.aacsb.edu/-/media/aacsb/publications/cds%20and%20dvds/globe/readings/national-cultural-differences-and-multinational-business.ashx?la=en
- Goldenberg, J., Horowitz, R., Levav, A. & Mazursky, D. (2003). Finding your innovation sweet spot. Harvard Business Review, 81(3), 120-129.
- Grant, K. (2015). How have cell phones changed communication? Retrieved from TechWalla: https://www.techwalla.com/articles/how-have-cell-phones-changed-communication
- Hair, J.F., Black, B., Babin, B., Anderson, R. & Tatham, R.L. (2006). Multivariate data analysis. Upper Saddle River: Pearson Prentice Hall.
- Haverila, M. (2011). Behavioural aspects of the cell phone usage among youth: An exploratory study.” Young Consumers 12 (4), 310-325. doi:10.1108/17473611111185869.
- Haverila, M., Rod, M. & Ashill, N. (2013). Cell phone product-market segments using product features as a cluster variate: A multi-country study. Journal of Strategic Marketing, 21(2), 101-124.
- Hervé, C. & Mullet, E. (2009). Age and factors influencing consumer behaviour. International Journal of Consumer Studies, 33(3), 302-308.
- Hoang, P. (2007). Business and management. Victoria: IBID Press.
- Hofstede, G. (1980). Culture’s consequences. Thousand Oaks, CA, USA: Sage.
- Hofstede, G. (2013). National culture. Retrieved June 10, 2017, from https://geert-hofstede.com/national-culture.html
- International Telecommunications Union.(2004). Use of information and communication technology by the world’s children and youth: A statistical compilation. Retrieved October 26, 2010, from http://www.itu.int/osg/spu/ni/futuremobile/Youth.pdf
- International Telecommunications Union. (2016a). Retrieved January 2017, 27, from ICT facts and figures: https://www.itu.int/en/ITU-D/Statistics/Documents/facts/ICTFactsFigures2016.pdf
- International Telecommunications Union. (2016b). Mobile cellular subscriptions. (ITU) Retrieved January 27, 2017, from https://www.itu.int/en/ITU-D/Statistics/Pages/stat/default.aspx
- Isiklar, G. & Büyüközkan, G. (2007). Using a multi-criteria decision-making approach to evaluate mobile phone alternatives. Computer Standards & Interfaces, 29(2), 265-274.
- Ito, M., Okabe, D. & Matsuda, M. (2006). Personal, portable, pedestrian: Mobile phones in Japanese life. Cambridge: MIT Press.
- Jain, S.C. (1987). International marketing management. Boston: PWS-Kent Publishing Company.
- Kangas, S., Lundvall, A. & Sintonen, S. (2008). Lasten ja nuorten mediafoorumi [The media forum of youth and children]. Retrieved from http://mll-fi-bin.directo.fi/@Bin/e56d063257563b52102433f081c44632/1485465965/application/pdf/6084451/P%C3%A4hkin%C3%A4nkuori%20lopullinen%20PDF.pdf
- Kannon, J. (2006). CE first for mobile phones available now; emergency medical info at the touch of a button. Retrieved January 10, 2017, from Business wire: http://www.businesswire.com/portal/site/home/permalink/?ndmViewId=news_view&newsId=20060306005864&newsLang=en
- Kennedy, B. & Funk, C. (2016). 28% of Americans are ‘strong’ early adopters of technology. Retrieved from Pew Research Center: http://www.pewresearch.org/fact-tank/2016/07/12/28-of-americans-are-strong-early-adopters-of-technology/
- Krasner, B. (2007). Driving the adoption curve. Enriching communications, 1(1), 8-11.
- Lambert-Pandraud, R. & Laurent, G. (2010). Why do older consumers buy older brands? The role of attachment and declining innovativeness. Journal of Marketing, 74(5), 104-121.
- Lee, Y.S. (2007). Older adults’ user experiences with mobile phones: Identification of user clusters and user requirements. Dissertation, Virginia Polytechnic Institute and State University.
- Loo, J.L. (2009). Acceptance of health services on mobile phones: A study of consumer perceptions. Dissertation, University of North Carolina at Chapel Hil.
- Luzi, M. (2009). Mobile internet for growth: Project report phase I. Retrieved January 24, 2017, from http://www.bain.com/publications/articles/mobile-internet-for-growth-project-report-phase-1.aspx
- McSweeney, B. (2002). Hofstede’s model of national cultural differences and their consequences: A triumph of faith-a failure of analysis. Human Relations, 55(1), 89-118.
- O’Neal C.L., Hale, T.M., Cotten, S.R. & Gibson, P. (2015). Impact of Information and Communication Technology (ICT) usage on psychological well-being among urban youth. In S. Lee Blair, P. Neff Claster & S. M. Claster, Technology and Youth: Growing Up in a Digital World Sociological Studies of Children and Youth (pp. 267-291). Emerald Group Publishing Limited.
- Oksman, V. & Rautiainen, P. (2002). Perhaps it is a body part: How the mobile phone became an organic part of the everyday lives of Finnish children and teenagers. In J. E. Katz, Machines That Become Us (pp. 293-308). New Brunswick: Transaction Publishers.
- Oksman, V. & Rautiainen, P. (2003). That’s modern life for you: Mobile communication in everyday life of children and teenagers in Finland. Acta Ethnographica Hungarica, 48(1-2), 149-159.
- Oksman, V. & Turtiainen, J. (2004). Mobile communication as a social stage: The meanings of mobile communication among teenagers in Finland. New Media & Society, 6(3), 339-319.
- Oksman, V. (2006). Young people and seniors in Finnish mobile information society. Journal of Interactive Media in Education, 2.
- Oksman, V. (2010). The mobile phone: A medium in itself. VTT Technical Research Centre of Finland.
- Pontes, H.M., Szabo, A. & Griffiths, M.D. (2015). The impact of Internet-based specific activities on the perceptions of Internet addiction, quality of life and excessive usage: A cross-sectional study. Addictive Behaviors Reports, 1, 19-25.
- Rainier, L. & Keeter, S. (2006). How Americans use their cell phones. Retrieved January 7, 2017, from http://www.pewinternet.org/Reports/2006/Americans-and-their-cell-phones.aspx
- Rhodes, N. (2016). Attitude-behaviour consistency. Retrieved from Oxford Bibliographies: http://www.oxfordbibliographies.com/view/document/obo-9780199756841/obo-9780199756841-0128.xml
- Rosling, H. (2006). Stats that reshape your worldview (TED). Retrieved January 12, 2017, from http://www.ted.com/talks/hans_rosling_shows_the_best_stats_you_ve_ever_seen.html
- Sawyer, A.G. & Peter, J.P. (1983). The significance of statistical significance tests in marketing research. Journal of Marketing Research, 20(2), 122-133.
- Shambare, R., Rugimbana, R. & Zhowa, T. (2012). Are mobile phones the 21st century addiction? African Journal of Business Management, 6(2), 573-577.
- Shim, W., Kwon, O.J., Moon, Y.H. & Kim, K.H. (2016). Understanding the dynamic convergence phenomenon from the perspective of diversity and persistence: A cross-sector comparative analysis between the United States and South Korea. PLOS One, 11(7).
- Simcock, P., Sudbury, L. & Wright, G. (2006). Age, perceived risk and satisfaction in consumer decision making: A review and extension. Journal of Marketing Management, 22(3), 355-377.
- Srivastava, L. (2005). Mobile phones and the evolution of social behaviour. Behaviour and Information Technology, 24(2), 111-129.
- Suh, J.C. (2009). The role of consideration sets in brand choice: The moderating role of product characteristics. Psychology & Marketing, 26(6), 534-550.
- Tessier, J. (2013). Student impressions of academic cell phone use in the classroom. Journal of College Science Teaching, 43(1), 25-29.
- The Economist. (2009). Mobile-phone culture. Retrieved from The Apparatgeist calls: https://www.economist.com/node/15172850
- Totten, J.W., Lipscomb, T.J., Cook, R.A. & Lesch, W. (2005). General patterns of cell phone usage among college students: A four-state study. Services Marketing Quarterly, 26(3), 13-39.
- Vanden, M.M. (2014). Mobile lifestyles: Conceptualizing heterogeneity in mobile youth culture. New Media & Society, 18(6), 908-926.
- Williamson, J.B. & Fleming, J.J. (1996). Convergence theory and the social welfare sector. A cross-national analysis. In A. Inkeles & M. S. Sasaki, Comparing Nations and Cultures (pp. 349-354). Englewood Cliffs: Prentice Hall.