Research Article: 2023 Vol: 24 Issue: 2
Crypto currencies and oil prices during the Covid-19 and the negative oil prices : Evidence from the DCC-GARCH and BEKK-GARCH
Hammami Algia, University of Sfax
Bouri Abdelfatteh, University of Sfax
Citation Information: Algia, H., & Abdelfatteh, B. (2023). Crypto currencies and oil prices during the covid-19 and the negative oil prices : evidence from the dcc-garch and bekk-garch. Journal of Economics and Economic Education Research, 24(2), 1-26.
Abstract
Purpose In this paper, we try to determine whether there are conditional correlation and volatility spillovers between oil-crypto currency pairs during the COVID-19 pandemic and the negative oil price periods. Design/ Methodology/Approach In fact, on a sample of the top seven crypto-currencies, such as the (QTUM, NEO, LTC, ETH, BNB, BTC, BCH) and other traditional assets, namely the WTI and the Brent spot prices during the COVID -19 period (19/08/2019 to 31/12/2020), the authors used the BEKK- GARCH and DCC-GARCH to capture the transmission volatility and the dynamic conditional correlation between all the series. Findings We found that the return spillovers differ across pairs. In fact, the bidirectional volatility spillovers between the WTI, the (BTC,BNB, BCH, and ETH) are confirmed. Moreover, there evidence of the existence of volatility spillovers between Brent and the (QTUM , ETH , BNB , BTC, BCH , NEO). In fact, the findings obtained by DCC-GARCH showed that the heterogeneous patterns in the time-varying correlations are evident between the WTI and Brent. We also noticed that only the QTUM and the BNB are safe haven assets for Brent during COVID-19, on the other hand, the BTC acts only as a haven asset WTI while the other Crypto-currencies are weak safe haven or even weak diversifiers. Practical Implications This study will generate new knowledge regarding the volatility spillover between oil prices and crypto-currencies during the COVID-19 pandemic. On the practical level, the aim of this research will be very important of the major investors and decision makers in the governments of several countries in the word. Originality/value Although the existing studies refer to the transmission volatility between oil prices and Crypto-currencies during the Covid-19 pandemic, to the best of our knowledge, this is the first study to have investigated the relationship between 5 Crypto-currencies, such as ( LTC, ETH, BNB, BTC, BCH) and two oil prices, like (WTI, Brent. We also introduced two Crypto-currencies, which are (Neo, QTUM). Then, the comparison between the two oil series is the central issue of our paper, which provides better insights about all the crypto-currencies and oil markets
Keywords
BEKK-GARCH; DCC-GARCH; WTI , Brent, Cryptocurrency Covid6-19.
Introduction
In fact, the recent Covid-19 pandemic has affected many financial and commodity markets, including, the stock ones (Liu et al., 2020; Phan & Narayan, 2020; Ashraf, 2021; Topcu & Gulal, 2020) the bond markets Falato et al.(2021); Halling et al.(2020), the crude oil markets Bouri et al. (2020); Mensi et al. (2020), the gold markets (Salisu et al., 2020; Yousaf et al., 2020; Adekoya et al., 2021), as well as the natural gas market Abadie (2021) the corn market Borgards et al. (2021) besides the banks (Baret et al., 2020) he and agricultural commodity markets (Ji et al.,2019a).
Moreover, the financial events related to the COVID-19 pandemic have provoked a great of valuable research studies that focused mainly on the effect of the crude oil prices on the Crypto-currency during the Covid -19 pandemic (Yousaf &Ali, 2020; Goodell & Goutte,2021; Mnif et al., 2020). Therefore, to explain the effect of oil prices on Crypto-currency, the authors looked in many directions. In fact, the prevailing idea of these authors is that the oil price shocks contain information about the prediction of Crypto-currency. On the other hand, some researchers, such as Okorie & Lin (2020), argue that the crypto-currencies have the same characteristics as the commodities, which means that the oil prices affect the is Cryptocurrency while others, like Yousaf et al. (2020); Lahmiri & Bekiros (2020) tend to treat crypto-currencies as diversification. However, the Bitcoin cannot be considered as a safe haven during the global Covid-19 pandemic when investing in crude oil.
Moreover, these mixed results reported by these researchers are not limited to the five waves of the Covid -19 pandemic. Indeed, such controversies stem from the used measurement methods and the choice of the wave periods. In fact, when we look Back at the first wave of the Covid-19 pandemic, we note that the oil prices fell sharply while other Cryptocurrency such as the Eth and the BTC, showed increases. In fact, this drives us to believe that the negative oil prices can also have an impact on the crypto currencies. Therefore, in this context, we propose our hypothesis. More precisely, our study seeks to examine the conditional correlation and volatility spillovers between the oil (WTI, Brent) and the crypto currencies (qtum, neo, lite coin, eth, bnb, btc, bitcoin cash) pair during the Covid-19 and the negative oil prices , using the BEKK-GARCH and the DCC models. In More particularly, our study is intended to check whether the crypto currencies are a safe haven asset for the international crude oil market during the Covid-19 and the negative oil prices periods. To this end, the rationale of the selection of the variables, the period and the models is presented below.
(a) We have chosen to use THE seven best-selling crypto currencies (QTUM, NEO, LTC, ETH, BNB, BTC, BCH) with high market capitalization according to Coinmarketcap.com. In fact in 2020, these crypto- currencies displayed stock market capitalizations exceeding tens of billions dollars per day. On the other hand, according to (Brauneis & Mestel, 2018; Ji et al.,2018; Koutmos, 2018),these cryptocurrencies have become alternative digital investments. Therefore, it is more important to know the degree of the connection between of these new crypto currencies and oil prices, which implies that more research studies should be carried out.
(b) The choice of two prices of the oil crude market is not arbitrary. In fact, the Brent market remains generally stable compared to the WTI market despite the spread of the new Covid-19 pandemic. The comparative study between the two series has become the central issue of much of the Crypto-currency literature.
(c) The choice of the Covid-19 pandemic, as the most important period of the study is not arbitrary but because it is characterized by a political, economic and social instability due to the pandemic, which broke out in December 2019 in Wuhan (China). However, the impact of oil prices on the crypto-currency market during the Covid-19 pandemic has never been researched because of its uncertainty and
(d) With regard to the empirical methodology, we used the BEKK-GARCH specifications to capture the sense of the directions from both the crypto- currency and the commodity markets. We also used the DCC-GARCH models to identify the time varying correlation of a pair of oil-crypto-currencies.
Therefore, this paper is organized as follows. Section 2 presents a summary of the literature. Then, the methodology and the used data are provided in the third section. Section 4 discusses the empirical results before drawing the conclusion and also the empirical implications in the end.
Literature Review and the Motivation
This section clearly presents the literature review and the motivation
The relationship between the Bitcoin and gold prices has been dealt with by many research studies over the past years. For instance, Beneki et al. (2019) and Klein et al. (2018) investigated the relationship between the Bitcoin and gold prices. In fact, their results showed that the Bitcoin is an investment asset. On the other hand, some authors, such as Bouri et al. (2018a) used several advanced auto-regressive distributed lag (ARDL) models to estimate the linear, asymmetric and quantile effects of gold prices and the aggregate commodity on the price of the Bitcoin. In fact, they stipulate that the aggregate commodity and gold prices can predict the Bitcoin. Moreover, several researchers, such as Al-Yahyawee found that the Bitcoin and gold prices are capable of hedging of providing diversification for oil crude oil and S&P GSCI. Similarly, Oktorie showed that the Bitcoin and the S&P 500 are vital for portfolio diversification and hedging. In the same vein, based on the eight variables during 2012-2018 using different multivariate GARCH specifications, Guesmi et al. (2019) found that a short position in the Bitcoin market allows hedging the risk investment for all the different financial assets.
Thus, the hedging strategies involving gold, oil, and stocks and the Bitcoin, considerably reduce the portfolio variance, compared to an investment portfolio compound of gold, oil and stock.
On the other hand, the work of Ciaian et al. (2016) and Van Wijk (2013) considered the oil prices as a determinant of crypto-currency prices. In the same vein, Palombizio & Marrios (2012), Ciaian et al. (2016) noted that higher oil prices are assumed to be the determinant of inflationary conditions in an economy since they are a prime source of demand and cost pressures. In fact, based on the obtained results, they documented that the Bitcoin price may depreciate (or appreciate). In the same way, Das & Kannadhasan (2018) showed that the Bitcoin returns are more influenced by some global risk factors like uncertainty and crude oil prices. Thus, they provided relevant estimates about the multi-scale sensitivity of the Bitcoin to other global factors, like the stock market indices and the economic policy uncertainty, like the VIX, gold price. However, the uncertainty of crude oil prices is the prominent relevant risk factors. In fact, most researchers, such as Yin et al. (2021), focused on the impact of the oil market risk on the long-term volatility of crypto currencies. The obtained findings concluded that the unexpected increase of oil demand shocks has a negative impact on the long-term volatility of crypto-currencies besides, the unexpected increase of the word oil supply causes a statistically significant increase of the long-term volatility of crypto currencies. Furthermore, a number of researchers revealed an argument of a weak relationship between the Bitcoin and commodities, such as crude oil and gold (Bouri et al., 2018a, 2018b; Ji et al., 2019b).
Another part of the empirical research provided a clear understanding of the speculative features of crypto-currencies (Kristoufek, 2015; Yermack, 2015; Baek & Elbeck, 2015). For their part, Yermarck stated that the Bitcoin is a highly speculative investment tool for attractive returns like a true currency. As for Kristoufek (2015), he noted that the Bitcoin price cannot be interpreted by economic theories, it is instead driven by speculation. Similarly, regarding the fundamental economic data during the 2010-2014, Baek & Elbeck (2015) added that the Bitcoin is qualified as a speculative vehicle driven by the exchange of participants and it has not invest. Their obtained findings showed that the crypto-currencies, namely the Bitcoin, are internally driven by the volume of transactions of the buyers and sellers and therefore, are not influenced by the fundamental economic factors.
Other literature focusing primarily on whether Bitcoin is a currency or not (Dyhrberg, 2016a) support that crypto currency mainly Bitcoin is a currency which exhibits most currency characteristics to both the U.S dollar and the gold . In the other study, Dyhrberg (2016b) offers that bitcoin is capable of hedging and safe haven as gold. In their par, Baur et al. (2018) shows that Bitcoin is not exhibiting many similarities to other assets, including US Dollar and gold, in other words, Bitcoin has distinctively different time series characteristics in comparison to both the gold and the U.S dollars.
Methodology and Data
Data and variables
In fact, the data used in our study are the crude spot oil prices (WTI, Brent). Besides, we introduced 7 Crypto-currency variables, such as qtum, neo, lite coin, eth, bnb, bitcoin btn, bitcoin cash). The data were daily collected over the period from 19/08/2019 to 31/12/2020. In fact, the choice of this period of the study is not arbitrary but, because during this period, the world faced a political, economic and social instability following the Covid-19 pandemic, which first broke out in Wuhan, China, on 17/11/2019. In fact, our sample period, which begins on 19/08/2019, helped us get 500 observations because some researchers, such as Hwang et al. (2006) showed that at least 500 observations are required to get a full meaning of the GARCH estimations. Moreover, the study period coincides with a decrease in the oil prices. On the other hand, the data about the series of crypto-currencies and oil prices are collected from DataStream. In fact, all the series are calculated based on the growth rate form, using the closing price of each day:

Where:
R_it: The percentage log returns of the series at time t ,
p_it: The closing price of the series , at time t,
p_(it-1):The closing price of the series, at time t-1.
Econometric Methodology
In, fact, in the 1980s, Robert F. Engle developed the autoregressive conditional heteroskedasticity (ARCH) is a model for the variance of a time series. Therefore, this ARCH model received particular interest in the whole literature that addressed the time series volatility in econometric and finance problem (e,g. Jacquier et al., 2002).
The ARCH model is:
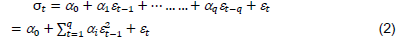
Building on the work of Bollerslev (1986), GARCH (p,q) is a comprehensive framework of ARCH (q). Concerning this model, the lags of the past conditional variance were added to the ARCH equation (Equation 2).
GARCH models (q, p) , can be estimated by choosing q or p greater than 1 where q is the autoregressive order of the GARCH terms and p is moving average order of ARCH terms. The GARCH model (p, q) is indicated as follows:
When , the parameters  is equal to or higher than 1;
 is the conditional variance ;
 is a constant term;
 and
and are the coefficients of ARCH and GARCH, respectively;
 and
and are the late squared errors with the delay t-i and t-j, respectively. The GARCH model (p, q) with Zt is a stochastic process defined as follows:
 is weakly stationary with
 and
and
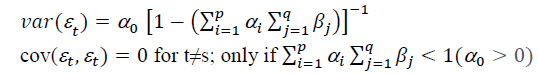
Since the seminal paper of Bollerslev (1990), the GARCH models have become the best model offering a superior capability in modeling the volatility dependence between all the time series data. Examples of popular multivariate GARCH models include, among others, BEKK-GARCH (Baba et al., 1990) and DCC- MGARCH model (Engle, 2002).
In our study, we apply two specifications of the GARCH model to explain the volatility spillover effect between seven crypto-currencies(qtum, neo, lite coin, eth, bnb, bitcoin btn, bitcoin cash) and other traditional assets, namely ( WTI spot prices, Brent spot prices) during the covid-19 period.
In particular, we employment BEKK-GARCH to model the unidirectional transmission of volatility between the proposed series. Moreover, we employed the DCC-GARCH of Engle (2002) to model the dynamic correlation to be time varying (Bollerslev,1990).
In its general specification, choosing a BEKK by the limited number of estimated parameters, such as, the BEKK- GARCH in the analysis of other investment options (e,g, commodities, Cryptocurrency, Options, Bonds, stocks, Annuities, Mutual Funds..).
By contrast, choosing a DCC-GARCH representation can be explained by the application of this model on the majority of the sectors, such as the (aggregate commodity price, the gold futures market and the stock market) (e,g, Singhal & Ghosh, 2016).
DCC- GARCH Model
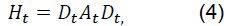
We use the DCC-GARCH (Engle,2002) to estimate the time-varying correlation between crypto-currencies and spot oil prices during the covid-19 period. The specification of the variance -covariance matrix in the DCC specifications is given as follows:
Where 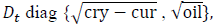 crypto-currencies= c;oil=WTI spot price, Brent spot price
 crypto-currencies, oil
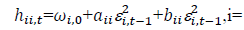
The constant term is  crypto-currencies , oil .The estimated ARCH and GARCH coefficients are aiiand bii respectively,aii represent the ARCH effects, which measure the short-term persistence and bii, represent the GARCH effects, which measure the long-term persistence or the volatility clustering . For i≠j , the coefficients aii and bii capture the volatility spillovers between each spot oil price ( WTI, Brent) and each crypto-currency (qtum, neo, lite coin, eth, bnb, bitcoin btn, bitcoin cash).
Then, the dynamic conditional correlation parameters is as follows
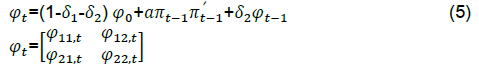
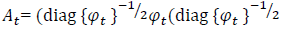
Where is the time -varying conditional correlation between each spot oil price ( WTI, Brent) and each crypto-currency (qtum, neo, lite coin, eth, bnb, bitcoin , bitcoin cash).which estimate the late standardized shocks on current dynamic conditional correlation and δ_2 shows how the past dynamic conditional correlation on the current dynamic conditional correlation, 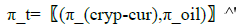 is a vector of standardized residuals defined as π_t=π_t/√(h_t ); where φ_0 is the matrix of unconditional correlation. To estimate the dynamic conditional correlation Engle (2002) followed two complementary steps . As a preliminary step , he proposed to estimate the parameters of the GARCH model . Then, in the next step, he proposed to estimate the conditional correlation using the matrix Ht presented in equation 4.
BEKK-GARCH Model
The BEKK-GARCH model is as follows:
More precisely
Where:
Rt is a 2*1 vector of oil prices return ( WTI , Brent) and crypto-currencies returns (qtum, neo, lite coin, eth, bnb, bitcoin, btn, bitcoin cash).
The general form of according to the representation of the variance-covariance matrix is given by:

Were,
A,B,C are the parameter matrix and are presented as follows:
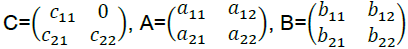
As mentioned below ,C0 , A and B are (N*N) matrix but C0 is a lower triangular matrix:
To have a clear and transparent information of the conditional variance-covariance matrix equations, we develop the following basic equation. In addition, the general BEKK model in the case of N=2, are outlined below:

More precisely
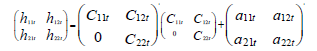
We focus on the h_11 and h_22 equations , which describe respectively the conditional variance of the spot oil prices and the crypto-currencies. Those parameters show how the shocks and volatility have transmitted between oil prices and crypto-currencies over time. In fact, the equations of the variance and the covariance of the systems are outlined below:
Where:
a11 is the coefficient of ARCH effect itself for spot oil prices, WTI and Brent. a22 is the coefficient of ARCH effect itself for seven crypto-currencies( qtum, neo, lite coin, eth, bnb, bitcoin btn, bitcoin cash).b11 is the coefficient of GARCH for two spot oil prices , WTI and Brent. b22 is the coefficient of GARCH for seven crypto-currencies , (qtum, neo, lite coin, eth, bnb, bitcoin btn, bitcoin cash). a12 shows the stock transmission from Market 1 of the volatility of market 2. If a12 is significant, this indicates that the conditional variance of Market 2 is affected by past shocks from Market 1. As our research shows, a12 coefficient measures the impact of past shocks from spot oil prices on the volatility of crypto-currencies. The coefficien a21 measures the impact of the past shocks from Market 2 on the shocks of market 2. More precisely a21 is the shock transmission between oil market and crypto-currencies. If a21 is significant, this indicates that the past shock of oil market is affected by past shocks from cryptocurrencies. By contrast, b12 indicates the volatility spillover from oil market to crypto-currencies . In the other hand, b21 measures the volatility spillover from crypto- currencies from oil prices. represents the effect of the unexpected changes or the shocks from the oil prices and the crypto-currencies in period t-1.
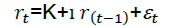
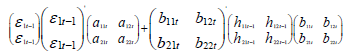
The equations of the mean of the system as follows:
The two coefficients l11 and l22 measure the interactions between current and past returns of spot oil prices ( WTI and Brent) and crypto-currencies.
If l11 is significant, then past returns of the oil prices affect the current returns in the same market.
If l22 is significant, then the past returns of crypto-currencies affect the current returns of the same market.
Results and Discussion
| Table 1 Summary Statistics And Stationarity Test For Daily Returns |
|||||||||
|---|---|---|---|---|---|---|---|---|---|
| WTI | Brent | QTUM | NEO | LTC | ETH | BNB | BTC | BCH | |
| Nobs | 500 | 500 | 500 | 500 | 500 | 500 | 500 | 500 | 500 |
| Mean | 0.164486 | -0.0509 | -0.04648 | 0.074081 | 0.102362 | 0.250743 | 0.045080 | 0.188733 | 0.003077 |
| Median | 0.000000 | 0.033052 | 0.073595 | -0.06466 | 0.000000 | 0.167844 | 0.099950 | 0.107271 | 0.255490 |
| Maximum | 42.58324 | 19.07740 | 23.05700 | 24.19501 | 19.10130 | 17.34440 | 19.34580 | 16.71040 | 26.94810 |
| Minimum | -28.1382 | -27.9762 | -58.0766 | -46.6820 | -44.90120 | -55.07140 | -54.28090 | -46.4730 | -51.85380 |
| Std.Dev | 5.924876 | 3.943585 | 5.664576 | 5.225137 | 4.874384 | 4.822308 | 4.775662 | 3.745949 | 5.105618 |
| Skewness | 1.145976 | -1.42028 | -2.36867 | -1.27517 | -1.557115 | -2.988601 | -3.085232 | -3.50006 | -2.144427 |
| Kurtosis | 20.48214 | 18.47607 | 26.96040 | 16.99735 | 18.70923 | 38.03025 | 37.17244 | 51.79473 | 27.83442 |
| JB | 4611.360 | 3703.349 | 12452.84 | 4225.730 | 5353.985 | 26361.90 | 25171.70 | 50522.25 | 13258.60 |
| P-value | 0.000000 | 0.000000 | 0.000000 | 0.000000 | 0.000000 | 0.000000 | 0.000000 | 0.000000 | 0.000000 |
| Sum | 58.55701 | -18.30498 | -23.2882 | 37.11446 | 51.28349 | 125.6224 | 22.58527 | 94.17763 | 1.541711 |
| Sum Sq. Dev | 12461.98 | 5567.568 | 16043.71 | 13651.03 | 11879.81 | 11627.33 | 11403.47 | 6988.003 | 13033.67 |
| ARCH (10) | 6.934998 | 89.41077 | 17.24803 | 17.43167 | 19.28098 | 5.277130 | 2.722775 | 4.438694 | 6.664792 |
| P-value | 0.0085*** | 0.0000*** | 0.0041*** | 0.0424* | 0.0000** | 0.0216** | 0.0989* | 0.0351* | 0.0357** |
| ADF test | |||||||||
| t-Statistic | -22.40296 | -13.82510 | -25.9965 | -3.44320 | -3.446949 | -24.87923 | -24.29682 | -23.9162 | -21.57533 |
| Critical-value | -3.4469(1%) | -3.44(1%) | -3.44(1%) | -3,4(1%) | -3.44(1%) | -3.443(1%) | -3.4432(1%) | -3.44(1%) | -3.443(1%) |
| Q(20) | 56.93288 | 4.884696 | 12.99088 | 474.3849 | 480.9469 | 478.5156 | 43.44578 | 12.01444 | 28.56094 |
| 0,0000 | 0.0870 | 0.0723 | 0.0000 | 0.0000 | 0.0000 | 0.0018 | 0.0346 | 0.0968 | |
In fact, table 1 provides the summary statistics values and the ARCH test results for seven crypto-currencies and two price of the crude oil, including Brent and WTI. For the latter indices, the results show high volatility during the COVID-19 period while Brent and WTI do not have the same level of volatility, For example, the standard deviation of WTI and Brent is about 5.924876%,3.943585%, respectively.
However, the results in table are certainly surprising as I expected that BTC has the highest daily returns while the analysis indicates that the highest mean values are presented in this way ETH( 0.250743); BTC ( 0.188733); LTC(0.102362). The highest value of ETH observed here dates back to 2017, which is the year when the tokens and altcoins were unleashed, which caused the caused Bitcoin market share to be reduced by 38.6 percent. According to the volatility statistics, the qtum crypto-currency has surpassed all the other crypto currencies (5.664576), followed by Neo (5.225137). In fact, column seven indicates that the standard deviation of the Bitcoin is less important (3.745949). However, this is not the case for the all six crypto-currency assets, namely, qtum ( 5,664 ); Neo (5,225), ltc (4,874 ), ETH (4,822), BNB (4,775) and BCH. (5,105). As shown in table 1, there are significant ARCH effects and Ljung box test for the returns of all the sampled series. We can therefore employ a DCC - GARCH and BEKK-GARCH model in our analysis. Therefore, when determining the DCC and BEKK estimation, we used the Augmented Dickey-Fuller (ADF) test techniques to check for the existence of unit roots. As for the two prices of the crude oil, we applied the model with constant and trend where the t-statistics is greater than the critical-value, which implies the stationarity of WTI and Brent in the first level. Regarding the series of crypto-currencies, the model adopted is the one with a constant and without trend and which verifies the stationarity of all series (QTUM, NEO, LTC, ETH, BNB, BTC, BCH) in the first level.
| Table 2 Unconditional Correlation Between Seven Crypto Currency And Brent |
||||||||
|---|---|---|---|---|---|---|---|---|
| Brent | QTUM | NEO | LTC | ETH | BNB | BTC | BCH | |
| WTI | 1.000 | |||||||
| QTUM | 0.013240 0.767 |
1.000 | ||||||
| NEO | 0.335472 (0.000)*** |
0.646905 (0.000)*** |
1.000 | |||||
| LTC | -0.000312 ( 0,994) |
0.797445 (0.000)*** |
0.508952 (0.000)*** |
1.0000 | ||||
| ETH | 0.020988 0.639 |
0.833105 0.000*** |
0.606905 0.000*** |
0.849156 (0.000)*** |
1.000 | |||
| BNB | 0.008246 (0.853) |
0.795368 0.000*** |
0.572695 0.000*** |
0.766992 (0.000)* |
0.848419 (0.000) |
1.000 | ||
| BTC | 0.004700 (0.916) |
0.724235 0.000*** |
0.500755 0.000*** |
0.797244 (0.000)* |
0.815942 (0.000) |
0.754292 (0.000) |
1.000 | |
| BCH | 0.06147 (0.1695) |
0.493533 0.000*** |
0.519470 0.000*** |
0.48202 (0.000)*** |
0.500606 (0.000)*** |
0.515975 (0.000)** |
0.530600 (0.000)* |
1.000 |
Notes: (i) ***, ** and * means significance at 1%, 5% and 10%; (ii) WTI,QTUM, NEO, LTC, ETH, BNB, BTC, BCH refers to West Texas Intermediate, QTum, Neo, Litecoin, Ethereum, Binance Coin , Bitcoin, Bitcoin Cash , respectively Table 2.
| Table 3 Unconditional Correlation Between Crypto Currency And Wti |
||||||||
|---|---|---|---|---|---|---|---|---|
| WTI | QTUM | NEO | LTC | ETH | BNB | BTC | BCH | |
| Brent | 1.000 | |||||||
| QTUM | 0.126176 0.0047*** |
1.000 | ||||||
| NEO | 0.142308 0.0014*** |
0.646905 (0.0000) |
1.000 | |||||
| LTC | 0.115073 0.0099*** |
0.797445 (0.0000) |
0.508952 (0.0000) |
1.0000 | ||||
| ETH | 0.142891 0.0013*** |
0.833105 0.0000 |
0.606905 0.0000 |
0.849156 (0.0000) |
1.000 | |||
| BNB | 0.143098 0.0013*** |
0.795368 0.0000 |
0.572695 0.0000 |
0.766992 (0.0000) |
0.848419 (0.0000) |
1.000 | ||
| BTC | 0.158747 0.0004*** |
0.724235 0.0000 |
0.500755 0.0000 |
0.797244 (0.0000) |
0.815942 (0.0000) |
0.754292 (0.0000) |
1.000 | |
| BCH | 0.071792 0.1085 |
0.493533 0.000 |
0.519470 0.000 |
0.48202 (0.000) |
0.500606 (0.000) |
0.515975 (0.000)** |
0.530600 (0.000) |
1.000 |
Notes: (i) ***, ** and * means significance at 1%, 5% and 10%; (ii) WTI,QTUM, NEO, LTC, ETH, BNB, BTC, BCH refers to West Texas Intermediate, QTum, Neo, Litecoin, Ethereum, Binance Coin , Bitcoin, Bitcoin Cash , respectively
In tables 2 and table 3, the highest unidirectional correlation is between WTI and 6 crypto-currencies, namely, qtum (0.1261), neo (0.142), ltc(0,115 ), eth( 0,142 ), bnb (0,143), btc ( 0,158 ). Therefore, the mutual information transferred between these 6 crypto-currencies and WTI is large during the COVID-19 pandemic compared to the other pairs of markets, which confirms the effect of the corona virus contagion between them while the low values of unidirectional correlation are observed between Brent and the crypto-currencies. Therefore, the mutual information transferred between the crypto-currencies and Brent is low during the COVID-19 pandemic. This means that the Crypto-currency market shares low information with the Brent market and therefore the legislative changes and the investors’ confidence are less important.
Whereas WTI market less react to the information flow in the system which may suggest that the WTI is more integrated with the financial market than the Brent market (Okorie & Lin, 2020).
Referring to the correlation matrix between seven crypto-currencies, we show that all pairs of crypto-currencies have a significant unidirectional correlation at 1 level. This finding suggests that the pair will always move in the same direction, which confirms the interdependency among the crypto-currency market. Therefore this result is in line with the findings of Yousaf et al. (2020), who found that the correlation among all the crypto-currency pairs is higher during the COVID-19 period than during the pre-COVID-19 period.
In fact, throughout the covid-19 period, the highest correlation coefficient is between ltc and eth, with a median correlation coefficient (0,849), followed by eth and bnb with coefficients of (0,848), (0,815), respectively. This means that the eth has a high correlated with the crypto-currencies selected in our research. This result is then in conformity with that of Canh et al. (2019) and Katsiampa et al. (2019), who found a unidirectional correlation above 0,607 for the series of pairs (ETH-ETH; LTC-BTC; LTC-ETH) using hourly returns Crypto-currenciy data.
Moreover, the distribution of all the series seems to be leptokurtic based on their kurtosis values, which are greater than 3 in all cases. Then, the skewness coefficients result shows that these are some worth negatively skewed in the case of WTI. With respect to the Jarque Bera tests which reject the null hypothesis of normality in all oil prices and Crypto-currency series, therefore, the chosen sample distribution stems actually from a normal distribution with a 1% significant level.
| Table 4A Bivariate Bekk-Garch Estimation For Wti And Seven Crypto Currencies |
|||||||||
|---|---|---|---|---|---|---|---|---|---|
| Variables | QTUM_WTI | NEO_WTI | LTC_WTI | ETH_WTI | BNB_WTI | BTC_WTI | BCH_WTI | ||
| Conditional Mean Equation | |||||||||
| l11 | 0.179941055 0.43072648 |
0.1009301 0.6314718 |
0.0350778 0.8550290 |
0.2668393 0.1404465 |
0.2917814 0.1038160 |
0.2151914 0.1030550 |
0.4841398 0.0134182 |
||
| l22 | 0.244725396 0.01101941 |
0.2389908 0.0154911 |
0.2268010 0.0257377 |
0.3281341 0.0015399 |
0.2930653 0.0023891 |
0.1512684 0.1544136 |
0.3617598 0.0002718 |
||
| Conditional Variance Equation | |||||||||
| a11 | 0.4295172 0.0000000 |
-0.355627 0.0000000 |
-0.367507 0.0000000 |
-0.181371 0.0083291 |
-0.014089 0.7884853 |
-0.167819 0.0001369 |
-0.837498 0.0000000 |
||
| a21 | 0.1616915 0.0044420 |
0.2057115 0.0003054 |
0.1380484 0.0029614 |
0.3340978 0.0000000 |
0.3333307 0.0000219 |
-0.033774 0.5468213 |
-0.32103 0.0002708 |
||
| a12 | 0.0422549 0.0745025 |
-0.008006 0.7067182 |
0.0101263 0.6763945 |
-0.025222 0.3389424 |
0.1179053 0.0000498 |
-0.053683 0.1568251 |
-0.065565 0.1019493 |
||
| a22 | 0.4335026 0.0000001 |
0.4297767 0.0000000 |
0.4491304 0.0000000 |
0.5211613 0.0000000 |
0.5628858 0.0000000 |
0.6243160 0.0000000 |
0.4915608 0.0000000 |
||
| b11 | 0.8599135 0.0000000 |
0.7841981 0.0000000 |
0.8944560 0.0000000 |
0.7931839 0.0000000 |
0.6161856 0.0000000 |
0.5392710 0.0000000 |
0.1926433 0.0081599 |
||
| b21 | 0.0286660 0.2231314 |
-0.02894 0.2310110 |
-0.030346 0.0635084 |
0.2700715 0.0505365 |
-0.887056 0.0000000 |
0.5979663 0.0000000 |
0.1287918 0.0013582 |
||
| b12 | 0.0355964 0.0083528 |
0.0322345 0.2306584 |
0.0164169 0.2749780 |
0.1747202 0.0162319 |
0.4507116 0.0000000 |
-0.61119 0.0000000 |
-0.052533 0.2099885 |
||
| b22 | 0.8985014 0.0000000 |
0.9008363 0.0000000 |
0.8927944 0.0000 |
-0.854732 0.0000000 |
0.5020737 0.000000 |
0.5929726 0.000000 |
0.8877592 0.0000000 |
||
Notes: (i) ***, ** and * means significance at 1%, 5% and 10%; (ii) WTI,QTUM, NEO, LTC, ETH, BNB, BTC, BCH refers to West Texas Intermediate, QTum, Neo, Litecoin, Ethereum, Binance Coin , Bitcoin, Bitcoin Cash , respectively;(iii) The ARCH are employed to test the presence of the ARCH effect Table 4a.
| Table 4b Misspecification Tests |
|||||||
|---|---|---|---|---|---|---|---|
| standardized residuals | |||||||
| Ljung-Box Q1(12) |
18.25994 0.0001 |
18.29122 0.0001 |
18.50898 0.0001 |
18.91594 0.0001 |
20.14031 0.0000 |
19.87883 0.0000 |
18.32751 0.0001 |
| Ljung-Box Q2(12) |
13.41582 0.0012 |
28. 31140 0.0000 |
50. 31677 0.0000 |
10.84980 0.0044 |
6.782129 0.0337 |
6.647006 0.0360 |
18.32751 0.0001 |
| Squared standardized residuals | |||||||
| Ljung-Box Q12(12) |
66.96052 0.0000 |
67.76011 0.0000 |
68.25906 0.0000 |
66.67530 0.0000 |
68.58333 0.0000 |
66.54162 0.0000 |
70.84070 0.0000 |
| Ljung-Box Q22(12) |
36.50130 0.0134 |
25.15678 0.0000 |
60.1319 0.0000 |
33.99928 0.0261 |
46.59902 0.0007 |
12.85559 0.0248 |
70.84070 0.0000 |
Note: for no autocorrelation using L jung-Box Q-statistic test , up to 12 lags . (iiii)Q1(12), Q2(12), )Q12(12), Q22(12), are the auto-correlation coefficients of squared standardized residuals., up to 12 lags Table 4b.
| Table 5A Bivariate Bekk-Garch Estimation For Brent And Seven Cryptocurrencies |
|||||||
|---|---|---|---|---|---|---|---|
| Variables | QTUM_BRENT | NEO_BRENT | LTC_BRENT | ETH_BRENT | BNB_BRNT | BTC_BRENT | BCH_ BRENT |
| Conditional Mean Equation | |||||||
| l11 | 0.011051891 0.96025832 |
0.2192294 0.2741935 |
0.1628196 0.4213035 |
0.2632610 0.1400484 |
0.2082258 0.2560542 |
0.1707830 0.2210668 |
0.1758029 0.3919654 |
| l22 | 0.131468435 0.24902126 |
0.1781866 0.0500133 |
0.1767459 0.0908849 |
0.1895451 0.0853374 |
0.2223507 0.0409773 |
0.1189375 0.2966775 |
0.1829579 0.1065226 |
| Conditional Variance Equation | |||||||
| a11 | -0.196206807 0.00767359 |
0.4495937 0.0000000 |
0.383433 0.0000000 |
-0.195740 0.0015308 |
0.0272839 0.7542900 |
-0.165866 0.0003555 |
0.04687270 0.4180578 |
| a21 | 0.026672163 0.76339521 |
-0.3253368 0.0000031 |
-0.21945 0.0001429 |
0.1209422 0.0983214 |
0.0916177 0.1882058 |
0.0256218 0.5373874 |
0.0852102 0.2184421 |
| a12 | -0.061268462 0.05587161 |
0.0338257 0.0505339 |
0.0485948 0.0167580 |
-0.063813 0.2617412 |
0.0948642 0.0004812 |
-0.033601 0.4207153 |
0.1154246 0.0090480 |
| a22 | 0.660445239 0.00000000 |
0.3595557 0.0000000 |
0.3412615 0.000000 |
0.6040807 0.0000000 |
0.4791281 0.0000000 |
0.5283744 0.0000000 |
0.5488399 0.0000000 |
| b11 | 0.659970767 0.00000000 |
-0.5903124 0.0000002 |
-0.773571 0.0000000 |
0.6769317 0.0000000 |
0.3483539 0.000000 |
0.3077295 0.0000002 |
0.6706501 0.0000000 |
| b21 | 0.873167713 0.00000000 |
0.2139122 0.0718400 |
0.275055 0.0261270 |
0.7911110 0.0000000 |
1.2963616 0.0000000 |
0.9125365 0.0000000 |
0.9179338 0.0000000 |
| b12 | -0.315633459 0.00000000 |
0.0325758 0.4444550 |
0.0519627 0.3114433 |
-0.40000 0.0000000 |
-0.517016 0.0000000 |
-0.73366 0.0000000 |
-0.344609 0.0000000 |
| b22 | 0.460871539 0.00000000 |
0.9321267 0.0000000 |
0.934221 0.0000000 |
0.5139506 0.0000000 |
0.3422290 0.0000000 |
0.2556641 0.0000000 |
0.5716897 0.000000 |
Notes: (i) ***, ** and * means significance at 1%, 5% and 10%; (ii) WTI,QTUM, NEO, LTC, ETH, BNB, BTC, BCH refers to West Texas Intermediate, QTum, Neo, Litecoin, Ethereum, Binance Coin , Bitcoin, Bitcoin Cash , respectively;(iii) The ARCH are employed to test the presence of the ARCH effect Table 5A.
| Table 5B Misspecification Tests |
|||||||||
|---|---|---|---|---|---|---|---|---|---|
| standardized residuals | |||||||||
| Ljung-Box Q1(12) |
35.48186 | 35.97621 | 36.01015 | 34.96772 | 35.64728 | 35.70388 | 34.13210 | ||
| 0.0000 | 0.0000 | 0.00000 | 0.0000 | 0.0000 | 0.0000 | 0.0000 | |||
| Ljung-Box Q2(12) |
12.40588 | 73.55672 | 34.06275 | 8.710982 | 5.523278 | 12.10012 | 8.225575 | ||
| 0.0020 | 0.0000 | 0.0000 | 0.0128 | 0.0632 | 0.0334 | 8.225575 | |||
| Squared standardized residuals | |||||||||
| Ljung-Box Q12(12) |
57.66995 | 58.24763 | 58.31984 | 57.24725 | 58.23980 | 58.15085 | 55.56916 | ||
| 0.000 | 0.00000 | 0.00000 | 0.0000 | 0.0000 | 0.0000 | 0.0000 | |||
| Ljung-Box Q22(12) |
35.55970 | 39.6215 | 56.73071 | 32.19198 | 45.60758 | 5.463908 | 30.78611 | ||
| 0.0173 | 0.0000 | 0.0000 | 0.0413 | 0.0009 | 0.0651 | 0.0581 | |||
Notes : for no autocorrelation using L jung-Box Q-statistic test , up to 12 lags . (iiii) Q1(12), Q2(12), )Q12(12), Q22(12), are the auto-correlation coefficients of squared standardized residuals., up to 12 lags.
The empirical results of the return and the volatility spillovers between West Texas Intermediate Crude oil prices and seven the crypto-currencies, namely (QTUM, NEO, LTC, ETH, BNB, BTC, BCH) obtained from the Bivariate BEKK-GARCH model are presented in table 4, while table 5 reports the estimated results of Brent since the start of the covid -19 pandemic up to December 2020. Regarding the Ljung-Box test (tables 4 and 5), the null hypothesis of no autocorrelation of order (12) for the oil and the crypto-currency series is rejected. More particularly, the auto-correlation coefficients are significant at 5 % level. Indeed, this statistical significance of the coefficients of auto-correlation confirms the existence of a linear and nonlinear dependence for all the considered series, which thus supports our decision to apply the GARCH models to capture the transmission volatility and dynamic conditional correlation between oil prices (WTI, Brent) and the crypto-currencies Table 5b.
The Results of Conditional Mean Equation (Tables 4a and 5a)
Based on the results from the conditional mean equation (l_11), we notice , we notice that the WTI and Brent prices at time t are not significantly affected by their lagged at time t-1 (see line 3 of Table 4 and 5). However, this result is compatible with those of many researchers, such as Hammami et al. (2019) who showed that the current change in the oil markets is not significantly associated with the lagged returns. Conversely, the current change in all the crypto-currencies is significantly affected by the past returns, except in three crypto-currencies, namely the Bitcoin cash, Bitcoin, and Qtum (see line 4 of tables 4 and 5). In fact, this finding seems consistent with the findings of Zih-YingLin, who found that the past crypto-currency returns (LTC, ETH, BTC) present a significant effect on future attention and weak reverse results.
Volatility Transmission Between Crypto-Currencies and WTI
Concerning the transmission of volatility, the coefficients (b_21), we notice that the current volatility of the WTI at time t is affected by the past volatility of five crypto-currencies (LTC, ETH, BNB, BTC, BCH), except in two crypto-currencies, namely (QTUM and Neo), indicating that the past volatility of the crypto-currencies cannot influence the current WTI volatility during the covid-19 period. On the other hand, the coefficients (b_12), the volatility of the WTI spot price at time t has a positive (negative) significant effect on the QTUM, BNB, ETH , BTC and BCH crypto-currencies in the lagged period t+1. Therefore, coefficients (b_12 ) is not significant in all the considered crypto-currencies, which indicates that there is no one-way transmission of the WTI prices to all crypto-currencies.
Consequently, we can say that the results in table (4) show evidence of a bi-directional volatility spillover between the WTI spot price and four crypto-currencies (BTC, BNB, BCH, ETH). However, these results are not similar to the findings of Derbali et al.(2020), who found a unilateral return and volatility spillovers from energy stock indices to the Bitcoin. Based on the transmission of shocks, we note that the coefficients ( a_21) are statistically significant for six pair series (QTUM-BRENT; NEO-BRENT; LTC-BRENT; ETH-BRENT ,BNB-BRNT;BCH-BRENT), indicating that the past shocks in the Crypto-currency can influence the WTI spot price. On the other hand, coefficients (a_12) indicate that the past shocks in the WTI spot price can influence only two considered crypto-currencies (Qtum, BNB ). This result shows that the (NEO, LTC, ETH, BTC, BCH) chocks are not affected by those of the WTI spot prices.
Volatility Transmission Between Crypto-Currencies and BRENT
Firstly, by focusing on the equation of persistence in volatility we can notice that the estimated coefficients of GARCH (b_11) both Brent and WTI present a similar picture.
By looking at the transmission volatility between crypto-currencies and Brent, we can observe that in general, the past volatility of the crypto-currencies can influence the current Brent volatility in most of the considered seven crypto-currencies without distinction. On the other hand, the one-period lagged Brent returns are found to negatively affect the current returns of the six crypto-currencies (QTUM, ETH, BNB, BTC, Neo, BCH ) at 1% level. Consequently, we can say that the results in table 5 show evidence of a close bi-directional volatility spillover between Brent spot Price and six crypto-currencies (QTUM ,ETH , BNB , BTC, BCH , NEO). Moreover, it can be seen that both crypto-currency and Brent markets present an identical volatility transmission during the Covid-19.pandemic.
In addition, in table 5, we see that ( a_21) are statistically significant for three pair series (NEO-BRENT, LT-BRENT; ETH-BRENT), indicating that the past shocks in the selected crypto-currencies ( NEO, LTC and ETH) have an impact on the current shocks of BRENT spot price. As shown in ( a_12), we can conclude that BRENT has the strongest transmission shocks with five crypto-currencies (Qtum, Neo, LTC, BNB, BCH), indicating that the past shocks in the BRENT spot price can influence only the five considered crypto-currencies,which corroborates the existence of bi-directional shocks between Brent and ( NEO,LTC).
However, it is observed that there are no transmission shocks between the Bitcoin and the BTC. Moreover, the BTC currency does not seem to be significantly affected by the macro-financial development during the covid-19 pandemic. In fact, this result is consistent with that of (Erdas & Caglar, 2018).
| Table 6 Bivariate Dcc-Garch Estimation Of Wti And Seven Crypto-Currency |
|||||||
|---|---|---|---|---|---|---|---|
| Variables | QTUM_ WTI | NEO_WTI | LTC_WTI | ETH_WTI | BNB_WTI | BTC_WTI | BCH_WTI |
| ω10 | 16.146863 0.5851813 |
8.331145 0.828646 |
4.244328 0.874674 |
4.212440 0.847115 |
3.281731 0.877930 |
9.707930 0.449388 |
12.62609 0.633997 |
| ω20 | 18.686787 0.2424540 |
19.73076 0.208081 |
21.04638 0.190086 |
20.96694 0.187050 |
18.64908 0.237916 |
24.35671 0.111962 |
17.32352 0.340064 |
| a11 | 0.0133067 0.8809146 |
0.048930 0.382367 |
0.055266 0.346787 |
0.017623 0.863385 |
0.018930 0.846930 |
0.010792 0.920991 |
0.027322 0.734694 |
| a22 | 0.0560700 0.0591492 |
0.056867 0.042005 |
0.060500 0.046301 |
0.055105 0.062828 |
0.050495 0.078992 |
0.053183 0.080215 |
0.050192 0.153126 |
| b11 | 0.7093465 0.1459459 |
0.797923 0.276957 |
0.848519 0.140342 |
0.864027 0.078408 |
0.871382 0.068758 |
0.612297 0.204421 |
0.704724 0.197620 |
| b22 | 0.6083136 0.0240022 |
0.594080 0.023801 |
0.572215 0.034419 |
0.580889 0.030831 |
0.619106 0.019383 |
0.537454 0.039241 |
0.636958 0.036457 |
| δ1 | 0.0796582 0.7612288 |
0.106048 0.685455 |
0.062257 0.819900 |
0.134753 0.571258 |
0.153214 0.405823 |
0.153062 0.310867 |
0.20884 0.36606 |
| δ2 | 0.1729387 0.0007822 |
0.186061 0.000122 |
0.184262 0.000728 |
0.185951 0.000043 |
0.178270 0.000631 |
0.193359 0.000001 |
0.16714 0.13923 |
Notes: (i) ***, ** and * means significance at 1%, 5% and 10%; (ii) WTI,QTUM, NEO, LTC, ETH, BNB, BTC, BCH refers to West Texas Intermediate, QTum, Neo, Litecoin, Ethereum, Binance Coin , Bitcoin, Bitcoin Cash , respectively;(iii) The ARCH are employed to test the presence of the ARCH effect, for no autocorrelation using L jung-Box Q-statistic test , up to 12 lags . (iiii)  are the auto-correlation coefficients of standardized residuals., up to 12 lags .
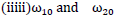 are the constant term of oil and crypto currency , 1= oil,2 = crypto currency.
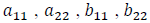 indicates the estimated ARCH and GARCH parameters, respectively
 and
and  shows the time-varying correlation between spot oil prices and Cryptocurrency Table 6.
Notes: (i) ***, ** and * means significance at 1%, 5% and 10%; (ii) WTI,QTUM, NEO, LTC, ETH, BNB, BTC, BCH refers to West Texas Intermediate, QTum, Neo, Litecoin, Ethereum, Binance Coin , Bitcoin, Bitcoin Cash , respectively;(iii) The ARCH are employed to test the presence of the ARCH effect, for no autocorrelation using L jung-Box Q-statistic test , up to 12 lags. (iiii)Q1(12), Q2(12), )Q12(12), Q22(12) are the auto-correlation coefficients of standardized residuals., up to 12 lags . are the constant term of oil and crypto currency , 1= oil,2 = crypto currency. indicates the estimated ARCH and GARCH parameters, respectively.and shows the time-varying correlation for spot oil prices and Cryptocurrency, respectively.
Table 6 and 7 depict the dynamic correlation coefficients for seven crypto-currencies and two oil prices (BRENT and WTI). Moreover, the correlation coefficients for the oil prices and the crypto-currencies can be well observed via (δ1 and δ1) parameters, respectively. Once significant and positive, these parameters indicate that the lagged returns positively affect their current returns. However, the correlation between them proves to be negative and significant, which indicates that the lagged returns negatively affect their current returns. Therefore, the lag order selected by the Akaike and the Bayesian information criteria are (1,d,1). In fact, the last line of tables 6 and 7 shows that the time varying correlation between crypto-currencies during the covid-19 pandemic is significant at 1% level which indicates that the impact of the lagged shocks and that of the dynamic conditional correlation are highly significant. Therefore, these results are in conformity with those of Liu & Serletis (2019), who showed that the mean spillovers are significant in three crypto-currencies, like LTC, BTC and ETH. On the other hand, in a previous study, Ferreira et al. (2020) have found significant DCCA and DMCA correlation coefficients between the return rates and the respective lags for each crypto-currency up to the 30th lag. This results is not consistent with that of Al-Yahyaee et al. (2019) who found that the BTC one-day-lagged returns are not significant for any model, excepting the FIEGARCH model, indicating that past returns do not affect current returns.
| Table 7 Bivariate Dcc-Garch Estimation For Brent And Seven Crypto-Currencies | |||||||
|---|---|---|---|---|---|---|---|
| Variables | QTUM_BRENT | NEO_BRENT | LTC_BRENT | ETH_BRENT | BNB_BRNT | BTC_ BRENT | BCH_ BRENT |
| ω10 | 12.890079 0.646683 |
6.399602 0.875154 |
9.227177 0.740127 |
0.73530 0.97117 |
6.41492 0.77209 |
7.98235 0.56441 |
0.86915 0.972345 |
| ω20 | 15.265818 0.151373 |
10.71457 0.339431 |
13.07578 0.24771 |
13.4339 0.20900 |
14.75403 0.177592 |
13.39549 0.217832 |
10.93654 0.37330 |
| a11 | 0.004754 0.952725 |
0.087207 0.151379 |
0.048072 0.370401 |
0.020651 0.792271 |
0.039259 0.669570 |
-0.00019 0.998446 |
0.031449 0.682090 |
| a22 | 0.125433 0.000098 |
0.165739 0.000001* |
0.088726 0.010446 |
0.118222 0.000305 |
0.084379 0.01511* |
0.107917 0.00175 |
0.133609 0.00010* |
| b11 | 0.757225 0.101879 |
0.756596 0.338465 |
0.744686 0.211427 |
0.917378 0.041123 |
0.799925 0.107684 |
0.677902 0.192035 |
0.926453 0.07120* |
| b22 | 0.213132 0.618927 |
0.311127 0.486423 |
0.390183 0.384652 |
0.300687 0.484239 |
0.330321 0.449455 |
0.328518 0.448147 |
0.379334 0.432862 |
| δ1 | 0.357631 0.1901550 |
0.577259 0.002283* |
0.273258 0.104402 |
0.384914 0.080047 |
0.217622 0.124717 |
0.252271 0.127537 |
0.29633 0.254747 |
| δ2 | 0.208260 0.002008 |
0.190986 0.034240* |
0.209988 0.005736 |
0.202133 0.002770 |
0.207488 0.00377* |
0.225497 0.00001* |
0.224874 0.0043* |
Moving to the results presented in table 7, we notice that the time varying of the BRENT and WTI spot prices is not significant, indicating the independence of oil prices returns on their lag returns, which means that the time varying correlation is weaker than the corresponding that of the crypto-currencies, suggesting strong trends. In fact, tables 6 and 7 present the ARCH and GARCH estimates of the DCC- GARCH model as quoted by (a_11 , b_11 ). Basically, the ARCH and GARCH estimates of the crypto-currencies are statistically significant at 5% and 10% levels, which seems in conformity with the BEKK-GARCH model.
Figures 1 and 2 show the dynamic conditional correlation between each of the sampled crypto-currencies and each spot oil price. In fact, figure 1 shows the top seven sampled crypto-currencies with BRENT while the second figure 2 shows the dynamic conditional correlation trend between the seven crypto-currencies and WTI. On average, we notice a downward trend of all the correlation pairs in April 2020 following the historic downturn in oil prices to 37 dollars the barrel. This means that the traders see crypto-currencies as an hedge for their portfolios during the negative oil prices.

Figure 1: Dynamic Conditional Correlations Between Brent Spot Price And Seven Cryptocurrency.
On the one hand, in figure 1 presents a height dynamic correlation between the two correlation pairs (Brent-BNB; Brent-Qtum) during the covid-19 pandemic while between the BTC and the Neo it is slight. However, for the BCH, LTH and ETH, the correlation is highly volatile throughout, which implies that the crude Brent cannot hedge the risks from all the sampled 7 crypto-currencies. Dynamic conditional correlation between QTUM and Brent varies between -2 % and 3 % on average during the instable period ( covid-19). For this pair, we can distinguish two negative correlation phases during the COVID-19 pandemic; the first took place at the end of December 2019 following the outbreak of COVID-19 and the second appeared between March 17 and April 3, following the worsening of the confinement period in large crowded countries.
Furthermore, we report a negative correlation between BNB and Brent in the COVID-19 timeline: from September 9 to October 25, 2019, then, from March, 3 to 28, 2020 and from April 22 to 25 August, 2020. The first period includes the day on which the corona virus broke out in Yuhan in December 2020. The second period includes the day on which most countries have adopted containment against the virus (March 11, 2020) and the final period is characterized by a weak correlation between Brent and BNB. The last window of the sample includes the period in which the research laboratories announced the production of vaccines to tackle the COVID-19 pandemic. More precisely, the dynamic conditional correlation between Brent and BNB showed a similar behavior compared to the Brent-Qtum pair. In fact, for the two pairs, we observe a remarkable negative correlation on March 2020 when most of the financial markets were interconnected, given that (BNB and QTUM) were safe haven assets for Brent, which confirms the contagion effect of the corona virus between them. This is consistent with the findings of those of (Yousaf et al. 2020; Lahmiri & Bekiros, 2020).
Looking at figure 2, we can see that the most positive correlation is observed for three pairs (QTUM; WTI., BNB;WTI., ETH; WTI) throughout the considered period since these three pairs tend to move in the same directions although this does not hold true for the BTC. As suggested in figure 2, the two normal conditions (14/01/2020-08/02/2020;12/06/2020-31/08/2020)are characterized by a positive varying correlation between the BTC and conventional financial instruments, such as the WTI , while it is negative for short periods during several events in the first half of 2020, such as in January, when the first COVID-19 case was reported in the United States in March during the pandemic outbreak, and from May to July 2020. In fact, during these three events, investors resorted to the BTC to hedge their portfolios following an increase the number of infections around the world and the associated sharp drops in the WTI. Therefore, the inclusion of the BTC in an investment portfolio with the WTI can hedge against risks for a short period of time (up to 70 days). This means that the BTC remains the crypto-currency market leader during the covid-19 period. However, this result is not in conformity with that of Ghorbel & Jeribi (2021) who observed that the BTC is neither a safe haven nor it acts a hedge. In fact, looking at line 2 of figure 2, we notice that the hedging potentials of the WTI for the LTC are not long-lived but are rather short-lived for 25-day periods or for a 40-day one. In fact, this is also the case for the NEO and the BCH, which mean the inclusion of WTI in a portfolio with NEO, LTC and BCH is the best decision of strategy for diversification of crypto-currencies and risk hedging during the covid-19 pandemic.

Figure 2: The Dynamic Conditional Correlation Between The Wti Spot Price And Seven Crypto-Currencies.
Discussion of The Achieved Results and Concluding Remarks
In fact, using intra-day data covering the period from August 2019 to December 31, 2020, the current research sheds light on the volatility spillover and the dynamic conditional correlation between the prices of (WTI, Brent) and seven crypto-currencies during the ovid-19 pandemic. In fact, the aim of this paper is to show whether the sampled crypto-currencies (QTUM, NEO, LTC, ETH, BNB, BTC, BCH) are safe haven assets for the most important international crude oil markets (Bren, WTI) during the covid-19 pandemic period. The two appropriately estimation techniques suggested in this study are the bivariate GARCH models (BEKK-GARCH and DCC-GARCH).
Finally, four important conclusions are drawn from this paper
(i) The findings obtained through the DCC-GARCH model resealed that during the COVID-19 pandemic, the dynamic correlations are almost always positive for three pairs (QTUM; WTI., BNB;WTI.,ETH;WTI) throughout the considered period. On the other hand, the degree of negative conditional correlation is higher for the WTI-BTC duo compared to the Brent -BTC pair. Hence, the portfolio risk is more minimized when investors hold WTI and BTC in their portfolios rather than include assets in Brent and Bitcoin markets. This show that the Saoudi Arabia-Russia oil price war of 2020 has negatively affected oil producers in Texas but not oil producers in North Europe. That being said that Bitcoin becomes dependent on WTI to determine its price. This means that the Bitcoin will be tested as a hedge by both conventional and unconventional investors.
(ii) Turning to Brent, we found that all sampled crypto-currencies have unstable correlations with Brent throughout the COVID-19 period. In fact, these correlations are sometimes positive, negative or close to 0, indicating portfolio diversification benefits. Moreover, we found that only QTUM and BNB are a safe haven during the first five months of the covid-19 pandemic. However, the Brent hedging potential for BNB is long-lived for periods over 5 months. This is also the case for QTUM, which means that QTUM and BNB caught the attention of many investors because they were not hit too hard by downward trend during the covid-19. Therefore, Brent crude oil investors are advised to diversify their portfolios by adding the QTUM and BNB to their Brent oil based portfolios, especially during the considered period. On the other hand, the other crypto-currencies (LTC, BCH, ETH) are weak safe haven or either weak diversifiers.
(iii) On average, the crude oil (WTI and Brent) hedging potential for (BTC, QTUM, BNB) appeared to respond more considerably to the breakout of the COVID-19 in January 2019, where there was a sharp drop of oil prices. This result is consistent with that Iqbal et al. (2021), who contended that BTC can absorb the small shocks caused by the covid-19 and also resist extreme financial market-turmoil conditions.
(iv) We have also noticed that the findings of BEKK-GARCH infer the evidence of the bi-directional volatility between WTI and (BTC, BNB, BCH, ETH). There is also evidence of a volatility spillover between Brent and (QTUM, ETH, BNB,BTC,BCH,NEO). However, this result is not in conformity with that of Bouri et al. (2018a, 2018b), who found that the sampled crypto-currencies are not completely disconnected from the commodity market during the covid-19.pandemic.
Nevertheless, this study can be considered as a starting point for further course of study. The first line of research is to add other conventional financial instruments then the second path is to conduct a comparison between the covid-19 period and other jittery periods, such as those of the Epola Virus and Influenza.
Declarations
Conflict of interest: The author declares that there is no conflict of interest.
References
Abadie, L. M. (2021). Current expectations and actual values for the clean spark spread: The case of Spain in the Covid-19 crisis.Journal of Cleaner Production,285, 124842.
Indexed at, Google Scholar, Cross Ref
Adekoya, O. B., Oliyide, J. A., & Oduyemi, G. O. (2021). How COVID-19 upturns the hedging potentials of gold against oil and stock markets risks: Nonlinear evidences through threshold regression and markov-regime switching models.Resources Policy,70, 101926.
Indexed at, Google Scholar, Cross Ref
Al-Yahyaee, K. H., Mensi, W., Al-Jarrah, I. M. W., Hamdi, A., & Kang, S. H. (2019). Volatility forecasting, downside risk, and diversification benefits of Bitcoin and oil and international commodity markets: A comparative analysis with yellow metal.The North American Journal of Economics and Finance,49, 104-120.
Ashraf, B. N. (2021). Stock markets’ reaction to Covid-19: Moderating role of national culture.Finance Research Letters,41, 101857.
Baba, Y., Engle, R. F., Kraft, D. F., & Kroner, K. F. (1990). Multivariate simultaneous generalized ARCH.Manuscript, University of California, San Diego, Department of Economics.
Indexed at, Google Scholar, Cross Ref
Baek, C., & Elbeck, M. (2015). Bitcoins as an investment or speculative vehicle? A first look.Applied Economics Letters,22(1), 30-34.
Indexed at, Google Scholar, Cross Ref
Baret, S., Celner, A., O’Reilly, M., & Shilling, M. (2020). COVID-19 potential implications for the banking and capital markets sector.Maintaining business and operational resilience. Deloitte Insights,2(2), 96-108.
Baur, D.G., Hong, K., & Lee, A.D. (2018). Bitcoin: Medium of exchange or speculative assets?.Journal of International Financial Markets, Institutions and Money,54, 177-189.
Indexed at, Google Scholar, Cross Ref
Beneki, C., Koulis, A., Kyriazis, N. A., & Papadamou, S. (2019). Investigating volatility transmission and hedging properties between Bitcoin and Ethereum.Research in International Business and Finance,48, 219-227.
Bollerslev, T. (1986). Generalized autoregressive conditional heteroskedasticity.Journal of econometrics,31(3), 307-327.
Indexed at, Google Scholar, Cross Ref
Bollerslev, T. (1990). Modelling the coherence in short-run nominal exchange rates: a multivariate generalized ARCH model.The review of economics and statistics, 498-505.
Indexed at, Google Scholar, Cross Ref
Borgards, O., Czudaj, R. L., & Van Hoang, T. H. (2021). Price overreactions in the commodity futures market: An intraday analysis of the Covid-19 pandemic impact.Resources Policy,71, 101966.
Bouri, E., Das, M., Gupta, R., & Roubaud, D. (2018a). Spillovers between Bitcoin and other assets during bear and bull markets.Applied Economics,50(55), 5935-5949.
Indexed at, Google Scholar, Cross Ref
Bouri, E., Gupta, R., Lahiani, A., & Shahbaz, M. (2018b). Testing for asymmetric nonlinear short-and long-run relationships between bitcoin, aggregate commodity and gold prices.Resources Policy,57, 224-235.
Indexed at, Google Scholar, Cross Ref
Bouri, E., Kachacha, I., & Roubaud, D. (2020). Oil market conditions and sovereign risk in MENA oil exporters and importers.Energy Policy,137, 111073.
Brauneis, A., & Mestel, R. (2018). Price discovery of cryptocurrencies: Bitcoin and beyond.Economics Letters,165, 58-61.
Canh, N. P., Wongchoti, U., Thanh, S. D., & Thong, N. T. (2019). Systematic risk in cryptocurrency market: Evidence from DCC-MGARCH model.Finance Research Letters,29, 90-100.
Ciaian, P., Rajcaniova, M., & Kancs, D. A. (2016). The economics of Bit Coin price formation.Applied economics,48(19), 1799-1815.
Das, D., & Kannadhasan, M. (2018). Do global factors impact bitcoin prices? Evidence from wavelet approach.Journal of Economic Research,23(3), 227-264.
Derbali, A., Jamel, L., Ltaifa, M. B., & Elnagar, A. K. (2020). Return, volatility and shock spillovers of bitcoin with energy commodities.
Indexed at, Google Scholar, Cross Ref
Dyhrberg, A. H. (2016A). Bitcoin, gold and the dollar–A GARCH volatility analysis.Finance Research Letters,16, 85-92.
Dyhrberg, A. H. (2016B). Hedging capabilities of bitcoin. Is it the virtual gold?.Finance Research Letters,16, 139-144.
Engle, R. (2002). Dynamic conditional correlation: A simple class of multivariate generalized autoregressive conditional heteroskedasticity models.Journal of Business & Economic Statistics,20(3), 339-350.
Erdas, M. L., & Caglar, A. E. (2018). Analysis of the relationships between Bitcoin and exchange rate, commodities and global indexes by asymmetric causality test.Eastern Journal of European Studies,9(2).
Falato, A., Goldstein, I., & Hortaçsu, A. (2021). Financial fragility in the COVID-19 crisis: The case of investment funds in corporate bond markets.Journal of Monetary Economics,123, 35-52.
Indexed at, Google Scholar, Cross Ref
Ferreira, P., Kristoufek, L., & Pereira, E. J. D. A. L. (2020). DCCA and DMCA correlations of cryptocurrency markets.Physica A: Statistical Mechanics and its Applications,545, 123803.
Ghorbel, A., & Jeribi, A. (2021). Contagion of COVID-19 pandemic between oil and financial assets: The evidence of multivariate Markov switching GARCH models.Journal of Investment Compliance,22(2), 151-169.
Goodell, J. W., & Goutte, S. (2021). Diversifying equity with cryptocurrencies during COVID-19.International Review of Financial Analysis,76, 101781.
Guesmi, K., Saadi, S., Abid, I., & Ftiti, Z. (2019). Portfolio diversification with virtual currency: Evidence from bitcoin.International Review of Financial Analysis,63, 431-437.
Indexed at, Google Scholar, Cross Ref
Halling, M., Yu, J., & Zechner, J. (2020). How did COVID-19 affect firms’ access to public capital markets?.The Review of Corporate Finance Studies,9(3), 501-533.
Indexed at, Google Scholar, Cross Ref
Hammami, A; Ghenimi, A; Bouri, A. (2019). which are more vulnerable to the oil price volatility, emerging or developed countries stock markets? Journal of Economics and Economic Education Research, 20(2), 1-18.
Hwang, S., & Valls Pereira, P. L. (2006). Small sample properties of GARCH estimates and persistence.The European Journal of Finance,12(6-7), 473-494.
Indexed at, Google Scholar, Cross Ref
Iqbal, N., Fareed, Z., Wan, G., & Shahzad, F. (2021). Asymmetric nexus between COVID-19 outbreak in the world and cryptocurrency market.International Review of Financial Analysis,73, 101613.
Indexed at, Google Scholar, Cross Ref
Jacquier, E., Polson, N. G., & Rossi, P. E. (2002). Bayesian analysis of stochastic volatility models.Journal of Business & Economic Statistics,20(1), 69-87.
Indexed at, Google Scholar, Cross Ref
Ji, Q., Bouri, E., Roubaud, D., & Kristoufek, L. (2019a). Information interdependence among energy, cryptocurrency and major commodity markets.Energy Economics,81, 1042-1055.
Indexed at, Google Scholar, Cross Ref
Ji, Q., Li, J., & Sun, X. (2019b). New challenge and research development in global energy financialization.Emerging Markets Finance and Trade,55(12), 2669-2672.
Indexed at, Google Scholar, Cross Ref
Ji, Q., Zhang, D., & Geng, J. B. (2018). Information linkage, dynamic spillovers in prices and volatility between the carbon and energy markets.Journal of Cleaner Production,198, 972-978.
Katsiampa, P., Corbet, S., & Lucey, B. (2019). Volatility spillover effects in leading cryptocurrencies: A BEKK-MGARCH analysis.Finance Research Letters,29, 68-74.
Klein, T., Thu, H. P., & Walther, T. (2018). Bitcoin is not the New Gold–A comparison of volatility, correlation, and portfolio performance.International Review of Financial Analysis,59, 105-116.
Koutmos, D. (2018). Return and volatility spillovers among cryptocurrencies.Economics Letters,173, 122-127.
Kristoufek, L. (2015). What are the main drivers of the bitcoin price? Evidence from wavelet coherence analysis.PloS one,10(4), e0123923.
Lahmiri, S., & Bekiros, S. (2020). The impact of COVID-19 pandemic upon stability and sequential irregularity of equity and cryptocurrency markets.Chaos, Solitons & Fractals,138, 109936.
Lin, Z. Y. (2021). Investor attention and cryptocurrency performance.Finance Research Letters,40, 101702.
Indexed at, Google Scholar, Cross Ref
Liu, J., & Serletis, A. (2019). Volatility in the cryptocurrency market.Open Economies Review,30, 779-811.
Liu, Y., Sheng, J., & Wang, W. (2020). Do cryptocurrencies have fundamental values.Available at SSRN.
Indexed at, Google Scholar, Cross Ref
Mensi, W., Sensoy, A., Vo, X. V., & Kang, S. H. (2020). Impact of COVID-19 outbreak on asymmetric multifractality of gold and oil prices.Resources Policy,69, 101829.
Indexed at, Google Scholar, Cross Ref
Mnif, E., Jarboui, A., & Mouakhar, K. (2020). How the cryptocurrency market has performed during COVID 19? A multifractal analysis.Finance research letters,36, 101647.
Indexed at, Google Scholar, Cross Ref
Okorie, D. I., & Lin, B. (2020). Crude oil price and cryptocurrencies: Evidence of volatility connectedness and hedging strategy.Energy economics,87, 104703.
Indexed at, Google Scholar, Cross Ref
Palombizio, E., & Morris, I. (2012). Forecasting Exchange Rates using Leading Economic Indicators. Open Access Scientific Reports 1 (8):1–6.
Indexed at, Google Scholar, Cross Ref
Phan, D. H. B., & Narayan, P. K. (2020). Country responses and the reaction of the stock market to COVID-19—A preliminary exposition.Emerging Markets Finance and Trade,56(10), 2138-2150.
Indexed at, Google Scholar, Cross Ref
Salisu, A. A., Ebuh, G. U., & Usman, N. (2020). Revisiting oil-stock nexus during COVID-19 pandemic: Some preliminary results.International Review of Economics & Finance,69, 280-294.
Singhal, S., & Ghosh, S. (2016). Returns and volatility linkages between international crude oil price, metal and other stock indices in India: Evidence from VAR-DCC-GARCH models.Resources Policy,50, 276-288.
Topcu, M., & Gulal, O. S. (2020). The impact of COVID-19 on emerging stock markets.Finance Research Letters,36, 101691.
Van Wijk, D. (2013). What can be expected from the BitCoin. Erasmus Universiteit Rotterdam, 18.
Yermack, D. (2015). Is Bitcoin a real currency? An economic appraisal. InHandbook of digital currency(pp. 31-43). Academic Press.
Yin, L., Nie, J., & Han, L. (2021). Understanding cryptocurrency volatility: The role of oil market shocks.International Review of Economics & Finance,72, 233-253.
Indexed at, Google Scholar, Cross Ref
Yousaf, I., & Ali, S. (2020). The COVID-19 outbreak and high frequency information transmission between major cryptocurrencies: Evidence from the VAR-DCC-GARCH approach.Borsa Istanbul Review,20, S1-S10.
Yousaf, I., Ali, S., Bouri, E., & Saeed, T. (2020). Information transmission and hedging effectiveness for the pairs crude oil-gold and crude oil-Bitcoin during the COVID-19 outbreak.Economic Research-Ekonomska Istrazivanja,35(1), 1913-1934.
Indexed at, Google Scholar, Cross Ref
Received: 18-Jan-2023, Manuscript No. JEEER-23-13140; Editor assigned: 21-Jan-2023, Pre QC No. JEEER-23-13140 (PQ); Reviewed: 18-Feb-2023, QC No. JEEER-23-13140; Revised: 28-Feb-2023, Manuscript No. JEEER-23-13140(R); Published: 02-Mar-2023