Research Article: 2025 Vol: 29 Issue: 5S
Design and Development of Performance Measurement Scale: An Analytical Study on Exports through E-Tailing in India
Aanchal Singh, Dr. APJ Abdul Kalam Technical University
Ram Komal Prasad, Institute of Cooperative and Corporate Management
Research and Training (ICCMRT), Lucknow
Citation Information: Singh, A., & Prasad, R.K. (2025). Design and development of performance measurement scale: an analytical study on exports through e-tailing in india. Academy of Marketing Studies Journal, 29(S5), 1-16.
Abstract
Aim: This study aim to design and validate a measurement scale for performance measurement of e-tailing export from India through e-commerce platforms. Design/methodology/approach: A three-stage psychometric systematic procedure was employed for scale design for present study, which followed a step-by-step procedure starting from item generation and selection, confirmatory factor analysis, convergent and discriminant validity, and finally scale validation through nomological validity assessment. Further, a conceptual framework was utilized to evaluate the accuracy of factors influencing the performance of e-tailing exports in India. Findings: The study has resulted 8 factors (Organizational and internal, financial, digital marketing, inventory management, logistics, export compliances, government support, local & global taxation) with 62 multi-dimensional constructs for measuring the performance of e-tailers engaged in cross-border trade (CBT) e-commerce. The psychometrically developed scale demonstrated consistency across different samples and successfully met the required reliability and validity criteria, with all values falling within acceptable limits. Real-World Applications: Scientifically derived multi-dimensional constructs will support academicians, administrators, and regulators in developing process-oriented systems for enhancing e-tailers’ performance in CBT e-commerce. Originality/value: This study represents a pioneering effort to create a validated scale to measure the performance of e-tailers, engaged in retail (B2C) exports through e-commerce. Funding Statement: The study was not supported by any kind of grant or financial aid. Ethical Compliance: All procedures performed in studies involving human participants were in accordance with the ethical standards of the institutional and/ or national research committee and with the 1964 Helsinki Declaration and its later amendments or comparable ethical standards.
Keywords
E-Tailing, E-Commerce, Export, scale Design and Development.
Introduction
The rises of the Internet and swift technological advancements have transformed how businesses function, especially in e-commerce. Over the past decade, electronic retailing (e-tailing) has experienced tremendous growth, with more consumers embracing the convenience of online shopping. This trend has been particularly pronounced in the business-to-consumer (B2C) segment, where Indian e-tailers have become important participants in the e-commerce sector worldwide.
Cross-border e-commerce, involving online buying and selling of goods and services across international boundaries, has become increasingly widespread in recent years. This growth can be linked to several factors such as greater Internet access, expanding consumer markets, and enhanced logistics infrastructure. Indian e-tailers have acknowledged the opportunities presented by cross-border e-commerce and proactively broadened their operations to enter international markets.
However, the success of cross-border e-commerce presents unique challenges that differ from those of domestic e-commerce. Cultural differences, legal and regulatory frameworks, payment systems, logistics, and customer preferences play a crucial role in determining the performance of B2C services for Indian e-tailers in the cross-border context. To effectively navigate these challenges and achieve sustained success, e-tailers must identify and analyze the factors that influence their performance in cross-border e-commerce.
This study aims to create a comprehensive scale to assess the factors that affect the performance of B2C for Indian e-tailers in cross-border e-commerce. By analyzing these factors and their connection to performance outcomes, this study seeks to offer valuable insights and guidance for e-tailers, policymakers, and researchers engaged in cross-border businesses.
To accomplish this goal, a mixed-methods strategy was utilized that integrated both qualitative and quantitative methods. Initially, an extensive literature review was conducted to identify the key factors influencing the performance of B2C services for Indian e-tailers in cross-border e-commerce. Subsequently, qualitative information was gathered through detailed interviews and focus group discussions with industry experts, e-tailers, and consumers to obtain more comprehensive insight into these factors.
Based on the insights gained from the qualitative phase, a comprehensive scale was developed to measure the identified factors quantitatively. This scale was validated through a large-scale survey conducted using a representative B2C sample. The collected data will be analyzed using statistical methods, including exploratory factor analysis and structural equation modeling, to establish the relationship between the identified factors and performance outcomes.
By providing a robust measurement scale and empirical data regarding the factors impacting the performance of B2C, this research aims to contribute to both academic knowledge and real-world applications. The results of this study will aid e-tailers in formulating effective strategies, policymakers in creating supportive frameworks, and researchers in advancing their understanding of cross-border e-commerce dynamics in the Indian environment.
Review of Relevant Literature
The Internet enables quick access to customer information through instant communication and around-the-clock availability. Additionally, online marketing presents a wider range of choices and greater flexibility (Lamoureux, 1997, p. 106), and simultaneously reduces the need for large inventories, storage expenses, utility costs, and rental space (Avery, 1997, p. 79-81). Individuals frequently connect Internet marketing with direct marketing because businesses involved in online marketing often simplify the supply chain process (Edwards, et al., 1998, p 32-34) and incur lower commission and operational expenses. A distinctive characteristic of e-commerce is its capacity to function both as a platform for transactions and a means of physical distribution for specific products. These benefits are most effectively harnessed by businesses that offer digital products and services, including consulting, telemedicine, insurance, banking, tax preparation, stock brokerage, online ticketing and reservations, news, software, music, and other financial services. Utilizing the Internet as a distribution channel can significantly lower delivery costs while guaranteeing the immediate delivery of products and services.
García et al. (2001) defined an e-commerce model aimed primarily at simplifying the process for organizations to enter online commerce. The suggested architecture includes two key elements: a visual catalog designer tool that enables the enterprise to develop and maintain its own e-catalogs and an e-commerce web server that hosts these e-catalogs, allowing clients to browse them easily. This model combines two primary segments of e-commerce: business-to-business (B2B) e-commerce and consumer-oriented e-commerce. The B2B aspect arises from the relationship between the supplier organization that seeks to publish its e-catalogs and the e-commerce organization that provides the necessary infrastructure. A mutually beneficial relationship exists between the supplier and e-commerce organizations, as both depend on one another to achieve success in their operations. The B2C aspect emerges from the collaborative relationships between e-commerce organizations and multiple suppliers, creating a comprehensive online storefront that showcases all available e-catalogs. Another notable feature of the proposed model is its ability to reduce the supplier organization's reliance on third parties, enabling small enterprises to establish a presence in the global online marketplace with modest investment.
Miyazaki et al. (2001) study was based on primary and secondary data collected through simple random sampling in the USA. Subsequently, a questionnaire was distributed to investigate the challenges of Internet privacy and security that influence e-commerce businesses and their clients. The findings of this study indicate that individuals with greater Internet experience tend to have reduced risk perceptions related to online shopping and fewer specific worries about system security and fraud from online retailers; however, they express increased concerns about online privacy. Engagement in alternative remote purchasing methods was found to correlate with the decreased risk perceptions associated with online shopping. Ultimately, the findings suggest that perceived risk partially mediates the influence of Internet experience on online purchasing behavior. Given the fast-paced development of consumer-focused online commerce, there is a pressing need for ongoing and frequent research to explore how risk perceptions affect online purchasing decisions, how retailers can address these perceptions, and how the management of such risks may influence consumer well-being.
Numberger et al. (2005) conducted research using primary data, which included approximately 50 semi-structured interviews, along with two group interviews, one consisting of seven participants. Fourteen consumers participated in a web survey featuring 13 open-ended questions. Face-to-face and telephonic interviews were conducted. This research could gain advantages not only from the integration of existing e-commerce adoption literature but also from a comprehensive framework designed for long-term forecasting. Future research opportunities can be found by utilizing diverse forecasting and foresight methodologies, such as system dynamics, scenario analysis, cross-impact assessments, and trend analysis. Moreover, the framework highlights the less prominent connections identified through the cross-functional approach, including perceived overall security and its relationship with e-commerce adoption. It also addresses the impact of e-commerce on environmental factors, such as the organization of cultural industries, and examines relationships that interact indirectly with e-commerce, such as the political landscape. This opens avenues for exploring cause-and-effect relationships and conducting relevant quantitative analysis.
Organizational and Internal Factors
Terzi (2011) outlined the potential of e-commerce, whereas Holland and Leefmans (2018) examined how the size of an e-commerce platform influences sales opportunities. Conversely, Faherty et al. (2017) focus on the monopoly threats posed by platforms, increasing their own private label brands. A research gap was identified, indicating the need to explore the potential of cross-border e-tailing and its impact on the performance of cross-border e-tailers.
Financial Factors
Wymer and Regan (2005) identified investment as a significant barrier to the adoption and use of e-commerce by SMEs. This finding is further supported by Dahbi and Benmoussa (2019), who also highlighted technological and financial challenges as the most influential barriers. Both studies focus on SMEs and do not specifically address e-retailers, indicating the need to investigate the impact of financial factors on e-retailers. Therefore, financial factors were considered a secondary influencing element in this research.
Digital Marketing
The importance and impact of Digital Marketing tools, techniques, and aspects have been studied by many scholars who have explored the impact and importance of Reviews, Seller Reputation [Tadelis S. (2016), Saura J. R. et al. (2017)], Brand Awareness, Search Engine Optimization (SEO) [Baye M. R. et al (2016)], E-mail Marketing [Hudak M. et al (2017)], e-WOM or e-word of mouth [Yana Q. et al (2018)], customization [Abdallah S. & Jaleel B. (2014)], social media presence and support [Freidrich T. et al (2016)] and social media promotion [Ortiz M.P.P. et al (2014), Ljungmark P. & Bernhardsson E. (2011)] on SME and e-commerce companies. However, the impact of these digital marketing factors on the performance of Indian e-tailers is unclear and requires further study.
Inventory Management
Patil and Divaker (2014) highlight the importance of proper inventory management for demand fluctuation, stock-out issues, multichannel shoppers, and return management, and its strong relationship with customer satisfaction and sales enhancement. Furthermore, Overseas warehousing issues have been raised by Liu et al. (2015) and Xue et al. (2016). The coverage of these studies is either within India [Patil H & Divaker R. (2014)] or for Chinese e-tailers [Liu X. et al (2015), Xue W. et al (2016)] hence, the impact of inventory management was taken as the fourth factor in the current study.
Logistics Management
Various logistics-related issues have been highlighted by scholars, such as efficient Logistics networks and services Zhao (2019, Reddy A.N. & Divekar R. (2014), Express Delivery Kim, et al. (2017), options [Reddy A.N. & Divekar R. (2014), Hawk S. (2004)], and e-integration Kawa & Zdrenka (2016). However, these studies fail to answer the impact of logistics factors on Indian CBT e-tailers; hence, research is needed to fill this gap.
Export Compliance
Research scholars have raised various export compliance-related issues as barriers to cross-border e-commerce, such as poor customs clearance services, imperfect supervision systems and export settlement difficulties Fang Y. (2017)], corruption [Babenko V. (2019)], regulation quality and tariffs Cho & Lee (2017), legal requirements of e-commerce Elia et al. (2019) and coping with regulations of the host country Jalali S.H. & Soleimani M. (2014)]. Scholars have also focused on the requirement for a better legal mechanism for cross-border trade [Liu X. et al (2015)]] and government regulatory support [Ilin V. et al (2017)] are also focused by scholars. Although these compliance issues have been identified, the impact of such compliance on Indian CBT e-tailers has not been covered by these studies. Hence, export compliance was taken as an impacting factor in this study.
Government Support
The lack of governmental support for e-commerce adoption has been highlighted by Ilin et al. (2012) and Alghamdi et al. (2013), particularly in the context of developing international e-commerce amid globalization, as noted by Babenko et al. (2019). This creates a gap in the literature and underscores the need to investigate the impact of government support on cross-border e-tailers’ performance.
Local and Global Taxation
Global taxation has emerged as a current barrier in CBT with the recent adoption of taxability on non-resident sellers by many countries (the United Kingdom, Australia, Germany, European Federation, and Canada), where earlier e-commerce sales by non-resident sellers do not come under the orbit of local tax. Scarsella (2019), in her study, raised multiple issues related to taxation, such as unawareness of individuals for their tax liability and non-registration of foreign entrepreneurs. Similarly, Yapara (2015) addresses jurisdictional issues by examining how different countries evaluate goods and services, implement diverse tax policies and rates, and contend with double taxation. Furthermore, the introduction of GST has impacted the export sector. Hence, it is important to understand the impact of domestic and international taxation on Indian CBT e-tailer performance, which remains a research gap.
Design and Development of Scale
In our study, we adopted the procedure for the scale development of the Jr. Churchill (1979), the procedure and it is taken into the relevant parameters of our objective of study for developing a generalized model of scale that is likely to be all pervasive in e-commerce platforms and to be used by entrepreneurs to estimate the performance measurement. We opted for three stages for scale development purposes: the first stage was the identification, generation, and selection of variables and items: the second stage was the primary design of the focused scale and the inclusion of expert opinion. The third stage was the testing and validation of the scale and the generalization of its application.
The adopted procedure is as per below figure.
Phase 1 - Qualitative Inquiry and Item Generation
The dimensions of overall performance in e-tailing exports in India by entrepreneurs and businesses were captured in two phases: first, from intensive review and identification of variables and items, and second, from focused discussion with exporters and entrepreneurs working on different platforms of e-tailing exports. Initially, 115 items from nine variables were identified in tune with experts and identified from the literature. We also renamed a few items and variables that overlapped or repeated ideas; hence, we proceeded to the second phase of scale refinement.
Content Validity and Expert Opinion
Initially, the instrument comprised 115 items and 9 constructs. The instrument derived from this was subjected to expert evaluation to assess its content. Content validity refers to the extent to which items on a scale accurately represent the domain or universe of the concept being studied (Talavera, 2004). Specifically, the panel review assisted the researcher in evaluating both the comprehensiveness and relevance of the identified constructs in the context of the Indian market. Additionally, the research instrument was trialed with a sample of ten participants (Malhotra, 2007), which included three experienced academics specializing in international marketing. These professionals, each with over a decade of research experience and leadership roles in their organizations, provided valuable insights during the pretesting phase. The panel was expanded to include five e-tailers from diverse industries, all of whom had 10–15 years of experience in e-commerce exports. In addition, two consultants with over 15 years of expertise in export management were brought in to evaluate the instrument.
Each participant was tasked with evaluating the instrument for clarity, potential bias, ease of comprehension, item ambiguity, and the relevance of each item within the context of cross-border e-commerce in India. The feedback provided was integrated into the instrument; 23 items were removed, and a few small modifications were applied to the questionnaire. The final questionnaire, with 9 constructs and 93 items, was finalized.
Phase 2: Refinement of the Scale/ Pilot study
A pilot study was initiated to capture the relevance of the variables and items for which we collected data from 71 respondents who were actually doing the task on various e-commerce platforms. The questionnaire was structured into two parts. The first part was dedicated to collecting personal information, which included gender, age, education, years in the field, years of experience in e-commerce business, business model, mode of selling, and business potential. The second section comprised 93 items, encompassing the nine identified constructs. Eighty respondents from cross-border e-commerce participated in the pilot test of the items. During this phase, the instrument was completely refined, following the guidelines proposed by Churchill (1979). These steps encompass item and reliability analysis, exploratory factor analysis (EFA), confirmatory factor analysis (CFA), and evaluation of non-response and common method bias. The following section outlines the scale refinement procedure.
Data Collection and Sampling Methodology
The retained instrument from the second phase was initiated to test the reliability, validity, and applicability to assess the goodness of fit of entrepreneurs and business. In this process we collected massive data as per the population which was identified the population from whole India from various organization such as FIEO, FICCI, contacted MSMEs from DGFT office, various portals like Amazon and E-bay and in totality we have obtained the universe as more than 1,00,000.00 A simple random sampling method was followed to collect the actual data and sample size was determined through Israel Glens D Formula 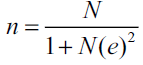
Israel (1992) where n is Sample size, N is Population size, and e is the level of precision (sampling error). In our study, we obtained a degree of precision as , hence the sample size was determined to be 398. To collect this number of responses, we administered it to more than 450 entrepreneurs and followed them regularly to receive their responses. In the final ready stage, we obtained 399 reliable responses that required more than a year of effort. The data were processed according to the structure of the demographic information and the overall performance information on a Likert scale. Table 1 presents the respondents’ profiles.
| Table 1 Respondent Profile | ||
| Classification | No. of Respondents | % of Total |
| Gender | ||
| Male | 368 | 91.8% |
| Female | 33 | 8.2% |
| Age Group | ||
| Less Than 20 Years | ||
| 20-29 | 50 | 12.5% |
| 30-39 | 237 | 59.1% |
| 40-49 | 85 | 21.2% |
| More Than 50 | 29 | 7.2% |
| Educational Qualification | ||
| Higher Secondary | 22 | 5.5% |
| Graduate | 158 | 39.4% |
| Post-Graduate | 215 | 53.6% |
| Others | 6 | 1.5% |
| No. of years in business. | ||
| Less than a year | 6 | 1.5% |
| 1-5 | 79 | 19.7% |
| 6-10 | 141 | 35.2% |
| 11-15 | 102 | 25.4% |
| More than 15 years | 73 | 18.2% |
| No. of years in B2C Cross border e-commerce business | ||
| Less than a year | 17 | 4.2% |
| 1-5 | 169 | 42.1% |
| 6-10 | 141 | 35.2% |
| 11-15 | 57 | 14.2% |
| More than 15 years | 17 | 4.2% |
| Business Model | ||
| Brand Owner with Self Manufacturing | 130 | 32.4% |
| Brand Owner with Contract Manufacturing or private labeling | 85 | 21.2% |
| Retail-exporter of other brands products | 79 | 19.7% |
| Both Brand owner and retail exporter of other brand products | 107 | 26.7% |
| Mode of e-tailing | ||
| Own web store | 6 | 1.5% |
| e-commerce portals | 265 | 66.1% |
| Both | 130 | 32.4% |
| Revenue Generator among Mode of e-tailing | ||
| Own web store | 11 | 2.7% |
| e-commerce portals | 350 | 87.3% |
| Both | 40 | 10.0% |
Reliability Test for Items
The initial and crucial step in the analysis involved refining the scale through the calculation of Cronbach’s α (coefficient α) and corrected item-total subscale correlations, as outlined by Churchill (1979). The adjusted item-total subscale correlations for each item cluster were evaluated. Organizational and Internal Factors (OF), financial factors (FF), Digital Marketing (DM), Inventory Management (IM), logistics (LG), export compliance (EC), Government Support (GS) and Local and Global Taxation (LGT). Items that did not have a corrected item-total correlation ranging from 0.30 to 0.70 were removed from the analysis (Tian et al., 2001; Zaichkowsky, 1985). Following a thorough review of the item content for domain relevance, two items with corrected item-total correlations below 0.30 were removed.
To validate any applied measures, it is essential to calculate the reliability of the factors (Nunnally, 1994). The Cronbach’s α evaluates the reliability of the instrument and measures the consistency of the developed scale based on the collected responses. Additionally, Nunnally (1994) indicated that the minimum acceptable value for Cronbach’s α should be greater than 0.60, and values exceeding this value are regarded as highly reliable. This study applied the Internal Consistency method to evaluate the reliability of the instrument, analyzing each item individually within various groups (i.e., Organizational and Internal Factors (OF), financial factors (FF), Digital Marketing (DM), Inventory Management (IM), logistics (LG), export compliance (EC), Government Support (GS), Local and Global Taxation (LGT) and overall performance (OP). The calculated α coefficient for these practices ranged between 0.73 and 0.89, indicating strong evidence of the reliability of the developed scales. The Cronbach’s α values are presented in Table 2.
| Table 2 Reliability Analysis | ||
| Construct/Factors | Cronbach's Alpha Value | No. of Items |
| OF | .786 | 10 |
| FF | .752 | 5 |
| DM | .794 | 12 |
| IM | .771 | 10 |
| LG | .731 | 7 |
| EC | .773 | 14 |
| GS | .892 | 15 |
| LGT | .803 | 10 |
| OE | .762 | 10 |
Exploratory Factor Analysis (EFA)
Exploratory Factor Analysis (EFA) is a statistical method designed to investigate the connections between large groups of variables and uncover the shared underlying factors that explain these connections (Prasad and Subbaiah, 2011). EFA aims to identify the relationship between the observed and latent variables. In this study, Principal Component Analysis (PCA) with varimax rotation was applied to eight independent variables and one dependent variable, consisting of 93 items, to extract the underlying factors (Costello and Osborne, 2005/2011). Factor loadings indicate the strength of the association between each item and a specific factor or practise. Higher loadings signify that an item is better representative of the factor. In this study, items were removed if their factor loadings were below 0.50 (Karatepe et al., 2005) or communalities less than 0.30 (Hair et al., 2010). For this study, a more conservative threshold of 0.40 or above was applied to determine significant factor loadings (Hair et al., 2010). To assess the suitability of the data for factor analysis, the Kaiser-Meyer-Olkin (KMO) measure of sampling adequacy and Bartlett’s test of sphericity were employed. A KMO value of 0.60 or higher is generally considered acceptable for conducting factor analysis (Tabachnick and Fidell, 2012).
The initial exploratory factor analysis (EFA) revealed a model consisting of nine distinct factors, each exhibiting an eigenvalue exceeding 1. These nine factors collectively explained 68.95% of the variance among the assessed items with a KMO value of 0.87. This high KMO value indicates that the data are suitable for factor analysis and suggests the potential to consolidate the data into a more manageable number of underlying factors. Additionally, Bartlett's test of sphericity yielded a significant result (p < 0.01), which tested the hypothesis that the correlation matrix is an identity matrix. A significant finding indicated that the variables were correlated, supporting the use of factor analysis. Communalities range from 0.38 - 0.92. From the initial set of 93 items, 18 were eliminated for two primary reasons: first, three items exhibited factor loadings below 0.40, and second, three items displayed cross-loadings on different factors. Ultimately, 75 items corresponding to all nine factors were retained during this stage of the analysis. The resulting pattern matrices are presented in Table 3.
| Table 3 Final Pattern Matrix After Deletion | |||||||||
| Items | OF | FF | DM | IM | LG | EC | GS | LGT | OP |
| OF2 | 0.403 | ||||||||
| OF3 | 0.412 | ||||||||
| OF4 | 0.519 | ||||||||
| OF6 | 0.590 | ||||||||
| OF7 | 0.665 | ||||||||
| OF8 | 0.446 | ||||||||
| OF9 | 0.517 | ||||||||
| OF10 | 0.473 | ||||||||
| FF1 | 0.430 | ||||||||
| FF2 | 0.439 | ||||||||
| FF3 | 0.495 | ||||||||
| FF4 | 0.449 | ||||||||
| DM1 | 0.518 | ||||||||
| DM5 | 0.651 | ||||||||
| DM6 | 0.558 | ||||||||
| DM7 | 0.555 | ||||||||
| DM8 | 0.602 | ||||||||
| DM9 | 0.541 | ||||||||
| DM10 | 0.565 | ||||||||
| DM11 | 0.542 | ||||||||
| DM12 | 0.535 | ||||||||
| IM1 | 0.670 | ||||||||
| IM2 | 0.407 | ||||||||
| IM3 | 0.488 | ||||||||
| IM4 | 0.437 | ||||||||
| IM5 | 0.575 | ||||||||
| IM7 | 0.440 | ||||||||
| IM8 | 0.402 | ||||||||
| IM9 | 0.541 | ||||||||
| IM10 | 0.406 | ||||||||
| LG3 | 0.495 | ||||||||
| LG5 | 0.404 | ||||||||
| LG6 | 0.422 | ||||||||
| LG7 | 0.508 | ||||||||
| EC1 | 0.450 | ||||||||
| EC4 | 0.457 | ||||||||
| EC6 | 0.714 | ||||||||
| EC7 | 0.537 | ||||||||
| EC8 | 0.405 | ||||||||
| EC9 | 0.492 | ||||||||
| EC10 | 0.418 | ||||||||
| EC11 | 0.400 | ||||||||
| EC12 | 0.596 | ||||||||
| EC13 | 0.433 | ||||||||
| GS1 | 0.548 | ||||||||
| GS2 | 0.595 | ||||||||
| GS3 | 0.475 | ||||||||
| GS4 | 0.659 | ||||||||
| GS5 | 0.597 | ||||||||
| GS6 | 0.808 | ||||||||
| GS7 | 0.783 | ||||||||
| GS8 | 0.556 | ||||||||
| GS9 | 0.781 | ||||||||
| GS10 | 0.535 | ||||||||
| GS11 | 0.579 | ||||||||
| GS12 | 0.533 | ||||||||
| GS13 | 0.631 | ||||||||
| GS14 | 0.609 | ||||||||
| GS15 | 0.663 | ||||||||
| LGT1 | 0.549 | ||||||||
| LGT3 | 0.405 | ||||||||
| LGT5 | 0.524 | ||||||||
| LGT6 | 0.630 | ||||||||
| LGT7 | 0.571 | ||||||||
| LGT8 | 0.491 | ||||||||
| LGT9 | 0.518 | ||||||||
| LGT10 | 0.429 | ||||||||
| OP2 | 0.514 | ||||||||
| OP3 | 0.512 | ||||||||
| OP5 | 0.442 | ||||||||
| OP8 | 0.610 | ||||||||
| OP9 | 0.467 | ||||||||
| OP10 | 0.541 | ||||||||
In addition, an exploratory factor analysis was conducted to evaluate the dimensional structure of the dependent variable, which consisted of nine items. A one-dimensional factor solution was identified with an eigenvalue of 3.73, accounting for 53.40% of the variance within the dataset. The Kaiser-Meyer-Olkin (KMO) statistic, which measures sampling adequacy, was 0.877, suggesting adequate inter-correlations among the variables. Bartlett’s test of sphericity yielded significant results, further validating factor analysis.
Bias Assessment- a Common Method
A key concern in relying on self-reported data from a single respondent is the risk of common method variance (CMV). To address the potential issue of common method variance (CMV) in self-reported data from a single respondent, this study implemented Harmon’s one-factor test as outlined by Podsakoff et al. (2003). This test operates on the premise that, if significant common method variance (CMV) exists, the unrotated factor analysis will either yield a dominant single factor or show that one overarching factor explains most of the covariance between the independent and dependent variables (Zu et al., 2010). Harmon’s single-factor test indicated that all the nine factors were successfully derived from the complete variable set. The findings revealed the presence of multiple factors in the unrotated PCA solution for all variables, with the primary factor accounting for 19.71 percent of the total variance of 68.95 percent. Although this test does not entirely eliminate the risk of common method variance, the findings suggest that self-report bias from single respondents is unlikely to significantly impact the results of this study.
Non-response Bias
Non-response bias was evaluated through mail surveys and statistical analyses that compared significant differences between the initial and final groups of respondents (Talib et al., 2013; Kureshi et al., 2010). In this approach, a comparison was made between the first 20 respondents and final 20 respondents. The findings were confirmed using t-tests conducted at the 95 percent confidence level (p ≤ 0.05) for the two groups. The analysis indicated that there were no notable differences in the recognition of factors affecting the performance of e-tailers in cross-border e-commerce between early and late respondents. As a result, the data did not show any signs of non-response bias, suggesting that this is unlikely to be an issue in this research.
Phase 3: Scale Testing & Validation
Following the scale refinement phase, we proceeded with the scale validation process, as illustrated in Figure 1. The primary objectives of validating the developed scale include ensuring that the confirmatory factor model could be replicated on an independent sample, thereby minimizing potential errors associated with random variation (MacCallum et al., 1992; Chin and Todd, 1995); assessing nomological validity by investigating the relationships between independent variables and Overall Performance (OP) (Kaynak, 2003; Zu et al., 2008; Talib et al., 2013); and establishing the scale's utility by demonstrating some level of predictive validity for the measures of the independent factors (Arnold and Reynolds, 2003). The subsequent steps in the scale validation phase are outlined below.

Figure 1 Identification of Constructs and Relevant Variables/Factors
Source: Authors own work.
Convergent and Discriminant Validity
To assess reliability and validity, the methodology used during the scale-refinement phase was repeated. Table 4 shows that in the validation sample, each construct exhibited coefficients of 0.4 or higher, with composite reliability (CR) estimates ranging from 0.43- 0.89. Additionally, the corrected item-to-total correlations varied from 0.55 and 0.89. These estimates strongly indicate the reliability of the constructs (Nunnally, 1994; Fornell and Larcker, 1981).The average variances extracted (AVEs) varied between 0.50 and 0.71, with all factor loadings being 0.51 or higher (Bagozzi et al., 1991; Hair et al., 2010).The results confirmed that the validation model exhibited strong convergent validity.
| Table 4 Pearson’s Correlation Analysis of Factors Impacting the Overall Performance | |||||||||
| OF | FF | DM | IM | LG | EC | GS | LGT | OP | |
| OF | 1 | ||||||||
| FF | 0.729*** | 1 | |||||||
| DM | 0.723*** | 0.764*** | 1 | ||||||
| IM | 0.776*** | 0.634*** | 0.704*** | 1 | |||||
| LG | 0.626*** | 0.593*** | 0.646*** | 0.775*** | 1 | ||||
| EC | 0.783*** | 0.725*** | 0.756*** | 0.744*** | 0.807*** | 1 | |||
| GS | 0.679*** | 0.867*** | 0.577*** | 0.690*** | 0.658*** | 0.897*** | 1 | ||
| LGT | 0.743*** | 0.677*** | 0.602*** | 0.819*** | 0.873*** | 0.796*** | 0.824*** | 1 | |
| OP | 0.618*** | 0.825*** | 0.516*** | 0.435*** | 0.667*** | 0.842*** | 0.895*** | 0.710*** | 1 |
Source: Authors own work
Discriminant validity was evaluated by comparing the shared variance between constructs to the average variance extracted (AVEs) of each construct (Fornell and Larcker, 1981). For every factor, the average variance extracted (AVEs), which fell between 0.58 and 0.76, exceeded the observed shared variance (ranging from 0.02 to 0.50) among the constructs, thus confirming discriminant validity.
Nomological Validity Assessment
Once the developed scale was validated using an independent respondent sample, nomological validity was assessed by exploring the relationship between the independent factors and a theoretically associated measure, namely Overall Performance (OP) (Zu et al., 2008). To evaluate nomological validity, correlation estimates for the validation sample (n = 399) were computed, as detailed in Table 4 (Arnold and Reynolds, 2003; Zhang et al., 2014). The scale produced ten constructs by averaging the items associated with each construct throughout the entire measurement tool. Correlation analysis indicated that all nine factors exhibited a positive relationship with Overall Performance (OP), thereby confirming the nomological validity of the constructs.
Discussion and Implications of the Study
This study explored the influence of nine independent variables on Indian e-tailers’ performance in cross-border e-commerce. A 75-item scale was developed to measure performance. The proposed framework for performance assessment was designed and assessed as an eight-factor model that includes organizational and internal factors, financial factors, digital marketing, inventory management, logistics, export compliances, government support, and local and global taxation. The findings indicated that among the nine factors of e-tailers’ performance measurement, all nine were significant, among which government support, export compliance, and financial factors were the key factors. This was followed by local and global taxation, logistics, and organizational and internal factors.
From a psychometric perspective, the scale demonstrates strong internal consistency and maintains reliability across various groups. The scale successfully met all reliability and validity criteria, including construct, convergent, discriminant, nomological, and predictive validity, with all values falling within acceptable ranges. The correlation with overall performance indicates that organizations must effectively adopt all practices to achieve optimal business results. This research adds significant insights to the existing body of knowledge on cross-border e-commerce literature by considering various aspects. This research employed a structured approach to scale development, utilizing distinct samples at each stage to evaluate and verify the proposed model. This provided compelling empirical support for the reliability and strength of the proposed model. The developed scale can serve as a tool for assessing performance levels in cross-border e-commerce in India. To the best of our knowledge, this study is the first to establish a validated instrument designed to evaluate multiple facets of performance. The results of this study hold significant importance for entrepreneurs.
First, e-tailers can confidently use this specialized measurement scale to assess their performance and essential business practices. E-tailers can identify areas for improvement by evaluating their performance scores related to key business practices. Second, this scale will serve as a valuable resource for Indian e-tailers to effectively assess their Overall Performance. This indicates that organizations can analyze the statistical relationship between internal and external factors, essential business practices, and Overall Performance. Third, this scale holds significant strategic value, enabling entrepreneurs to determine the relative impact of all nine performance measurement factors on Overall Performance predictions. Fourth, this tool for measuring performance and quality can assist in identifying both competitive advantages and shortcomings within an organization. This research suggests that export compliance, government schemes, and financial practices are comparatively more critical for enhancing performance than other factors. Consequently, entrepreneurs must cultivate and maintain their organizational resources to ensure the overall efficiency of cross-border e-commerce operations.
Limitation and Directions for Future Research
This study acknowledges several limitations, some of which are intrinsic to the scale development process and warrant further discussion. Initially, this study created a broad-scale framework for Indian entrepreneurs who are engaged in retail exports through e-commerce platforms; however, due to variations in cultural contexts, the findings of this study may not be applicable to other developing nations. Therefore, additional research is needed to confirm the validity of this scale in other developing nations. Second, the instrument has been validated primarily for e-tailers, without concentrating on any particular sector. Future studies should aim to conduct sector-specific research. Third, this scale does not assess the nuances of performance, such as the positive or negative aspects.
Therefore, future research should focus on creating adaptations of scales that incorporate both positive and negative wording. Fourth, this study utilized factor analysis, which inherently involves a degree of subjectivity in the process of identifying and categorizing variables. Moreover, the scale can be applied individually across various categories of Indian e-tailers operating in cross-border e-commerce, particularly those classified as micro, small, and medium-sized. Finally, the research focused exclusively on nine distinct factors for the measurement of Indian e-tailer performance, which may limit the comprehensiveness of the findings. Future research could incorporate additional quality frameworks, such as Lean and Kaizen, along with other previously unexplored factors, into the measurement model to achieve more robust and comprehensive outcomes.
References
Alghamdi R., Nguyen A., Jones V. (2013). A Study of Influential Factors In The Adoption And Diffusion Of B2C E-Commerce. International Journal Of Advanced Computer Science And Applications, Vol. 4, No.1, 2013 P. 89-94.
Indexed at, Google Scholar, Cross Ref
Avery, S. (1997). Online tool removes costs from process. Purchasing,. vol. 123, no. 6, pp. 79-81.
Churchill, G.A. Jr (1979), “A paradigm for developing better measures of marketing constructs”, Journal of Marketing Research, Vol. 16 No. 1, pp. 64-73.
Indexed at, Google Scholar, Cross Ref
Costello, A. and Osborne, J. (2005/2011), “Best practices in exploratory factor analysis: four recommendations for getting the most from your analysis”, Pract Assess Res Eval, Vol. 10 No. 7, available at: pareonline.net/getvn.asp
Edwards N., Handcock S. & Mullen J. (1997). Electronic commerce: reality bytes.. Supply Management,. vol. 3, no. 8, pp. 32-34.
Faherty E., Huang K. And Land R.(2017). The Amazon Monopoly: Is Amazon’S Private Label Business The Tipping Point?Retrieved on April 16, 2019 from https://econpapers.repec.org/paper/pramprapa/83672.htm
Fornell, C. and Larcker, D.F. (1981), “Evaluating structural equation models with unobservable variables and measurement error”, Journal of Marketing Research, Vol. 18 No. 1, pp. 39-50.
Indexed at, Google Scholar, Cross Ref
García F.J., Gil A.B., Moreno M.N., And Hernández J.A.(2001). A B2B/B2C Hybrid E-Commerce Model
Hair, J., Black, W., babin, B.Y.A., Anderson, R. and Tatham, R. (2010), Multivariate Data Analysis.
Israel Glenn D. (1992). Determining sample size. PEOD6, University of Florida. Retrieved October, 5, 2018 from https://www.gjimt.ac.in/wp-content/uploads/2017/10/2_Glenn-D.-Israel_Determining-Sample-Size.pdf
Karatepe, O.M., Yavas, U. and Babakus, E. (2005), “Measuring service quality of banks: scale development and validation”, Journal of Retailing and Consumer Services, 12(5), 373-383.
Indexed at, Google Scholar, Cross Ref
Kawa A., Zdrenka W.(2016). Conception of Integrator In Cross-Border E-Commerce. Logforum Scientific Journal Of Logistics. 12(1), 63-73 .
Indexed at, Google Scholar, Cross Ref
Lamoureux T. (1997). Is goes shopping on the web,.Computerworld,. 31(46),106.
MacCallum, R.C., Roznowski, M. and Necowitz, L.B. (1992), “Model modifications in covariance structure analysis: the problem of capitalization on chance”, Psychological Bulletin, Vol. 111 No. 3, pp. 490-504.
Malhotra, N.K. (2007), Marketing Research: An Applied Orientation, 5/E, Pearson Education India, New Delhi.
Miyazaki A.D. And Fernandez A.(2001). Consumer Perceptions Of Privacy And Security Risks For Online Shopping . The Journal Of Consumer Affairs. Vol. 35, No. I, 2001 p. 27-44.
Indexed at, Google Scholar, Cross Ref
Numberger S. And RennhakC.(2005). The Future Of B2C E-Commerce. Electronic Markets . Vol. 15 No 3 P. 269-282.
Podsakoff, P.M., MacKenzie, S.B., Lee, J.-Y. and Podsakoff, N.P. (2003), “Common method biases in behavioral research: a critical review of the literature and recommended remedies”, Journal of Applied Psychology, Vol. 88 No. 5, pp. 879-903.
Indexed at, Google Scholar, Cross Ref
Tabachnick, B.G. and Linda, S.F. (2012), Using Multivariate Statistics, Pearson Education Limited.
TadelisS.(2016). Reputation and Feedback Systems In Online Platform Markets Retrieved on April 16, 2019 from faculty.haas.berkeley.edu/stadelis/Annual_Review_Tadelis.pdf
Xue W., Li D., Pei Y. (2016). The Development And Current Of Cross-Border Ecommerce
Zaichkowsky, J.L. (1985), “Measuring the involvement construct”, Journal of Consumer Research, Vol. 12 No. 3, pp. 341-352.
Indexed at, Google Scholar, Cross Ref
Received: 16-May-2025, Manuscript No. AMSJ-25-15931; Editor assigned: 17-May-2025, PreQC No. AMSJ-25-15931(PQ); Reviewed: 22-May-2025, QC No. AMSJ-25-15931; Revised: 30-May-2025, Manuscript No. AMSJ-25-15931(R); Published: 06-Jun-2025