Review Article: 2022 Vol: 26 Issue: 5
Does Capital Structure Determinants Matter for Stock Return Performance In India?
Naliniprava Tripathy, Indian Institute of Management Shillong
Citation Information: Tripathy, N. (2022). Does capital structure determinants matter for stock return performance In India. Academy of Marketing Studies Journal, 26(5), 1-12.
Abstract
This study investigates the long run and short-run relationship between capital structure determinants and stock return of manufacturing firms of India Autoregressive Distributed Lag (ARDL) and Generalized Method of Moments (GMM) model. ARDL bound test findings witness a healthy link amid capital structure determinants and stock returns. The GMM model also finds an optimistic relationship amid eps, tangibility, and stock return while adverse relation found among total debt, p/e ratio, and stock return. The result of the study presents that capital structure determinants play a vital role in elucidating stock returns of the firms. The results have substantial inferences at the firm, investors, and policymakers’ levels. Investors must think over the impact of capital structure determinants on stock return before making investment decisions. Corporate managers should minimize the financial leverage to enhance stock return and performance of the company. Precisely, the results of this study add to the knowledge of the influential behavior of Capital structure determinants on the stock return of Indian manufacturing firms of India.
Keywords
Capital Structure Determinants, Stock Return, ARDL Model, GMM Model, CUSUM Tests.
JEL Classifications
G32 C22, C23.
Introduction
Modigliani & Miller (1958) has laid the underpinning of capital structure theory and claimed that capital structure financing choice is inappropriate to both firms’ value and the cost of capital. They argued that debt and equity are seamlessly surrogates for each other, and there is no dissimilarity between unlevered firms and levered firms. These arguments are based on certain assumptions, such as the absence of taxes, bankruptcy costs, transaction costs, and agency costs, no arbitrage opportunities, and the perfect capital market. Since the view of MM Theories is too restrictive, it paved the way for the emergence of several theories to debate the association between capital structure decisions and firm performance. Capital structure theory has extensively debated in economic literature. Capital structure regarded as a critical factor since it relates to the capability of firms to encounter the demands of various stakeholders Jensen (1986). The composition of the capital structure plays a dynamic role in companies’ persistence, performance, and progression. The Agency theory developed by Jensen & Mackling (2019) elucidated that the best combination of debt and equity mix condenses the agency cost since the cash flow of a firm depends on its ownership structure. Hence, the firms always look for optimal debt ratio to counterbalances tax savings benefit contrasting to the cost of probable bankruptcy and agency conflict. The trade-off theory claimed that the link between profitability ratio and leverage ratio is favourable, and higher profit leads to advance the leverage ratio. It advocates that profitability and tax rate related to the preference to incur additional debt. However, the empirical evidence of the trade-off theory provided mixed evidence. Previous scholars Wald (1999); Myers (2001); Fama & French (2002) expounded that tax shield does not mount shareholder value since profitable firm borrows least. This theory fails in some cases, to revitalize why lucrative firms are having a low debt ratio Rajan & Zingales (1995). Bevan & Danbolt (2002) proposed that the trade-off theory has specific weaknesses, and the theory is not appropriate while planning the ideal capital structure. Pecking order theory proposed by Myers & Majluf (1984) advocated that firms desire to use retained earning reasonably than obtaining funds from external financing since internal finance has the least associated with asymmetric information. Information asymmetry related to external financing, and it proposed that firm chooses internal finance to external finance and preference for debt over equity. The converse relationship between leverage and profitability is supported by Ozkan (2001); Kester (1986); Titman & Wessels (1988) in their study. Therefore, in this context, the pecking order theory is more precise to illuminate the relationship of debt ratios and profitability than the trade-off theory. The trade-off theory suggested that firms use less leverage if more investment opportunities available since they have sturdier incentives to evade asset substitution that are aroused from stockholder-bondholder agency conflicts Drobetz & Fix (2003). Hence, this theory indicates an adverse relationship between investment opportunities and leverage. However, pecking order theory supports affirmative relationships indicating that debt increases or decreases with investments surpass/moderates retained earnings. Some earlier studies Titman & Wessles (1988); Barclay & Smith (1996) revealed an unhealthy association between total debt and growth opportunities. The prior empirical studies provide evidence that capital structure influences the firm value, executives' behavior, and future performance of the company Cen et al. (2006).
Although there has been substantial research made on optimal capital structure choice, no such unifying theory adequately explains the right mix of debt and equity to minimize the cost of capital and maximizes the profitability of firms and market value. There is a lack of unanimity among researchers about optimal capital structure. It is one of the most challenging subjects in corporate finance until date, and research is still going on. However, several theories explain the capital structure choice, which is conditional pertinent.
Several theories indicated that a healthy relationship that exists between return on equity, return on asset, and earning per share in terms of firm performance. Still, there is no such consensus that arrived on the date and made capital structure decisions critical. Therefore, capital structure decisions are very crucial about the performance of a firm in terms of profitability and value of the equity. Welch (2004) demonstrated that stock returns govern the capital structure, while others argued that capital structure defines stock returns. Sinan (2010) revealed that the market to book ratio is adversely interrelated with the leverage ratio, while Lemmon & Zender (2010) found an optimistic association between the leverage ratio and market to book ratio. Ahmad et al. (2012) debated that capital structure, stock returns, and their determinants have congregated substantial responsiveness among financial researchers.
Yang et al. (2010) expressed that capital structure and stock returns move each other concurrently. The choice of optimal capital structure is significant for the economic performance of every firm since it influences the value of investments made by several equity investors. Investors have a higher expectation of returns on their investments. Any magnitude conflicting to their expectation will have an adverse effect on their shareholding, which can lead to reducing the stock price of the company. The falling of stock price indicates the poor performance of the company, which ultimately deprives the potential investors of investing both in equity and in debt. Some reviews have documented that the capital structure of a firm expressively influences its stock price, but the results are not reliable, and it diverges from industry to industry and economy to economy. The mix evidence opens the subject for further research. Therefore, it is imperious to study the influence of capital structure determinants on stock return performance. Precisely, the results of this study add to the knowledge of the influential behaviour of capital structure determinants on the stock return of Indian manufacturing firms in India. Hence, in this paper, the researcher intends to undertake further research using robust empirical tests to estimate the link between capital structure determinants and profitability, which may help the firm to make sound financial decisions. The primary motivation is to shed light on the firm characteristics behaviour and stock return performance to help the firm in designing a sound capital structure to maximize the value for the firm. In this direction, the paper is pursed to fill the research gap. The present study raised three-research question. The present study seeks to discover the long run or short run relationship exists between capital structure determinants such as EPS, PE, Tangibility and total debt and stock performance using the Autoregressive Distributed Lag (ARDL) model. Secondly, the study employed the Generalized Method of Moments (GMM) to validate their relationship. Thirdly, the CUSUM test used to assess the long-run stability relationship amongst them. The present study adding value to the existing studies and augments new insights on the long run and short-term behavioral relation between stock performance and capital structure variables of manufacturing firms. The present study uniquely contributes to the existing literature to increase the financial performance of the company, which leads to an increase in shareholder value.
The layout of the paper is as follows: section two deals with the literature review; section three discusses the data source and methodology; section four analyses the empirical findings; section five offers concluding observations.
Literature Review
Over the three decades, numerous researchers present the significance of capital structure models on firm performance. Fama & French (2002) discovered that market leverage is positively related and book leverage negatively related to returns. Hence, they deliberated that two measures’ differences book-to-market equity, help to elucidate average returns. Rajan & Zingales (1995) exhibited a disagreeable association between profitability and leverage ratio. Hovakimian et al. (2001) showed that the debt ratio of a company changes with stock prices and profitability deviances. Baker & Wurgler (2002) instituted that the capital structure of firms linked to past market values of companies. Welch (2004) stated that the lower debt ratio arises in the firms due to higher stock market returns of a firm. It advocated that higher stock return lead to higher equity return, and consequently, debt financing decreasing. The abnormal effects of equity and debt on stock market performance analyzed by Mayer & Sussman (2004). The study specified that the information asymmetries change the structure of the capital structure. Ling, John Wei, and Zang (2007) deliberated the dynamics of capital structure and stock returns. The study indicated that higher positive future returns linked to high earning per share of stocks. de Jong et al. (2008) examined the firm-specific and country-specific influence issues on the capital structure choice of firms and indicated that the capital structure choice of most countries is designed with firm-specific factors. The study concluded that creditor protection, bond market development, and GDP growth are influencing to the capital structure decision of firms. Ebaid (2009) observed the Egyptian stock exchange listed company’s performance and the debt level using three accounting performance measure such as return on assets, return on equity, and gross profit margin. The study found that there is a substantial adverse impact of debt on the financial performance of the company. The study also exhibited that there is no considerable impact of debt on gross profit margin and returned on equity of companies. Michael et al. (2010) explored the influence of stock returns on capital structure dynamics on the Hong Kong stock market. The study indicated the insignificant relationship between leverage ratio and abnormal returns. Kaumbuthu (2011) deliberated the link between capital structures and returned on equity for industrial and allied sectors of the Nairobi Securities Exchange. The study specified the negative correlation exists between the debt-equity ratio and ROE. Javed & Akhtar (2012) observed the capital structure and financial performance link of Pakistan companies. The study found a favourable correlation amid financial leverage, financial performance, growth, and size of the companies. Mumtaz et al. (2013) studied the performance of 83 companies of KSE 100 index. The study indicated that the choice of capital structure intrudes the financial performance of firms. The study resolved that the capital structure of firms adversely linked to its market value of stocks. Chemutai et al. (2016) examined the influence of capital structure of firms of Nairobi on the share price performance. The study observed that all the variable such as debt, equity, bond, and retained earnings are having a substantial impact on share price performance. Kannadhasan et al. (2018) explored the capital structure choice made by Chinese, Indian, and South African firms. The outcomes of the study indicate that firms regulate to target leverage very quickly. The study established that the choice of capital structure is better explicated by trade-off theory than pecking order theory. Alabdullah (2018) examined the link between ownership structure and firm performance of Jordan represented by market share. The outcomes of the study indicated that managerial ownership has an optimistic impact on performance. However, no supportive evidence found about impact of foreign ownership on the performance of firms. Firm size and industry type do not have an influence on market shares. Their study supports to agency theory.
Data and Methodology
The study has used panel data from January 2009 to April 2018. The dataset consists of 143 manufacturing companies collected from CMIE-Prowess database and www.bse.com. Before analysis, all the variables are transformed to natural logarithms. The study has used the Jarque-Bera test to measure departure from normality based on the kurtosis and skewness.
Before modeling any relationship, stationarity must be tested. To check the prevalence of panel unit-roots, Im, Pesaran et al. (2003) and Fisher-type tests using ADF and PP tests are employed in the study. The following process is taken for general panel unit root as:
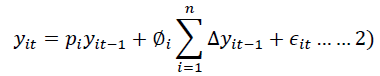
Where n denotes series detected over period’s t=1.2…..t, i=1,2…….p_i signifies autoregressive co-efficient, ϵ_it suggests mutually independent idiosyncratic disturbance. If |p_i |< 1,y_i is said to stationery if |p_i |=1 then y_i contains unit root. The correlations between the explanatory variables are observed to check the multicollinearity in the variables.
The following determinants have been used in the study such as:
Total debt: Debt is commonly used in the capital structure. It indicates that the entire debt finances are made from the total asset of the firms. The total debt ratio calculated as total debt/total assets.
Tangibility: Tangible assets are used as collateral for debt to provide a positive signal to the creditors about the maturity of firms. Firms have a high liquidation value if holding more tangible assets that are significant. Hence, a positive correlation is expected. The fixed assets to total assets ratio are tangibility.
Earnings per share: EPS is a financial measure specifying the profitability of a company. It indicates that how much profit a share generates with capital invested by shareholders. Usually higher earnings per share of a company lead to the better of its cost-effectiveness. EPS are calculated as follows: net earnings/number of shares.
Price Earnings Ratio: PE ratio is the most extensively used tools for stock selection and specifies what the market willing to pay for a company’s earning. It measures the market price share to earnings per share.
Stock Return: Stock market return means, an investor earns a return by purchasing a stock at a low price and selling stock at a higher price. Stock return is calculated by taking a natural log of returns.
Research Hypothesis
To investigate the long and short-run association amid EPS, PE Ratio, Tangibility, Total Debt, and Stock Return performance, the following hypothesis developed:
H0: Capital structure determinants have a significant long run and short-run impact on the stock return
performance.
H1: Capital structure determinants have no significant long run and short-run impact on the stock return performance.
Autoregressive Distributed Lag (ARDL) Models
Autoregressive Distributed Lag (ARDL) method known as bounds testing approach developed by Pesaran et al. (2001) examining the long run and short run integrating relations amid variables. The ARDL model does not restrict that the variables in the cointegrating relationship can be either I(0) or I(1). This model is better than conservative co-integration approaches since it is very robust and perform better for small size samples. The ARDL model avoids the possible bias related to unit roots and cointegration tests. The long-run relationship between the stock return and capital structure determinants is estimated using the model as follows:
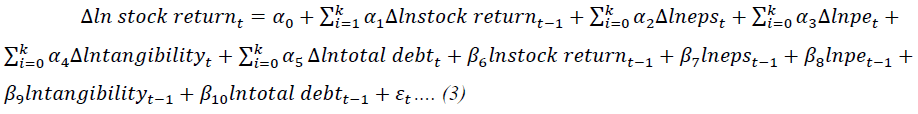
Where Δ is the differencing parameter, ln indicates natural logarithms, k indicates lag length,  is the constant parameter,
 is the error term, t is the time trend. The parameters
 are short run coefficients and
 are long run coefficients.
The standard F test is used to examine hypothesis. To gauge the long run relationship amid variables, F test piloted to estimate the joint significance of the long run coefficients. The null hypothesis of absence of long run relation  and alternative hypothesis specifies existence of long run relationship
According to pearson (2001), it assumes that all variables are I(0) or I(I). The F-statistics compared with two sets of critical (5%and 10%) values split into lower critical bounds (I(0)) and upper critical value bounds (I(1)) If F statistics is higher than the upper bound critical value, then the null hypothesis of no cointegration rejected. If F statistics is lower than the upper bound critical value, then the null hypothesis is accepted. The results become indecisive if computed F-statistics is falls within lower and upper bound critical values.
Generalized Method of Moments (GMM) Model
The study has employed the GMM model. Arellano & Bond (1991) proposed the GMM model, which uses the lagged instruments of the endogenous variables for each period to address the endogeneity of the explanatory variables in the panel. To reduce and ease the endogeneity problem, unobservable shocks in the cross-sectional component is used by GMM. To check the strength of the selected instruments used in the GMM model, two specification tests are employed. The first specification Sargan test or Hansen J-statistic applied to check the validity of the over identifying restrictions in case of the GMM system estimator. The rejection of the null hypothesis indicates the estimator is not robust. To check the error term is not serially correlated, the study employs AR (1) and AR (2) tests through Arellano & Bond (1991) test. The null hypothesis is that there is an absence of autocorrelation against the alternative hypothesis is the presence of autocorrelation. Failure to reject the null hypothesis offers support to the model Ng & Wang (2010).
Empirical Analysis
Table 1 describes the mean, standard deviation, skewness and kurtosis of all the variables.
| Table 1 Descriptive Statistics | |||||
| Variable | Stock Return | EPS | PE | Tangibility | Total debt |
| Mean | 12.65272 | 10.00010 | 4.397447 | 26.93516 | 35.98107 |
| Std. Dev | 68.07636 | 28.55732 | 52.8017 | 18.44552 | 23.98345 |
| Skewness | -0.353502 | -2.543124 | -18.41580 | -1.061694 | -0.002923 |
| Kurtosis | 4.195283 | 42.33924 | 399.4556 | 4.156412 | 2.002294 |
| Jarque-Bera | 79.31188 | 64707.95 | 6519695 | 240.4195 | 40.93798 |
| Probability | 0.000492 | 0.000000 | 0.000000 | 0.000000 | 0.000000 |
The average debt component of the capital structure is 35.98% of the firm’s asset, indicating that firms’ assets are financed with debt during the study period. The company depends on debt capital along with equity capital. The standard deviation ranges from 18.45 % to 52.8 %. The stock return volatility is very high, i.e., 68.07%. The value of skewness is zero and kurtosis >3. All variables negatively skewed leptokurtic, indicating that the variable is not normally distributed. The Jarque-Bera statistic is much higher than the critical value and rejecting the null hypothesis of normally distributed returns. All the sample variables confirm thick tails and the non-Gaussian distribution Bhandari (1988) Table 2.
| Table 2 Correlation Matrix | ||||||
| Stock Return | EPS | PE | Tangibility | Total Debt | VIF | |
| Stock Return | 1.00 | - | - | - | ||
| EPS | 0.069158 | 1.00 | 1.047762 | |||
| PE | 0.003661 | 0.080374 | 1.00 | 1.008925 | ||
| Tangibility | 0.046445 | -0.134807 | 0.009037 | 1.00 | 1.028759 | |
| Total Debt | -0.066524 | -0.163144 | -0.054934 | 0.116648 | 1.00 | 1.039142 |
Table 2 summarizes the relationship between all the variables. Table 2 observes the negative link between debt components and stock returns consistent with the trade-off theory. Firms are balancing their leverage position by issuing more equity and less debt to decrease the risk of financial distress. It also observes that the debt component positively correlates with tangibility, indicating a positive impact of information asymmetric on the firms’ value. The positive relation also suggests an optimistic signal to the banks/financial institutions about distress costs under control. Further, there is an adverse correlation found between debt component and eps. The reason is that profitable companies tend to finance their proposition with retained earnings rather than debt financing. (Pecking order theory). Hence, the firms’ are not able to exploit the available tax shields that led to reducing the eps of the company. The relationship between the debt component and the price-earnings ratio is negative. It indicates that the firm raises high debt minimize the cost of capital, reduce the net income but increase the earnings per share, and increase the p/e ratio and vice versa. The market value of debt augments the overall valuation of stock, assuming distress costs under control. It indicates that more distinguished profitability firms have less insolvency risk and creditors incline for funding such firms. Profitability firms increase the image of firms, investors’ confidence, and share price performance Im et al. (2003).
The study has conducted the VIF test to investigate the existence of multi collinearity amid variables. Nachane (2006) proposed that VIF<10.0 is acceptable. However, none of the explanatory variables correlates that more than ten suggesting the variables are free from multi collinearity problem and the explanatory variables move forward for panel data analysis Table 3.
| Table 3 Panel Unit Root Test | ||
| Statistics | Prob. | |
| Im, Pesaran and Shin W-stat | -19.8504 | 0.0000 |
| ADF - Fisher Chi-square | 371.820 | 0.0000 |
| PP - Fisher Chi-square | 566.724 | 0.0000 |
| Breusch-Pagan-Godfrey | 4.064026 | 0.0000 |
The stationarity of all variables tested using the Im, Pesaran and Shin, ADF-Fisher χ2, and PP–Fisher χ2 tests. The results of the panel unit root test indicate that the first difference of all the sample variables considered in the study are stationery. So the null hypothesis rejected and supported the argument that variables under analysis are all I (1) variables. The Breusch-Pagan Test indicates that the error variance are varying with a set of regressors. Since the null hypothesis rejected since chi-square value is statistically significant at 1% level. It shows the existence of heteroscedasticity Kannadhasan (2018).
Autoregressive Distributed Lag (ARDL) model are assessed to check the existence of a long-run association between capital structure determinants and stock return Table 4.
| Table 4 Bounds Test for Co Integration (Dependent Variable ∆ LN Stock Price) | ||||
| K | F-Statistic | Level of significance | I (0)–Lower Bound | I (1)–Upper Bound |
| 4 | 1% | 3.29 | 4.37 | |
| 88.30407 | 5% | 2.56 | 3.49 | |
| 10% | 2.2 | 3.09 | ||
Table 4 displays that F-statistics value is 88.30407. It is significant at 1 % level of significance and rejected the null hypothesis since F-statistics value is higher than upper bound value. It indicates the presence of long-run association among variables. Therefore, the stock return is integrated with eps, p/e ratio, tangibility, and total debt of the firms, suggesting that if the capital structure determinants upsurges, it leads to stock return growth Jahanzeb et al. (2015) Table 5.
| Table 5 Long-Run Coefficients Model | |||
| ARDL(4,1,4,3,2) selected based on Akaike Info Criterion (AIC) Criterion Stock return is Dependent Variable |
|||
| Variable | Coefficient | t-Statistic | Prob |
| EPS | 0.203334 | 3.943631 | 0.0001* |
| PE Ratio | -0.011630 | -2.699511 | 0.0071* |
| Tangibility | 0.336512 | 4.002057 | 0.0001* |
| Total Debt | -0.233034 | -3.581205 | 0.0004* |
| C | 9.939710 | 2.897233 | 0.0038** |
The estimated long-run coefficients are exhibited in Table-5. It observes that eps and tangibility are positively influencing the stock return and statistically significant at 1 %level while p/e ratio and total debt statistically negatively distressing stock return. The estimated coefficients exhibit that 1 % surge in eps causes an increase of 20.33 % stock return of the company. The reason is that since firms’ beat the projected earnings, increasing the stock price and stock return. The result shows that 1% increase in tangibility leads to boost stock return by 33.65 % specifying that the rise in tangibility send a good signal to investors. On the other hand, 1% rise in p/e ratio leads to decrease stock return by 1.16%. The reason is that due to mispricing view on stocks, which have a low p/e ratio, earn significantly better returns. Therefore, it signposts that there is an inverse relationship exists amid stock return and p/e ratio. Stock with low or negative p/e ratio shows stock is undervalued. The results also indicate that 1% increase in debt reduces stock return by 23.3 % specifying that the rise in debt deepen the risk of firms earning that leads to lower the stock price and decrease the stock returns MILLER (1958). In addition to it, another reasonable explanation for this phenomenon could be, with an increase in debt in Indian manufacturing companies, investors’ concern for distress cost increases, consequently lesser demand and hence lower returns Choi (2001) Table 6.
| Table 6 The Short Run Impact of Capital Structure Determinants on Stock Returns | |||
| ARDL (4, 1, 4, 3, 2) selected based on Akaike info criterion (AIC) Stock return is Dependent Variable | |||
| Variable | Coefficient | t-Statistic | Prob. |
| D(Stock market return) | 0.425019 | 7.529328 | 0.0000* |
| D(EPS) | 0.073015 | 0.771668 | 0.4405 |
| D(PE Ratio) | -0.002573 | -0.564302 | 0.5727 |
| D(Tangibility) | 0.247489 | 1.391837 | 0.1643 |
| D(Total Debt) | -0.057983 | -0.487793 | 0.6258 |
| CointEq(-1) | -1.571863 | -23.077531 | 0.0000* |
| Diagnostic Tests R-squared 0.127701 Adjusted R-squared 0.111413 Akaike info criterion ( AIC) 11.18281 Schwarz info criterion (SIC) 11.27734 Hannan-Quinn criter. 11.21877 Durbin-Watson stat 1.976249 Ramsey RESET Test 5.430882(0.0200**) Heteroskedasticity Test 4.064026(0000*) |
|||
The Table-6 displays the insignificant positive relationship among stock return, eps, and tangibility in the short run. The p/e ratio and total debt are having an adverse influence on stock return in the short run as well. The coefficient of eps shows positive sign and indicating that 1% rise in eps leads to rising 7.3% stock return. Similarly, 1% increase in tangibility increasing the stock return growth by 24.74%. Both eps and tangibility are having a positive and substantial impact on the stock return. It is consistent with expectations that increased earning in outstanding share; an investor ought to get a positive signal and increasing the demand of the stock.
Consequently, there is an increase in stock price and provides a better stock return. The reason is that firms raising outer debt using assets of the firms for finance their investment. More debt leads to leverage tax benefits and increases earnings per share, growing the share price of firms and stock returns. However, both p/e ratio and total debt negatively influencing stock return in the short run Akdal (2011).
Error correction statistically significant at 1% level signifying unidirectional causal relation running from capital structure determinants to stock return. Hence, it suggested that capital structure determinants lead to stock return growth Table 7.
| Table 7 Effect of Capital Structure Determinants on Stock Return Performance Using GMM Model | |||
| Coefficient | t-Statistic | Prob | |
| EPS | 0.241369 | 2.567063 | 0.0104* |
| PE | -0.004000 | -1.343147 | 0.1795 |
| Tangibility | 0.147146 | 1.169029 | 0.2427 |
| Total Debt | -0.186933 | -1.779230 | 0.0755** |
| C | 13.66325 | 2.626940 | 0.0088* |
| R-squared 0.022383 Durbin-Watson stat 1.984316 AR(1) test 0.0000 AR(2) test 0.1592 Wald Test 6.442436( 0.0017*) Sargan test 5.521110( 0.237880) |
|||
The Table-7 displays that eps and stock return are positively related indicating that rising eps not only advance the company’s performance but also augment the stock return growth. It specifies that if a company releases the blooming earnings report, investors’ feel very optimist about the company, which led to increasing the stock price. On the other hand, if the company tinkles negative earnings leading to decrease the stock price. Tangibility is also positively influencing the stock return. The results demonstrate that firm can borrow on a long-term basis by pledging their tangible assets facilitated to the firm to leverage tax benefits factor paying higher earnings per share to the investors in their stock holding that support to surge the stock price. PE ratio provides better insight about stock's growth potential such as whether overvalued or undervalued. If the stock is overvalued, it leads to reduce the stock price vice versa. However, it may be attributed to the factor that p/e ratio is related to the sector classification of firms since investors prepared to pay more for the future growth potential of firms. Total debt is negatively related to stock price. The Wald test suggests that the determinants employed in the study are considered as a whole, explanatory of stock return. The Durbin Watson test of 1.984316 falls between satisfactory range and are close to 2 indicating the nonexistence of an autocorrelation problem in the model. The Sargan test p-value is 0.237880. The results observed that neither the Sargan test nor the AR-2 test statistics indicate the existence of serially correlated errors in the variables.
Conclusion
This study has explored the long run and short-run relationship amid capital structure determinants and stock returns of manufacturing companies in India using the ARDL model. The study also uses GMM model to ascertain the relation amongst them. The stability of the relationship between stock return and capital structure determinants are tested through CUSUM tests. ARDL bound test findings witness a healthy relationship amongst capital structure determinants and stock returns. The study finds a positive correlation among eps, tangibility, and stock return. The study does not see any significant correlation between p/e ratio and stock return. The GMM model also finds a positive relationship amid eps, tangibility, and stock return while adverse relation found among total debt, p/e ratio, and stock return. It also discovers that coefficient of debt components is statistically significant but adversely linked to stock return. The study postulates that the debt component in capital structure does play a paramount role. Therefore, it is not surprising that manufacturing companies are raising more debt capital along with equity capital. The study suggests that in the backdrop of this paradigm shift in the source of funding requirement of Indian companies, has a significant adverse influence on stock returns. Investors’ concern for distress cost increased with increasing debt. Increase in debt upsurges the risk of the firm’s earnings and reduce the stock price that leads to decrease the stock return performances. EPS has a significant positive influence on stock return implying that firms prefer to use debt financing to leverage tax benefits and improves profitability, which ultimately increases the eps. The study also found the negative impetus of p/e ratio on stock returns. It suggests that firms’ capital structure policy governs its stock return. The result of the study presents that capital structure determinant plays a vital role in explaining stock returns. The CUSUM test findings confirm the long-run stability relation amongst stock return, eps, p/e ratio, tangibility, and total debt indicating good corporate governance is imperious to safeguard the concern of stakeholders of firms.
This study has a significant contribution to the academicians, policymakers, investors, and firms at large. The result of the study provides valuable insights to the investors to understand the price-earnings anomaly influencing on the market price of the share. Investors must think over the impact of capital structure determinants on stock return before making investment decisions. The study is vital for firms to assess their decisions suitably to maximize shareholders return, understanding the dynamic effect of the p/e ratio on stock returns and investors’ choice. Since the capital structure decision is vivacious for firms, corporate managers should take apposite judgment considering firms’ level of earnings and risk attached to it for its asset valuation. The study provides information to the corporate managers to minimize financial leverage to enhance the stock price and performance of the firm. The study offers a piece of valuable information to regulators to take appropriate steps for the nourishment of policies to encourage the growth of manufacturing firms. This study also specifies that the government is required for regulating the monetary policies to reduce the cost of borrowing for manufacturing companies to finance their funding requirements. The study also provides opportunities to the academicians for understanding the behavior of capital structure determinants, which contribute to the body of knowledge and undertaking further research. However, future research can be conducted by including asset structure, business risk, and earnings volatility determinants, which may provide additional insights.
References
Ahmad, Z., Abdullah, N. M. H., & Roslan, S. (2012). Capital structure effect on firms performance: Focusing on consumers and industrials sectors on Malaysian firms. International review of business research papers, 8(5), 137-155.
Akdal, S. (2011). How do firm characteristics affect capital structure? Some UK evidence. Some UK Evidence (March 3, 2011).
Alabdullah, T. T. Y. (2018). The relationship between ownership structure and firm financial performance: Evidence from Jordan. Benchmarking: An International Journal.
Indexed at, Google Scholar, Cross ref
Arellano, M., & Bond, S. (1991). Some tests of specification for panel data: Monte Carlo evidence and an application to employment equations. The review of economic studies, 58(2), 277-297.
Indexed at, Google Scholar, Cross ref
Baker, M., & Wurgler, J. (2002). Market timing and capital structure. The journal of finance, 57(1), 1-32.
Indexed at, Google Scholar, Cross ref
Barclay, M. J., & Smith Jr, C. W. (1996). On financial architecture: leverage, maturity, and priority. Journal of applied corporate finance, 8(4), 4-17.
Indexed at, Google Scholar, Cross ref
Bevan, A. A., & Danbolt, J. (2002). Capital structure and its determinants in the UK-a decompositional analysis. Applied financial economics, 12(3), 159-170.
Indexed at, Google Scholar, Cross ref
Bhandari, L. C. (1988). Debt/equity ratio and expected common stock returns: Empirical evidence. The journal of finance, 43(2), 507-528.
Indexed at, Google Scholar, Cross ref
Cen, L., Wei, J., & Zhang, J. (2006). Forecasted earnings per share and the cross section of expected stock returns. Working Paper, Hong Kong University of Science & Technology.
Chemutai, J., Ayuma, C., & Kibet, Y. (2016). Effects of Capital Structure on Share Price Performance of Commercial Banks Listed in Nairobi Security Exchange, Eldoret, Kenya. IOSR Journal of Business and Management, 18(9), 122-133.
Choi, I. (2001). Unit root tests for panel data. Journal of international money and Finance, 20(2), 249-272.
Indexed at, Google Scholar, Cross ref
De Jong, A., Kabir, R., & Nguyen, T. T. (2008). Capital structure around the world: The roles of firm-and country-specific determinants. Journal of banking & Finance, 32(9), 1954-1969.
Indexed at, Google Scholar, Cross ref
Drobetz, W., & Fix, R. (2003). What are the determinants of the capital structure? Some evidence for Switzerland. University of Basel. WWZ/Department of Finance, Working Paper, 4(03), 51-75.
Ebaid, I. E. S. (2009). The impact of capital‐structure choice on firm performance: empirical evidence from Egypt. The journal of risk Finance.
Indexed at, Google Scholar, Cross ref
Fama, E. F., & French, K. R. (2002). Testing trade-off and pecking order predictions about dividends and debt. The review of financial studies, 15(1), 1-33.
Indexed at, Google Scholar, Cross ref
Hovakimian, A., Opler, T., & Titman, S. (2001). The debt-equity choice. Journal of Financial and Quantitative analysis, 36(1), 1-24.
Im, K. S., Pesaran, M. H., & Shin, Y. (2003). Testing for unit roots in heterogeneous panels. Journal of econometrics, 115(1), 53-74.
Indexed at, Google Scholar, Cross ref
Jahanzeb, A., Bajuri, N. H., & Ghori, A. (2015). Market power versus capital structure determinants: Do they impact leverage?. Cogent Economics & Finance, 3(1), 1017948.
Indexed at, Google Scholar, Cross ref
Javed, B., & Akhtar, S. (2012). Interrelationships between capital structure and financial performance, firm size and growth: comparison of industrial sector in KSE. European Journal of Business and Management, 4.
Jensen, M.C. (1986). Agency costs of free cash flow, corporate finance, and takeovers. The American economic review, 76(2), 323-329.
Jensen, M. C., & Meckling, W. H. (2019). Theory of the firm: Managerial behavior, agency costs and ownership structure. In Corporate Governance (pp. 77-132). Gower.
Kannadhasan, M., Thakur, B. P. S., Gupta, C. P., & Charan, P. (2018). Testing capital structure theories using error correction models: Evidence from China, India, and South Africa. Cogent Economics & Finance, 6(1), 1443369.
Indexed at, Google Scholar, Cross ref
Kaumbuthu, A.J. (2011). The relationship between capital structure and financial Performance: a study of firms listed under industrial and allied sector at the NSE, Retrieved
Kester, W. C. (1986). Capital and ownership structure: A comparison of United States and Japanese manufacturing corporations. Financial management, 5-16.
Lemmon, M. L., & Zender, J. F. (2010). Debt capacity and tests of capital structure theories. Journal of Financial and Quantitative Analysis, 45(5), 1161-1187.
Indexed at, Google Scholar, Cross ref
Mayer, C., & Sussman, O. (2004). A new test of capital structure. Available at SSRN 643388.
Miller, M.O.D.I.G.L.I.A.N.I. (1958). The Cost of Capital, Corporate Finance and the Theory of Investment. The American Economic Review.
Mumtaz, R., Rauf, S. A., Ahmed, B., & Noreen, U. (2013). Capital structure and financial performance: Evidence from Pakistan (Kse 100 Index). Journal of basic and applied scientific research, 3(4), 113-119.
Myers, S. C. (2001). Capital structure. Journal of Economic perspectives, 15(2), 81-102.
Myers, S. C., & Majluf, N. S. (1984). Corporate financing and investment decisions when firms have information that investors do not have. Journal of financial economics, 13(2), 187-221.
Indexed at, Google Scholar, Cross ref
Ng, M. M. K., & Wang, K. (2010). predictability Of Hong Kong Stock Returns By Using Gearing Ratio(Doctoral dissertation, Beedie School of Business-Segal Graduate School).
Ozkan, A. (2001). Determinants of capital structure and adjustment to long run target: evidence from UK company panel data. Journal of business finance & accounting, 28(1‐2), 175-198.
Indexed at, Google Scholar, Cross ref
Pesaran, M. H., Shin, Y., & Smith, R. J. (2001). Bounds testing approaches to the analysis of level relationships. Journal of applied econometrics, 16(3), 289-326.
Rajan, R. G., & Zingales, L. (1995). What do we know about capital structure? Some evidence from international data. The journal of Finance, 50(5), 1421-1460.
Indexed at, Google Scholar, Cross ref
Titman, S., & Wessels, R. (1988). The determinants of capital structure choice. The Journal of finance, 43(1), 1-19.
Indexed at, Google Scholar, Cross ref
Welch, I. (2004). Capital structure and stock returns. Journal of political economy, 112(1), 106-131.
Yang, C.C., Lee, C. F., Gu, Y.X., & Lee, Y.W. (2010). Co-determination of capital structure and stock returns-A LISREL approach: An empirical test of Taiwan stock markets. The quarterly review of economics and finance, 50(2), 222-233.
Indexed at, Google Scholar, Cross ref
Received: 04-Jun-2022, Manuscript No. AMSJ-22-12195; Editor assigned: 08-Jun-2022, PreQC No. AMSJ-22-12195(PQ); Reviewed: 20-Jun-2022, QC No. AMSJ-22-12195; Revised: 20-Jul-2022, Manuscript No. AMSJ-22-12195(R); Published: 27-Jul-2022