Research Article: 2021 Vol: 22 Issue: 4
Does Technical Efficiency in Secondary Education Vary Significantly Across the Majority of EU Countries? The Case of Greece
Stylianos Gr. Margaritis, University of Thessaly
Ifigeneia-Dimitra Ath. Pougkakioti, University of Thessaly
Abstract
This article continues the work of previous studies, exploring the efficiency of secondary education by applying a non-parametric methodology. The article review previous studies as well as some conceptual and methodological issues of a non-parametric approach. Most importantly, the Data Envelopment Analysis (DEA) technique is introduced and then applied to a range of EU countries, including Greece, to assess the technical efficiency of secondary education. Empirical results show that technical efficiency in secondary education varies considerably in the vast majority of EU countries. Greece shows a high level of technical efficiency in secondary education, ranking it in the second quartile among EU countries. Therefore, for a better picture, it is recommended that public expenditure on secondary education be streamlined with a possible redirection of certain excessive resources in the field of higher education.
Keywords
Efficiency, Data Envelopment Analysis, Secondary Education, Economics.
JEL Classifications
I21
Introduction
In this period of economic crisis in Europe, efficiency in the school system is subject to much attention and weighs heavily on the resources of the country. Even today the schools differ dramatically in quality Hanushek (1986).
Efficient and high-quality education is the basis of the intervention strategy for the strengthening of human resources. Only a good school system can affect students' cognitive skills, can contribute to increasing productivity, social mobility and the full enjoyment of civil rights in society. Hence the growing interest in measuring the level of efficiency of student learning acquired skills and their ability to use in everyday life and at work Hanushek and Woessmann (2010).
Education is one of the most important parts of government spending in most developed economies (European Commission, 2017). Indeed, the public sector finances and manages the Greek education system, and this is also true in most European and emerging market economies (Bank of Greece, 2019).
From 2009-2018, the proportion of GDP spent on education in the EU-28 averaged 5%. This average however hid disparities between many EU countries. Also during this period there have been significant changes in educational funding. In Croatia the proportion of GDP allocated to education increased by more than 47% between 2009 and 2018, by 3% in Sweden and by 2% in Belgium during the same period. In contrast, in the rest of the EU, the share of GDP spent on education fell from 2% (Germany) to 36% (Lithuania) during this period. Whereas, in Greece the percentage of GDP allocated to education decreased by 2.5% between 2009 and 2018. The same picture in the overall data for the period 2009-2018 also covers expenditure disparities at different levels of education. Expenditure decreased by about 6% for pre-school and by about 12% for higher education as a percentage of GDP during the period 2009-2018. In contrast, expenditure on secondary education decreased by 15% (Eurostat, 2018). However, due to the relatively high amount and importance of this type of government expenditure, measuring its efficiency should be high on each government's policy agenda (European Commission, 2020).
Many empirical studies on public sector performance and efficiency (at national level) that have applied non-parametric methods (DEA) find a significant efficiency gap between countries. These studies mainly concern with Gupta and Verhoeven (2001) on education and health in Africa, Clements (2002) on education in Europe, St. Aubyn (2003) on training costs in the OECD, Afonso et al. (2005, 2006) on public sector performance expenditure in the OECD, Afonso and St. Aubyn (2005, 2006 a,b) on health and education efficiency in OECD countries. Gunnarsson and Mattina (2007) evaluated the efficiency of public expenditure by comparing spending on health, education and social protection in Slovenia. In addition, Afonso et al. (2008) assessed the efficiency of public spending on income redistribution. Then, Mandl et al. (2008); Jafarov and Gunnarsson (2008) continued the work of Afonso et al. (2005). In addition, Grosskopf and Moutray (2001), Johnes (2006), Castano and Cabanda (2007), Jafarov and Gunnarsson (2008), Cherchye et al. (2010), Obadić and Aristovnik (2011), K. Chen and Chen (2011), Thieme et al. (2012), Aristovnik (2012 a,b) and Gavurova et al. (2017) have focused on measuring efficiency or quality in education, As cross-country analyzes, especially in the field of secondary education, are rarely used for policy analysis, we will apply the DEA approach to EU countries, with particular emphasis on Greece in the rest of the article. DEA is chosen here because it is the most common method for measuring technical efficiency, as it can be applied to multiple inputs and multiple outputs. The analysis includes 28 EU countries, for the period 2009- 2018.
Inputs
In the EU, the average annual cost of secondary education (ISCED 2 to 4) is higher (1.8%) than that of primary school students (ISCED 1). The average cost in higher education in the EU was almost half of that of primary school students (0.7%). Differences between countries tend to widen with the relative educational level. The cost of primary education in public sector institutions range from 0.7% in Bulgaria and Romania to 4.4% in Sweden, while the cost in public sector higher education institutions range from 0.5% in Ireland and Luxembourg to 1.7% in Finland. . The average annual cost of secondary education (ISCED 2 to 4) in Greece in 2018 is (1.2%) which is less than 1/3 of the average annual cost in the EU (Graph 1).

Figure 1 Total General government expenditure on Education, 2018 (% Of GDP)
In European countries, the employment status of fully trained teachers for primary, lower secondary and upper secondary education in the public sector falls into two main categories.
In more than half of the countries surveyed, teachers are usually employed on permanent contracts subject to general legislation. As public sector employees, teachers are employed at local or school level, although they are usually employed directly by the school where they teach. Teachers who are civil servants are employed by public authorities at central, regional or local level. Teachers working in public schools in Greece are civil servants according to the respective laws of the civil servants of the countries, but sign an employment contract with the head teacher since they are public schools are established as separate legal entities (Eurostat, 2018).
Outputs and Outcomes
In 2009, across Europe, the average teacher-student ratio in high schools was 1:12. Since 2000, the teacher-student ratio has fallen to two-thirds of countries with an average of two students per teacher in primary education and one student in secondary education. In lower secondary education, the largest increase (9.4) is found in Finland, Slovenia (5.2) and Sweden (4.9). In contrast, there was a decrease in Cyprus (-2) and Malta (-1.3). In Greece, the increase was on average 1.4 students per teacher, during the period 2009-2018 (The World Bank).
After studying the PISA results, Greek students compared to students from some countries with some useful features: France, whose education system is similar to ours, Portugal, which is a country and an economy of similar size with ours and small Estonia, which is the EU country that performs best of all, we note that the students of Greece lag behind the students in these countries in the 2018 research, in all three subjects (OECD, 2018).
Behind this, the results published by the OECD, is a wealth of data that reflects not only students' performance and skills, but also valuable information about how they live, the influences they have from home and their school environment, as well as school conditions and infrastructure.
Ninety-one percent of young people in Europe aged 20-24 have successfully completed upper secondary education (ISCED 3) in 2018. This confirms the positive trend observed across Europe since 2000. In fact, the vast majority of countries report an increase in the number of young people holding at least a upper secondary education degree in the last ten years. Several countries report rates well above the European average: in Belgium, Spain, Estonia, Finland, the UK, Ireland, Latvia, Norway and Sweden, around nine out of ten people between the ages of 20 and 24 have at least one higher secondary education degree. The highest level is in Finland, where the number is over 99% for this age group. For Greece, there is a decrease of about 2% [The World Bank].
The purpose of the work is twofold
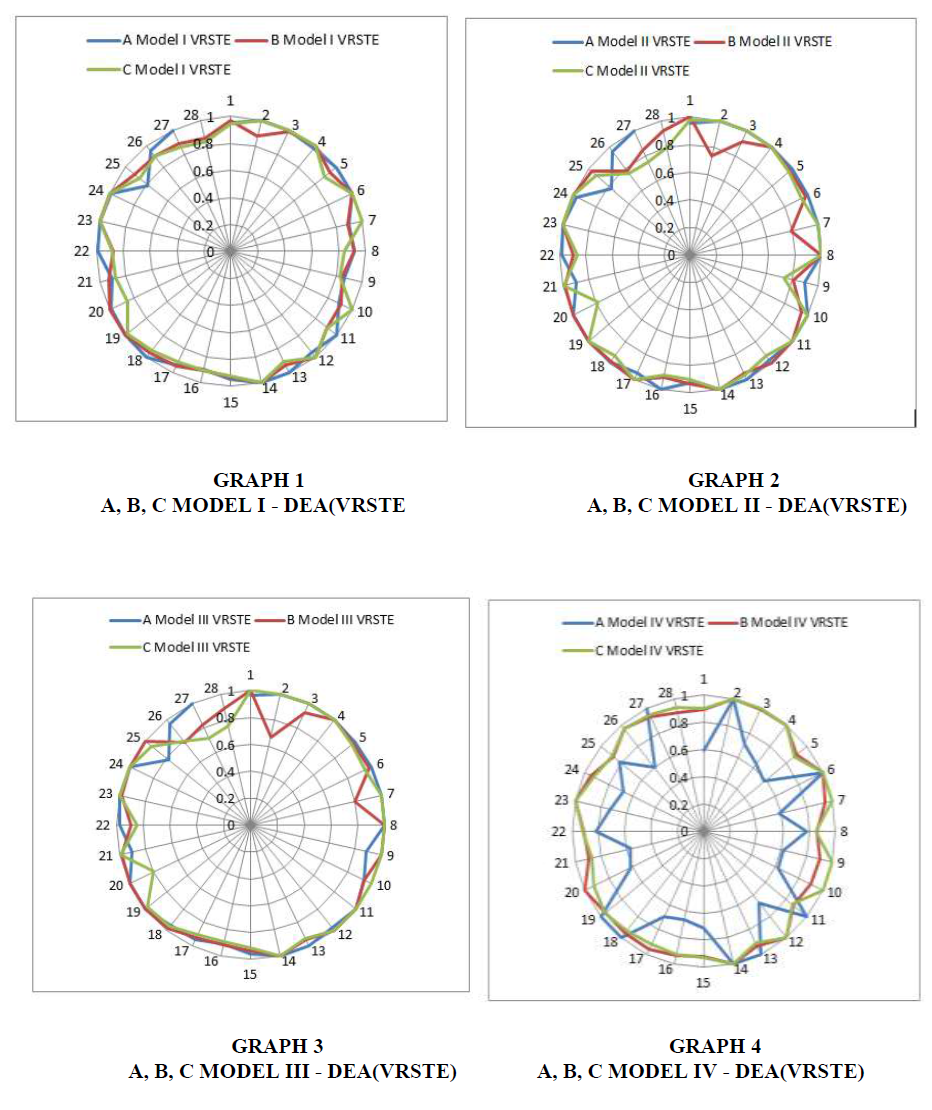
First, the measurement of the input-oriented relative efficiency by using DEA method under variable returns to scale (VRSTE) during the period 2009-18. The DEA, despite its flexibility, does not allow statistical interference.
Secondly, the identification of EU countries where efficiency in secondary education is higher than average. These EU countries can be used as benchmarks to improve the efficiency of other countries in secondary education. Measuring the efficiency of EU countries in secondary education identifies the inefficient EU countries and analyzing results, provides useful conclusions to decision makers.
The rest of the work is organized as follows: In Section 1, a brief reference to the Greek secondary education system is presented. Section 2 provides a brief theoretical methodology, and review of the empirical literature. In Section 3, the data are presented and the results are discussed. Finally, Section 4 presents the final remarks and policy proposals (implications).
A Brief Review of Greek Secondary Education1
Secondary education includes two cycles of study: Gymnasio.
The first one is compulsory and corresponds to gymnasio (lower secondary school).
1. It lasts 3 years
2. It provides general education
3. It covers ages 12-15
4. It is a prerequisite for enrolling at general or vocational upper secondary schools
5. Parallel to imerisio (day) gymnasio, esperino (evening) gymnasio operates. Attendance starts at the age of 14.
Lykeio (Upper Secondary schools)
The second one is the optional geniko or epangelmatiko lykeio (general or vocational upper secondary school).
1. It lasts 3 years
2. Pupils enrol at the age of 15
3. There are two different types:
A. Geniko (general) lykeio. It lasts 3 years and includes both common core subjects and optional subjects of specialisation
B. Epangelmatiko (vocational) lykeio. It offers two cycles of studies:
I. The secondary cycle
II. The optional post-secondary cycle, the so-called “apprenticeship class”.
Parallel to day lykeia, there are also:
A. Esperina genika (evening general) lykeia
B. Esperina epangelmatika (evening vocational) lykeia.
Review of Literature
Variables’ Sampling, Sources and Data
We use five variables: Expenditure per student, secondary (% of GDP per capita) (X1),Teacher- pupil ratio, secondary (X2), School enrolment, secondary (% gross) (X3), PISA average (2015) (X4), School enrolment, tertiary (% gross) (X5). The data provided by the OECD, UNESCO and the World Bank’s Development Indicators database.
Methodology and Models
In this study we have used four models to study the relative efficiency in secondary education of EU member countries during the periods 2009-12 (Table A.1), 2012-15 (Table A.1) and 2015-19 (Table A.3). Existing studies show that DEA is an effective research tool for evaluating the efficiency of the education sector, given the diverse combination of inputs and types and number of outcomes. As a result, different inputs and outputs/outcomes were tested on four DEA analysis models. The four models are structured as follows:
| MODEL | INPUTS | OUTPUTS |
| I | X1 | X2, X3 |
| II | X1, X2 | X3, X4 |
| III | X2 | X4, X5 |
| IV | X3 | X4, X5 |
In the majority of studies using DEA the data are analyzed cross-sectionally, with each decision-making unit (DMU)-in this case the country - being observed only once. Nevertheless, data on DMUs are often available over multiple time periods. In such cases, it is possible to perform DEA over time where each DMU in each time period is treated as if it were a distinct DMU. For the data analysis we use the DEAP Version 2.1 software package and Frontier Version 4.1 software package (Coelli, 1996)2.
Empirical Analysis
Methodology and Data
Efficiency analysis is a well-known problem in economics (Farrell, 1957). In education empirical research the most popular technique is Data Envelopment Analysis. Education is the application that attracts the most attention in the early days of DEA development. Frontier efficiency measurement techniques have been applied to many different types of education institutions. These include primary and secondary schools. (Bessent et al., 1982); Deller and Rudnicki (1993); Chalos and Cherian (1995) Data Envelopment Analysis has its origins in the seminal work by Charnes et al. (1978) who reformulated Farrell’s (1957) work. It is non– parametric linear programming techniques that estimate the relative efficiency of homogeneous Decision Making Units (DMUs). Data Envelopment Analysis provides an analytical tool for determining effective and ineffective performance as the starting point for inducing theories about best-practice behavior (Charnes et al., 1994). This method defines a non-parametric frontier and measures the efficiency of each DMU (here upper secondary school) relative to that frontier. This method evaluates DMUs based on efficiency ratings (≤ 1 or ≤ 100%). A score of 1 means that the DMU is efficient. A DMU with efficiency score less than 100% is regarded to be inefficient relative to other units. DMUs face the same efficiency frontier, independently of their relative size.
The model could be input-oriented, which refers to the determination of minimum inputs for producing a given level of output. Also, the model could be output-oriented, by focusing on the maximization of outputs with given levels of inputs. This study employs an input-oriented model as we can assume that Upper Secondary schools aim to minimize their inputs for a given level of outputs. Moreover, the input-oriented is selected because we suspect at least from a longer-term perspective, that outputs are less upper secondary school choice variables than inputs for our upper secondary schools, so input choices are assumed to predominate. In undertaking previous work comparisons of input-oriented and output-oriented Data Envelopment Analysis analyses suggested that the results were not sensitive (Millan and Chan, 2006). Formally, under an input-oriented perspective we have to deal with the following Data Envelopment Analysis model in envelopment form (Charnes et al., 1978):
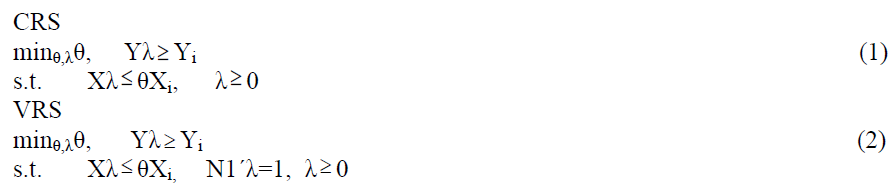
where λ is the vector of relative weights (N×1) given to each unit and N is the number of unit. Assuming that there data on I inputs and O outputs: X represents the matrix of inputs (I × N) and Y is the matrix of outputs (O×N). For the ith unit these are represented by the column vectors Xi for the inputs and Yi for the outputs. This refers to constant returns to scale (Constant Returns to Scale) model.
The Constant Returns to Scale assumption is avoided in the Variable Returns to Scale model (Banker et al., 1984) by the introduction of an additional constraint on the λ, allowing returns to scale, i.e., N1΄λ=1, where N1′ is a vector of ones. This restriction imposes convexity of the frontier. Finally, the efficiency score (θ) is a scalar and estimate the technical efficiency by assuming values between 0 and 1, with a value of 1 indicating a point on the frontier and hence a technical efficient unit (Farell, 1957).
In this study we employ the non-parametric output-oriented DEA in order to measure the relative T.E. Scale Efficiency and the SFA of 64 public upper secondary schools.
Results and Discussion
Table 1 gives us useful and interesting data on this study. In particular during the AD period (2009-12) and for four examination models, there is only one country that is fully efficient in secondary education, Finland. The Ranking of this country is interesting, where it does not change significantly. While, the countries with low efficiency, show a greater difference in the change of the Ranking, such as the countries Malta, Cyprus, Bulgaria, Sweden (Table A.4 in Appendix). For model I, the mean efficiency is high with a value of 0.933 and a small standard deviation with a value of 0.054 and relative variability with a value of 5.8, i.e. the sample is not homogeneous, while the slope has a value -1.367<0, i.e. the distribution shows a negative asymmetry, so its vertex is shifted to the right and the kurtosis is 3.196>3, i.e. the distribution is finely convex. The same picture with small differences is presented in the next three models II, III and IV, i.e. we have a very large deviation in efficiency, which is can be seen from the range from 0.241 to 0.603.
| Table 1 Descriptive Statistics DEA, for the Period 2009-12(A) | ||||
| Descriptive Statistics | Model I | Model II | Model III | Model IV |
| VRSTE | ||||
| Mean | 0.933 | 0.924 | 0.909 | 0.928 |
| Median | 0.938 | 0.934 | 0.932 | 0.954 |
| Mode | 1 | 1 | 1 | 1 |
| S.D3. | 0.054 | 0.078 | 0.123 | 0.114 |
| C.V4. | 5.8 | 8.4 | 13.5 | 12.3 |
| Min | 0.759 | 0.630 | 0.358 | 0.397 |
| Max | 1 | 1 | 1 | 1 |
| Range | 0.241 | 0.370 | 0.642 | 0.603 |
| Skewness | -1.367 | -2.208 | -3.615 | -4.064 |
| Kurtosis | 3.196 | 6.727 | 15.752 | 19.008 |
Finland is one of the countries on the efficiency frontier and Malta is a tail. Greece holds a position close to the average of the EU countries in this study, during the period 2009-12.
Table 2 presents the descriptive statistics DEA, for the period 2012-15.
| Table 2 Descriptive Statistics DEA, for the Period 2012-15(B) | ||||
| Descriptive Statistics | Model I | Model II | Model III | Model IV |
| VRSTE | ||||
| Mean | 0.806 | 0.933 | 0.923 | 0.953 |
| Median | 0.780 | 0.934 | 0.933 | 0.950 |
| Mode | 1 | 1 | 1 | 1 |
| S.D. | 0.986 | 0.525 | 0.516 | 0.036 |
| C.V. | 122.3 | 56.3 | 55.9 | 3.8 |
| Min | 0.661 | 0.822 | 0.813 | 0.883 |
| Max | 1 | 1 | 1 | 1 |
| Range | 0.339 | 0.178 | 0.187 | 0.117 |
| Skewness | 0.711 | -0.532 | -0.499 | -0.216 |
| Kurtosis | -0.411 | -0.292 | -0.022 | -0.622 |
Table 2 gives us useful and interesting data on this study. In particular, during the B΄ period (2012-15) and for four examination models, there are no countries that are fully efficient in secondary education. While, low-efficiency countries, show a greater difference in the change of the Ranking, such as the countries Malta, Cyprus, Czech (Table A.5 in Appendix). For model I, the mean efficiency is relatively low with a value of 0.806 and standard deviation of 0.986 and relative variability having a value of 122.3, i.e. the sample is not homogeneous, the skewness is 0.711>0, i.e. the distribution has a positive asymmetry, so its vertex is shifted to the right and the kurtosis has a value of -0.411<3, i.e. the distribution is wide. In the next three following models II, III and IV the average value ranges from 0.933 to 0.953 and the standard deviation ranges from 0.036 to 0.525. Finland is one of the countries with high efficiency, while whereas Malta (Model I), Cyprus (Model II, III & IV), Romania (Model III & IV) are high on the scale of efficiency in secondary education, during this period. Greece continues to be around the average in the list of EU countries in the period 2012-15. Table 3 presents the descriptive statistics DEA, for the period 2015-18.
Table 3 again gives us useful and interesting data on this study. More specifically, during the C΄ period (2015-18) and for four examination models, there is only one country that is fully efficient in secondary education, Finland. Another interesting feature is the Ranking in Greece, where it does not change significantly. While, countries with low efficiency in secondary education, differ more widely in the change of the Ranking, such as the countries Croatia and France (Table A.6 in Appendix). For model I, the mean efficiency is low with a value of 0.762 and a small standard deviation with a value of 0.127 and relative variability with a value of 16.7, i.e. the sample is not homogeneous, the skewness has a value of 0.941> 0, i.e. the distribution has a positive asymmetry, so its vertex is shifted to the right and the kurtosis has a value of - 0.431<3, i.e. the distribution is wide. In the next three models II, III and IV the average value ranges from 0.931 to 0.960 and the standard deviation ranges from 0.035 to 0.055. Finland is one of the countries with high efficiency, while on the contrary Croatia (Model I), Romania (Model II & III), Bulgaria (Model III & IV) are still high on the scale of efficiency in secondary education, during this period. Finland is one of the countries on the border of efficiency and Croatia (Model I), Romania (Model II & III), Bulgaria (Model III & IV) are tails in terms of the size of efficiency in secondary education, over that period. Greece shows a decline in the position of the list of EU countries, during the last period 2015-18.
| Table 3 Descriptive Statistics DEA, for the Period 2015-18 (C) | ||||
| Descriptive Statistics | Model I | Model II | Model III | Model IV |
| VRSTE | ||||
| Mean | 0.762 | 0.931 | 0.935 | 0.960 |
| Median | 0.716 | 0.937 | 0.950 | 0.961 |
| Mode | 1 | 1 | 1 | 1 |
| S.D. | 0.127 | 0.054 | 0.055 | 0.035 |
| C.V. | 16.7 | 5.8 | 5.9 | 3.6 |
| Min | 0.603 | 0.809 | 0.804 | 0.863 |
| Max | 1 | 1 | 1 | 1 |
| Range | 0.397 | 0.191 | 0.196 | 0.137 |
| Skewness | 0.941 | -0.507 | -0.931 | -0.951 |
| Kurtosis | -0.431 | -0.537 | 0.313 | 1.180 |
From Table A.7 in Appendix, we find that in all four study models, Finland is fully efficient in secondary education. This country is the country of benchmarks. The results of which must be adopted by the rest. While Estonia is perfectly efficient only during periods II & IV, Greece is perfectly efficient only during periods I, III & IV, Slovakia is perfectly efficient only during periods IV, Ireland is perfectly efficient during periods II and III and finally Belgium is perfectly efficient only in period I. All other EU countries are less efficient in secondary education. At a very good level of efficiency in the four study models, during all three periods, are the UK, Netherlands, Ireland, Greece, Estonia, Denmark, Belgium and of course Finland. On the other hand, Bulgaria, Croatia, Cyprus, Hungary, Latvia, Lithuania, Luxembourg, Malta, Romania and Slovakia are at a very poor level of efficiency. Malta in particular at the last place, followed by Cyprus, Romania, Lithuania and Luxembourg. So Malta, in order to achieve optimal efficiency, should increase the output of the study by 26.3% (output-oriented). Greece, as can be seen from the table below 5, is around the average, i.e. it is in a relatively good position compared to other EU countries, during the period 2009-2018. We can classify EU countries in terms of relative efficiency in secondary education into four quarters. Table 4 below shows this classification.
| Table 4 Quarters of EU Countries in Terms of Efficiency in Secondary | |||
| Quarter I | Quarter II | Quarter III | Quarter IV |
| Finland | Germany | Czech.R | Luxemburg |
| Belgium | Slovenia | Austria | Lithuania |
| Netherlands | Spain | Portugal | Slovakia |
| UK | Poland | Latvia | Bulgaria |
| Estonia | Greece | Italy | Romania |
| Denmark | France | Croatia | Cyprus |
| Ireland | Sweden | Hungary | Malta |
The countries that need to significantly improve their efficiency are the countries in the IV quadrant, while the countries in the II and III quadrants, can make appropriate corrective actions in inputs(reduction) and outputs(increase) so as to improve their efficiency and reach the desired optimal position of the I quadrant .
Concluding Remarks and Policy Recommendations
In almost all European countries Secondary Education receives proportionately more Government funding than any other level of education. Therefore, measuring the efficiency of secondary education is particularly important. However, the analysis of the measurement of efficiency in secondary education in policy-making is not common. Existing literature show that DEA is an effective tool for evaluating the efficiency of the education sector, given the varying combination of inputs, outputs and number of outcomes. As a result, different inputs and outputs were tested on four DEA analysis models.
According to the empirical results, Greece has a relatively high technical efficiency in secondary education, as it is ranked in the second quarter among the twenty-eight EU countries. Greece's is near to the EU in terms of efficiency in secondary education. Inefficiency is particularly low in Malta, Cyprus, Romania, Bulgaria, Slovakia, Lithuania, and Luxembourg, where poor scores come mainly from low enrollment rates (secondary and tertiary) and low PISA scores. Indeed, public expenditure on secondary education is relatively high for Greece.
Therefore, in order to retain a good level of efficiency in secondary education or to improve its position relative to other EU countries, Greece must continue a number of initiatives to enhance the efficiency in secondary education sector.
Suggested
Firstly, set up an Observatory body, especially in the low-efficiency countries, to monitor annual performance in secondary education. Data would naturally be made available to policymakers.
Secondly, it is advisable that for Greece the considerable potential for rationalizing public secondary education expenditure that is being exploited without sacrificing the results and the redirection of resources in the field of higher education is also recommended.
Thirdly, the secondary education system in Greece needs to be modernized to reduce operating costs by merging and closing selected schools that serve very few students, while taking into account other socio-economic issues (remote mountainous areas and small islands). The teaching surplus should be rationalized without completely replacing those who retire. Indeed, a reduction in the number of secondary school teachers due to retirement and the implementation of a selective reduction in the recruitment of new teachers is required in the future.
However, at least three considerations need to be taken into account when measuring the efficiency of the secondary education sector and they should be taken into account when interpreting the results presented.
First, the applications of the techniques presented are hampered by the lack of adequate data to support these techniques. Quality data are required because available efficiency measurement techniques are sensitive to extreme points and may be influenced by external factors. Indeed, the substantial inefficiency found may merely reflect environmental factors (such as climate, socio-economic background, etc.). This also suggests the need to apply a combination of techniques to measure efficiency and effectiveness.
Second, the exact definition used for inputs, outputs, and outcomes can significantly affect results.
Finally, it is vital importance to know that when using a non-parametric approach and although DEA is an established and valid methodology, differences between countries are not statistically evaluated, which can be considered as a further limitation of such a methodology.
End Notes
1. https://eacea.ec.europa.eu/national-policies/eurydice
2. Coelli, T.J. (1996). A Guide to FRONTIER Version 4.1: A Computer Program for Stochastic Frontier Production and Cost Function Estimation. CEPA Working Paper No. 7/96, Department of Econometrics, University of New England, Armidale. http://www.uq.edu.au/economics/cepa/frontier.php
3. S.D.: Standard Deviation
4. C.V.: Coefficient of Variability
References
- Afonso, A., & Aubyn, M. S. (2006a). Cross-country efficiency of secondary education provision: A semi-parametric analysis with non-discretionary inputs, Economic Modelling, 23(3), 476-491.
- Afonso, A., Schuknecht, L., & Tanzi, V. (2005). Public sector efficiency: an international comparison, Public Choice 123(3-4), 321-347.
- Afonso, A., Schuknecht, L., & Tanzi, V. (2006). Public sector efficiency: evidence for new EU member states and emerging markets, European Central Bank, Working Paper Series. European Central Bank: Frankfurt, 581.
- Afonso, A., Schuknecht, L., & Tanzi, V. (2008). Income distribution determinants and public spending efficiency, Working Paper Series. European Central Bank: Frankfurt, 861.
- Afonso, A., & St. Aubyn, M. (2005). Non-parametric approaches to education and health efficiency in OECD countries, Journal of Applied Economics, 8(2), 227-246.
- Afonso, A., & St. Aubyn, M. (2006b). Relative efficiency of health provision: a DEA approach with non-discretionary inputs, ISEG-UTL, Department of Economics Working Paper 33/2006/DE/UECE.
- Aristovnik, A. (2012a). The relative efficiency of education and R&D expenditures in the new EU member states, Journal of Business Economics and Management, 13(5): 832-848.
- Aristovnik, A. (2012b). Measuring relative efficiency in health and education sector: the case of East European countries, Actual Problems of Economics, 10(136), 305-314.
- Bessent, A., Bessent, W., Kennington. J., & Reagan, B. (1982). An application of mathematical programming to assess productivity in the Houston independent school district. Management Science, 28, 1355-1367.
- Castano, M.C., & Cabanda, E. (2007). Sources of efficiency and productivity growth in the Philippine State universities and colleges: a non-parametric approach, International Business & Economics Research Journal 6(6), 79-90.
- Chalos P., & Cherian, J. (1995). An Application of Data Envelopment Analysis to Public-Sector Performance-Measurement and Accountability. J Accounting and Public Policy, 1, 143-160.
- Charnes, A., Cooper, W., & Rhodes, E. (1978). Measuring the efficiency of decision making units. European Journal of Operational Research, 2(6), 429- 444.
- Charnes, A., Cooper, W., Lewin, A., & Seiford, L. (Eds.) (1994). Data Envelopment Analysis: Theory, Methodology, and Applications, Kluwer, Boston.
- Chen, J.K., & Chen, I.S. (2011). Inno-Qual efficiency of higher education: empirical testing using data envelopment analysis. Expert Systems with Applications, 38(3), 1823-1834.
- Cherchye, L., De Witte, K., Ooghe, E., & Nicaise, I. (2010). Efficiency and equity in private and public education: nonparametric comparison, European Journal of Operational Research, 202(2), 563-573.
- Clements, B. (2002). How efficient is education spending in Europe?, European Review of Economics and Finance 1, 3-26.
- Coelli, T. (1996). A Guide to DEP Version 2-1: A Data Envelopment Analysis A Computer Program, CEPA, Australia.
- Deller, S.C. and Rudnicki, E. (1993). Production Efficiency in Elementary Education. The Case of Maine Public School. Economics of Education Review, 12(1), 45-57.
- European commission (2017) – Eurostat – Eurydice, Luxembourg.
- Eurostat, (2018). Key data on education in Europe -2018.
- Farrell, M. (1957). The measurements of productive efficiency. Journal of the Royal Statistical Society Series A, 120(3), 253-290.
- Gavurova, B., Kocisova, K., Belas, L., & Krajcik, V. (2017). Relative efficiency of government expenditure on secondary education. Journal of International Studies, 10(2), 329-343.
- Grosskopf, S. & Moutray, C. (2001). Evaluating performance in Chicago public high schools in the wake of decentralization. Economics of Education Review, 20(1), 1-14.
- Gunnarsson, V., & Mattina, T. (2007). Budget rigidity and expenditure efficiency in Slovenia. IMF Working Paper WP/07/131.
- Gupta, S., & Verhoeven, M. (2001). The efficiency of government expenditure experiences from Africa. Journal of Policy Modelling, 23(4), 433-467.
- Hanushek, E., & Woessmann, L. (2011). The Economics of International Differences in Educational Achievement. Handbook of the Economics of Education, 3, 89-200.
- Hanushek, E.A. (1986). The Economics of Schooling: Production and Efficiency in Public Schools. J Economic Literature, 24, 1141-1177.
- Jafarov, E., Gunnarsson, V. (2008). Government spending on health care and education in Croatia: efficiency and reform options. IMF Working Paper WP/08/136.
- Johnes, J. (2006). Data envelopment analysis and its application to the measurement of efficiency in higher education, Economics of Education Review, 25(3), 273-288.
- Mandl, U., Dierx, A., & Ilzkovitz, F. (2008). The effectiveness and efficiency of public spending, European Commission Economic Papers 31, February.
- Obadic, A., & Aristovnik, A. (2011). Relative efficiency of higher education in Croatia and Slovenia: an international comparison. Amfiteatru Economic, 13(30), 362-376.
- Thieme, C., Gimenez, V., & Prior, D. (2012). A comparative analysis of the efficiency of national education systems. Asia Pacific Education Review, 13(1), 1-15.
- World Bank (2010). World Development Indicators. Available from Internet: data.worldbank.org/indicator.
Appendix
| Table A.1 Variables (Prices) of EU Countries, for the Period 2009-12(A) | ||||||
| No. | Country | Variables | ||||
| X1 | X2 | X3 | X4 | X5 | ||
| 1 | Austria | 29.048 | 9.978 | 98.861 | 506 | 74.101 |
| 2 | Belgium | 0.01 | 0.01 | 156.711 | 505 | 67.646 |
| 3 | Bulgaria | 21.944 | 12.123 | 90.888 | 446 | 57.023 |
| 4 | Czech R. | 23.459 | 9.799 | 94.771 | 508 | 63.532 |
| 5 | Cyprus | 37.343 | 8.16 | 94.218 | 438 | 48.952 |
| 6 | Denmark | 31.206 | 0.01 | 120.056 | 498 | 74.879 |
| 7 | Estonia | 27.331 | 8.992 | 105.15 | 541 | 68.407 |
| 8 | Finland | 34.656 | 9.766 | 107.72 | 545 | 93.221 |
| 9 | France | 27.997 | 12.623 | 106.425 | 499 | 54.427 |
| 10 | Germany | 23.527 | 13.008 | 103.517 | 524 | 0.01 |
| 11 | Greece | 0.01 | 0.01 | 100.839 | 467 | 104.417 |
| 12 | Hungary | 21.277 | 10.185 | 96.702 | 494 | 63.64 |
| 13 | Ireland | 27.798 | 0.01 | 116.108 | 522 | 62.476 |
| 14 | Italy | 23.924 | 0.01 | 101.672 | 494 | 66.26 |
| 15 | Latvia | 26.941 | 8.783 | 102.603 | 502 | 86.627 |
| 16 | Lithuania | 21.71 | 8.558 | 105.277 | 496 | 18.275 |
| 17 | Luxembourg | 18.801 | 8.646 | 101.183 | 491 | 70.02 |
| 18 | Malta | 48.954 | 8.314 | 98.674 | 0.01 | 37.336 |
| 19 | Netherlands | 0.01 | 13.568 | 123.621 | 522 | 66.92 |
| 20 | Poland | 23.716 | 9.995 | 96.079 | 526 | 73.948 |
| 21 | Portugal | 34.876 | 7.384 | 105.877 | 489 | 65.167 |
| 22 | Romania | 13.804 | 12.609 | 96.642 | 439 | 64.816 |
| 23 | Slovakia | 17.653 | 12.026 | 92.182 | 471 | 56.455 |
| 24 | Slovenia | 30.332 | 9.073 | 98.573 | 514 | 87.162 |
| 25 | Spain | 26.52 | 10.802 | 123.508 | 496 | 78.407 |
| 26 | Sweden | 30.835 | 9.612 | 98.195 | 485 | 72.413 |
| 27 | UK | 29.837 | 0.01 | 99.089 | 514 | 58.91 |
| Mean | 23.204 | 7.928 | 105 | 478.96 | 64.276 | |
| S.D. | 11.097 | 4.592 | 13.555 | 99.507 | 21.09 | |
| Table A.2 Variables (Prices) of EU Countries, for the Period 2012-15(B) | ||||||
| No. | Country | Variables | ||||
| X1 | X2 | X3 | X4 | X5 | ||
| 1 | Austria | 27.121 | 9.608 | 98.742 | 495 | 79.124 |
| 2 | Belgium | 24.534 | 9.436 | 160.342 | 502 | 72.103 |
| 3 | Bulgaria | 20.19 | 12.864 | 100.081 | 446 | 64.366 |
| 4 | Croatia | 0.01 | 11.37 | 99.138 | 475 | 64.394 |
| 5 | Czech R. | 23.811 | 9.644 | 101.792 | 493 | 65.437 |
| 6 | Cyprus | 37.789 | 7.841 | 97.676 | 433 | 48.831 |
| 7 | Denmark | 28.91 | 11.29 | 127.363 | 502 | 80.359 |
| 8 | Estonia | 21.622 | 8.237 | 107.984 | 534 | 73.101 |
| 9 | Finland | 26.071 | 11.577 | 132.993 | 531 | 90.926 |
| 10 | France | 26.764 | 12.886 | 104.77 | 495 | 59.844 |
| 11 | Germany | 23.158 | 12.502 | 101.596 | 509 | 62.322 |
| 12 | Greece | 0.01 | 8.011 | 100.668 | 455 | 113.249 |
| 13 | Hungary | 19.292 | 10.474 | 102.293 | 477 | 56.834 |
| 14 | Ireland | 23.681 | 0.01 | 117.246 | 503 | 71.237 |
| 15 | Italy | 22.555 | 11.375 | 102.293 | 481 | 64.02 |
| 16 | Latvia | 31.528 | 8.164 | 111.61 | 490 | 74.562 |
| 17 | Lithuania | 17.05 | 8.318 | 107.784 | 475 | 19.407 |
| 18 | Luxembourg | 20.656 | 8.148 | 101.645 | 483 | 68.873 |
| 19 | Malta | 38.122 | 8.164 | 93.981 | 465 | 43.834 |
| 20 | Netherlands | 0.01 | 14.24 | 130.118 | 509 | 76.61 |
| 21 | Poland | 22.235 | 9.218 | 103.048 | 501 | 71.377 |
| 22 | Portugal | 29.087 | 9.277 | 114.214 | 501 | 66.347 |
| 23 | Romania | 14.233 | 12.612 | 94.677 | 435 | 48.606 |
| 24 | Slovakia | 18.756 | 11.229 | 91.353 | 461 | 54.388 |
| 25 | Slovenia | 25.147 | 9.679 | 106.176 | 513 | 84.706 |
| 26 | Spain | 19.247 | 11.758 | 130.455 | 493 | 87.032 |
| 27 | Sweden | 24.673 | 11.481 | 119.884 | 493 | 64.741 |
| 28 | UK | 22.86 | 15.848 | 114.599 | 509 | 58.239 |
| Mean | 21.754 | 10.188 | 109.804 | 487.82 | 67.317 | |
| S.D. | 9.349 | 2.868 | 15.184 | 25.475 | 17.122 | |
| Table A.3 Variables (Prices) of EU Countries, for the Period 2015-18(C) | ||||||
| No. | Country | Variables | ||||
| X1 | X2 | X3 | X4 | X5 | ||
| 1 | Austria | 27.274 | 9.441 | 100.977 | 490 | 83.444 |
| 2 | Belgium | 0.01 | 9.286 | 162.482 | 499 | 75.224 |
| 3 | Bulgaria | 0.01 | 12.637 | 101.122 | 424 | 70.767 |
| 4 | Croatia | 0.01 | 0.01 | 97.995 | 472 | 67.24 |
| 5 | Czech R. | 23.668 | 10.353 | 104.838 | 497 | 64.102 |
| 6 | Cyprus | 39.399 | 6.883 | 99.778 | 439 | 60.101 |
| 7 | Denmark | 0.01 | 0.01 | 129.689 | 493 | 81.595 |
| 8 | Estonia | 18.108 | 8.783 | 112.937 | 530 | 71.72 |
| 9 | Finland | 25.847 | 13.241 | 151.088 | 522 | 87.336 |
| 10 | France | 26.454 | 0.01 | 103.256 | 493 | 63.607 |
| 11 | Germany | 23.041 | 12.072 | 101.486 | 503 | 67.302 |
| 12 | Greece | 22.582 | 8.535 | 99.768 | 452 | 126.383 |
| 13 | Hungary | 21.208 | 10.154 | 102.851 | 481 | 48.489 |
| 14 | Ireland | 16.467 | 0.01 | 117.009 | 496 | 77.395 |
| 15 | Italy | 22.897 | 10.669 | 103.004 | 468 | 62.945 |
| 16 | Latvia | 24.843 | 7.789 | 111.459 | 487 | 70.43 |
| 17 | Lithuania | 17.052 | 9.138 | 107.551 | 482 | 19.636 |
| 18 | Luxembourg | 19.213 | 8.069 | 102.816 | 477 | 80.987 |
| 19 | Malta | 29.884 | 7.503 | 95.265 | 457 | 48.129 |
| 20 | Netherlands | 22.92 | 14.433 | 133.117 | 503 | 80.466 |
| 21 | Poland | 22.108 | 9.258 | 106.843 | 511 | 66.614 |
| 22 | Portugal | 27.693 | 9.787 | 117.867 | 492 | 62.186 |
| 23 | Romania | 16.192 | 12.108 | 89.938 | 426 | 47.423 |
| 24 | Slovakia | 19.199 | 11.152 | 91.11 | 464 | 49.245 |
| 25 | Slovenia | 23.873 | 9.953 | 112.554 | 507 | 78.833 |
| 26 | Spain | 18.52 | 11.796 | 128.715 | 483 | 90.331 |
| 27 | Sweden | 23.597 | 12.887 | 142.672 | 499 | 62.916 |
| 28 | UK | 21.079 | 17.453 | 138.831 | 505 | 58.35 |
| Mean | 19.756 | 9.051 | 113.108 | 484 | 68.686 | |
| S.D. | 9.44 | 4.385 | 18.533 | 26.261 | 18.727 | |
| Table A.4 DEA Efficiencies and Ranking about Models, for The PERIOD 2009-12(A) | |||||||||
| No. | Country | Model I | Model II | Model III | Model IV | ||||
| VRSTE | Rank | VRSTE | Rank | VRSTE | Rank | VRSTE | Rank | ||
| 1 | Austria | 0.938 | 14 | 0.934 | 14 | 0.928 | 15 | 0.954 | 14 |
| 2 | Belgium | 1.000 | 1 | 1.000 | 1 | 0.983 | 7 | 0.927 | 16 |
| 3 | Bulgaria | 0.893 | 25 | 0.830 | 24 | 0.818 | 24 | 1.000 | 1 |
| 4 | Czech R. | 0.944 | 12 | 0.944 | 12 | 0.932 | 13 | 1.000 | 2 |
| 5 | Cyprus | 0.817 | 26 | 0.814 | 26 | 0.809 | 25 | 0.876 | 25 |
| 6 | Denmark | 0.942 | 13 | 0.961 | 9 | 0.987 | 5 | 0.914 | 22 |
| 7 | Estonia | 1.000 | 2 | 1.000 | 2 | 0.996 | 4 | 1.000 | 3 |
| 8 | Finland | 1.000 | 3 | 1.000 | 3 | 1.000 | 1 | 1.000 | 4 |
| 9 | France | 0.952 | 9 | 0.927 | 16 | 0.916 | 16 | 0.919 | 19 |
| 10 | Germany | 0.998 | 5 | 0.973 | 8 | 0.961 | 10 | 0.973 | 9 |
| 11 | Greece | 0.895 | 24 | 0.925 | 18 | 1.000 | 2 | 1.000 | 5 |
| 12 | Hungary | 0.921 | 18 | 0.920 | 20 | 0.906 | 20 | 0.937 | 15 |
| 13 | Ireland | 0.974 | 7 | 1.000 | 4 | 1.000 | 3 | 0.958 | 11 |
| 14 | Italy | 0.918 | 19 | 0.951 | 10 | 0.962 | 9 | 0.923 | 17 |
| 15 | Latvia | 0.930 | 15 | 0.931 | 15 | 0.932 | 14 | 0.956 | 13 |
| 16 | Lithuania | 0.925 | 17 | 0.927 | 17 | 0.915 | 17 | 0.916 | 21 |
| 17 | Luxembourg | 0.918 | 20 | 0.921 | 19 | 0.905 | 21 | 0.919 | 20 |
| 18 | Malta | 0.759 | 27 | 0.630 | 27 | 0.358 | 27 | 0.397 | 27 |
| 19 | Netherlands | 1.000 | 4 | 1.000 | 5 | 0.958 | 11 | 0.958 | 12 |
| 20 | Poland | 0.977 | 6 | 0.977 | 7 | 0.965 | 8 | 1.000 | 6 |
| 21 | Portugal | 0.909 | 21 | 0.911 | 21 | 0.907 | 19 | 0.902 | 24 |
| 22 | Romania | 0.929 | 16 | 0.826 | 25 | 0.806 | 26 | 0.841 | 26 |
| 23 | Slovakia | 0.900 | 22 | 0.882 | 23 | 0.864 | 23 | 1.000 | 7 |
| 24 | Slovenia | 0.947 | 11 | 0.948 | 11 | 0.948 | 12 | 1.000 | 8 |
| 25 | Spain | 0.956 | 8 | 0.943 | 13 | 0.910 | 18 | 0.910 | 23 |
| 26 | Sweden | 0.899 | 23 | 0.895 | 22 | 0.891 | 22 | 0.920 | 18 |
| 27 | UK | 0.948 | 10 | 0.985 | 6 | 0.985 | 6 | 0.968 | 10 |
| Table A.5 DEA Efficiencies and Ranking about Models, for The PERIOD 2012-15(B) | |||||||||
| No. | Country | Model I | Model II | Model III | Model IV | ||||
| VRSTE | Rank | VRSTE | Rank | VRSTE | Rank | VRSTE | Rank | ||
| 1 | Austria | 0.725 | 25 | 0.927 | 18 | 0.936 | 14 | 1.000 | 1 |
| 2 | Belgium | 1.000 | 1 | 1.000 | 1 | 0.941 | 10 | 0.941 | 18 |
| 3 | Bulgaria | 0.838 | 9 | 0.842 | 26 | 0.836 | 26 | 0.889 | 27 |
| 4 | Croatia | 0.798 | 12 | 0.981 | 7 | 0.890 | 22 | 0.955 | 11 |
| 5 | Czech R. | 0.739 | 20 | 0.924 | 19 | 0.923 | 17 | 0.968 | 10 |
| 6 | Cyprus | 0.669 | 27 | 0.822 | 28 | 0.813 | 28 | 0.883 | 28 |
| 7 | Denmark | 0.903 | 6 | 0.949 | 12 | 0.944 | 9 | 0.944 | 16 |
| 8 | Estonia | 0.727 | 24 | 1.000 | 2 | 1.000 | 1 | 1.000 | 2 |
| 9 | Finland | 0.937 | 4 | 1.000 | 3 | 1.000 | 2 | 1.000 | 3 |
| 10 | France | 0.857 | 8 | 0.928 | 17 | 0.927 | 16 | 0.949 | 15 |
| 11 | Germany | 0.831 | 10 | 0.953 | 10 | 0.953 | 7 | 1.000 | 4 |
| 12 | Greece | 0.774 | 15 | 1.000 | 4 | 1.000 | 3 | 1.000 | 5 |
| 13 | Hungary | 0.765 | 16 | 0.899 | 23 | 0.893 | 21 | 0.932 | 22 |
| 14 | Ireland | 0.736 | 21 | 1.000 | 5 | 1.000 | 4 | 0.943 | 17 |
| 15 | Italy | 0.793 | 13 | 0.902 | 22 | 0.901 | 20 | 0.941 | 19 |
| 16 | Latvia | 0.742 | 19 | 0.929 | 15 | 0.929 | 15 | 0.931 | 23 |
| 17 | Lithuania | 0.729 | 23 | 0.912 | 20 | 0.890 | 22 | 0.891 | 26 |
| 18 | Luxembourg | 0.696 | 26 | 0.912 | 21 | 0.909 | 19 | 0.951 | 14 |
| 19 | Malta | 0.661 | 28 | 0.871 | 24 | 0.871 | 24 | 0.982 | 8 |
| 20 | Netherlands | 1.000 | 2 | 1.000 | 6 | 0.955 | 6 | 0.955 | 12 |
| 21 | Poland | 0.733 | 22 | 0.939 | 14 | 0.939 | 12 | 0.975 | 9 |
| 22 | Portugal | 0.786 | 14 | 0.945 | 13 | 0.938 | 13 | 0.938 | 21 |
| 23 | Romania | 0.827 | 11 | 0.828 | 27 | 0.815 | 27 | 0.913 | 25 |
| 24 | Slovakia | 0.746 | 18 | 0.869 | 25 | 0.863 | 25 | 1.000 | 6 |
| 25 | Slovenia | 0.760 | 17 | 0.961 | 8 | 0.973 | 5 | 1.000 | 7 |
| 26 | Spain | 0.931 | 5 | 0.949 | 12 | 0.939 | 12 | 0.939 | 20 |
| 27 | Sweden | 0.874 | 7 | 0.929 | 16 | 0.923 | 18 | 0.923 | 24 |
| 28 | UK | 1.000 | 3 | 0.957 | 9 | 0.953 | 8 | 0.953 | 13 |
| Table A.6 DEA Efficiencies and Ranking about Models, for The PERIOD 2015-18(C) | |||||||||
| No. | Country | Model I | Model II | Model III | Model IV | ||||
| VRSTE | Rank | VRSTE | Rank | VRSTE | Rank | VRSTE | Rank | ||
| 1 | Austria | 0.677 | 21 | 0.925 | 18 | 0.958 | 10 | 1.000 | 1 |
| 2 | Belgium | 1.000 | 1 | 1.000 | 1 | 0.955 | 11 | 0.948 | 21 |
| 3 | Bulgaria | 1.000 | 2 | 0.850 | 26 | 0.814 | 27 | 0.863 | 28 |
| 4 | Croatia | 0.603 | 28 | 0.957 | 12 | 0.952 | 14 | 0.974 | 10 |
| 5 | Czech R. | 0.712 | 15 | 0.938 | 14 | 0.938 | 17 | 0.973 | 11 |
| 6 | Cyprus | 0.632 | 26 | 0.843 | 27 | 0.840 | 26 | 0.888 | 27 |
| 7 | Denmark | 0.798 | 8 | 1.000 | 2 | 1.000 | 1 | 0.953 | 18 |
| 8 | Estonia | 0.730 | 12 | 1.000 | 3 | 1.000 | 2 | 1.000 | 2 |
| 9 | Finland | 1.000 | 3 | 1.000 | 4 | 1.000 | 3 | 1.000 | 3 |
| 10 | France | 0.636 | 25 | 0.994 | 6 | 0.994 | 6 | 0.972 | 12 |
| 11 | Germany | 0.720 | 14 | 0.949 | 13 | 0.949 | 15 | 1.000 | 4 |
| 12 | Greece | 0.657 | 24 | 0.857 | 25 | 1.000 | 4 | 1.000 | 5 |
| 13 | Hungary | 0.698 | 20 | 0.908 | 20 | 0.908 | 22 | 0.950 | 20 |
| 14 | Ireland | 0.720 | 13 | 1.000 | 5 | 1.000 | 5 | 0.956 | 16 |
| 15 | Italy | 0.707 | 18 | 0.884 | 22 | 0.883 | 23 | 0.924 | 26 |
| 16 | Latvia | 0.708 | 16 | 0.931 | 16 | 0.932 | 19 | 0.931 | 24 |
| 17 | Lithuania | 0.708 | 17 | 0.914 | 19 | 0.909 | 21 | 0.932 | 23 |
| 18 | Luxembourg | 0.666 | 22 | 0.905 | 21 | 0.938 | 18 | 0.965 | 13 |
| 19 | Malta | 0.618 | 27 | 0.870 | 24 | 0.870 | 25 | 0.953 | 19 |
| 20 | Netherlands | 0.924 | 6 | 0.959 | 9 | 0.960 | 9 | 0.965 | 14 |
| 21 | Poland | 0.706 | 19 | 0.964 | 8 | 0.964 | 8 | 0.991 | 8 |
| 22 | Portugal | 0.772 | 9 | 0.936 | 15 | 0.928 | 20 | 0.928 | 25 |
| 23 | Romania | 0.741 | 11 | 0.809 | 28 | 0.804 | 28 | 1.000 | 6 |
| 24 | Slovakia | 0.660 | 23 | 0.875 | 23 | 0.875 | 24 | 1.000 | 7 |
| 25 | Slovenia | 0.746 | 10 | 0.958 | 10 | 0.973 | 7 | 0.979 | 9 |
| 26 | Spain | 0.860 | 7 | 0.927 | 17 | 0.953 | 12 | 0.957 | 15 |
| 27 | Sweden | 0.950 | 5 | 0.958 | 11 | 0.942 | 16 | 0.942 | 22 |
| 28 | UK | 1.000 | 4 | 0.969 | 7 | 0.953 | 13 | 0.953 | 17 |
| Table A.7 Results of DEA VRSTE (OO) Per Model and Period, with Descriptive Statistics | |||||||||||||
| MODEL | I | II | III | IV | |||||||||
| PERIOD | 2009-12 | 2012-15 | 2015-18 | 2009-12 | 2012-15 | 2015-18 | 2009-12 | 2012-15 | 2015-18 | 2009-12 | 2012-15 | 2015-18 | |
| DEA | VRSTE | ||||||||||||
| 1 | Austria | 0.938 | 0.725 | 0.677 | 0.934 | 0.927 | 0.925 | 0.928 | 0.936 | 0.958 | 0.954 | 1.000 | 1.000 |
| 2 | Belgium | 1.000 | 1.000 | 1.000 | 1.000 | 1.000 | 1.000 | 0.983 | 0.941 | 0.955 | 0.927 | 0.941 | 0.948 |
| 3 | Bulgaria | 0.893 | 0.838 | 1.000 | 0.830 | 0.842 | 0.850 | 0.818 | 0.836 | 0.814 | 1.000 | 0.889 | 0.863 |
| 4 | Croatia | * | 0.798 | 0.603 | * | 0.981 | 0.957 | * | 0.890 | 0.952 | * | 0.955 | 0.974 |
| 5 | Czech R. | 0.944 | 0.739 | 0.712 | 0.944 | 0.924 | 0.938 | 0.932 | 0.923 | 0.938 | 1.000 | 0.968 | 0.973 |
| 6 | Cyprus | 0.817 | 0.669 | 0.632 | 0.814 | 0.822 | 0.843 | 0.809 | 0.813 | 0.840 | 0.876 | 0.883 | 0.888 |
| 7 | Denmark | 0.942 | 0.903 | 0.798 | 0.961 | 0.949 | 1.000 | 0.987 | 0.944 | 1.000 | 0.914 | 0.944 | 0.953 |
| 8 | Estonia | 1.000 | 0.727 | 0.730 | 1.000 | 1.000 | 1.000 | 0.996 | 1.000 | 1.000 | 1.000 | 1.000 | 1.000 |
| 9 | Finland | 1.000 | 0.937 | 1.000 | 1.000 | 1.000 | 1.000 | 1.000 | 1.000 | 1.000 | 1.000 | 1.000 | 1.000 |
| 10 | France | 0.952 | 0.857 | 0.636 | 0.927 | 0.928 | 0.994 | 0.916 | 0.927 | 0.994 | 0.919 | 0.949 | 0.972 |
| 11 | Germany | 0.998 | 0.831 | 0.720 | 0.973 | 0.953 | 0.949 | 0.961 | 0.953 | 0.949 | 0.973 | 1.000 | 1.000 |
| 12 | Greece | 0.895 | 0.774 | 0.657 | 0.925 | 1.000 | 0.857 | 1.000 | 1.000 | 1.000 | 1.000 | 1.000 | 1.000 |
| 13 | Hungary | 0.921 | 0.765 | 0.698 | 0.920 | 0.899 | 0.908 | 0.906 | 0.893 | 0.908 | 0.937 | 0.932 | 0.950 |
| 14 | Ireland | 0.974 | 0.736 | 0.720 | 1.000 | 1.000 | 1.000 | 1.000 | 1.000 | 1.000 | 0.958 | 0.943 | 0.956 |
| 15 | Italy | 0.918 | 0.793 | 0.707 | 0.951 | 0.902 | 0.884 | 0.962 | 0.901 | 0.883 | 0.923 | 0.941 | 0.924 |
| 16 | Latvia | 0.930 | 0.742 | 0.708 | 0.931 | 0.929 | 0.931 | 0.932 | 0.929 | 0.932 | 0.956 | 0.931 | 0.931 |
| 17 | Lithuania | 0.925 | 0.729 | 0.708 | 0.927 | 0.912 | 0.914 | 0.915 | 0.890 | 0.909 | 0.916 | 0.891 | 0.932 |
| 18 | Luxembourg | 0.918 | 0.696 | 0.666 | 0.921 | 0.912 | 0.905 | 0.905 | 0.909 | 0.938 | 0.919 | 0.951 | 0.965 |
| 19 | Malta | 0.759 | 0.661 | 0.618 | 0.630 | 0.871 | 0.870 | 0.358 | 0.871 | 0.870 | 0.397 | 0.982 | 0.953 |
| 20 | Netherlands | 1.000 | 1.000 | 0.924 | 1.000 | 1.000 | 0.959 | 0.958 | 0.955 | 0.960 | 0.958 | 0.955 | 0.965 |
| 21 | Poland | 0.977 | 0.733 | 0.706 | 0.977 | 0.939 | 0.964 | 0.965 | 0.939 | 0.964 | 1.000 | 0.975 | 0.991 |
| 22 | Portugal | 0.909 | 0.786 | 0.772 | 0.911 | 0.945 | 0.936 | 0.907 | 0.938 | 0.928 | 0.902 | 0.938 | 0.928 |
| 23 | Romania | 0.929 | 0.827 | 0.741 | 0.826 | 0.828 | 0.809 | 0.806 | 0.815 | 0.804 | 0.841 | 0.913 | 1.000 |
| 24 | Slovakia | 0.900 | 0.746 | 0.660 | 0.882 | 0.869 | 0.875 | 0.864 | 0.863 | 0.875 | 1.000 | 1.000 | 1.000 |
| 25 | Slovenia | 0.947 | 0.760 | 0.746 | 0.948 | 0.961 | 0.958 | 0.948 | 0.973 | 0.973 | 1.000 | 1.000 | 0.979 |
| 26 | Spain | 0.956 | 0.931 | 0.860 | 0.943 | 0.949 | 0.927 | 0.910 | 0.939 | 0.953 | 0.910 | 0.939 | 0.957 |
| 27 | Sweden | 0.899 | 0.874 | 0.950 | 0.895 | 0.929 | 0.958 | 0.891 | 0.923 | 0.942 | 0.920 | 0.923 | 0.942 |
| 28 | UK | 0.948 | 1.000 | 1.000 | 0.985 | 0.957 | 0.969 | 0.985 | 0.953 | 0.953 | 0.968 | 0.953 | 0.953 |