Research Article: 2021 Vol: 25 Issue: 6
Effect of Covid 19 Pandemic on Marketing activity Price of Convenience and Shopping Goods In Bench Sheko Zone, South West Ethiopia
Abebe Alemu, Mizan Tepi University
Citation Information: Alemu., A. (2021). Effect of covid?19 pandemic on marketing activity (price of convenience and shopping goods) in bench sheko zone, south west Ethiopia. Academy of Marketing Studies Journal, 25(6), 1-16.
Abstract
Objective of the study are assess the effect of COVID – 19 pandemic on Marketing Activity (Price of Convenience and shopping goods) in Bench sheko zone south west Ethiopia. Cross- sectional study was conducted from June 1-30. Stratified sampling techniques were employed to select weredas and city administrations and convenience sampling were used to select study participants the degree of association between dependent and independent variables were assessed using odds ratio and statistically significant factors were declared at 95% of confidence level and p-value of less than 0.05. According to the study, 71.4 % and 59.1% of respondents agreed that there are high increment of price of convenience and shopping goods in market. Staying at home, keeping social distancing, transportation fee amendment and distribution had effect on the price of shopping and convenience goods. That price had a negative and statistical significant effect on distribution in bench sheko zone. Staying at home, keeping social distancing and transportation fee amendment had effect on price of convenience and shopping goods so Bench Sheko Zone trade and industry bureau better to form a committee through working with legislative body of bench sheko zone in order to control unfair practice performed by producers, distributers and retailers.
Keywords
Price, Marketing Activity, COVID-19.
Introduction
Coronavirus disease-2019 (COVID-19) is a newly emerged disease caused by a highly infectious novel coronavirus which primarily affects the respiratory system. It was first seen in the Hubei province of China in December 2019 (Vandeweerd, 2020). Coronaviruses are a family of viruses common across the world in animals and humans; certain types cause illnesses in people. For example, some coronaviruses cause the common cold; others cause diseases which are much more severe such as Middle East Respiratory Syndrome (MERS) and Severe Acute Respiratory Syndrome (SARS), both of which often lead to pneumonia (WHO, 2020).
The disease has been recognized as a global public health emergency by the World Health Organization on March 11, 2020 after cases had started to be seen outside china in less than two-month period (Grace Hauck, 2020). On March 13, 2020, The Federal Ministry of Health of Ethiopia has confirmed a COVID-19 case in Addis Ababa. The case was the first one to be reported in Ethiopia since the beginning of the outbreak in China in December 2019 (WHO, 2020). Marketing is the activity and set of processes for creating, communicating, delivering and exchanging offerings which have value for customers, clients and partners. It is defined as the process of determining the needs and wants of consumers and being able to deliver products that satisfy those needs and wants.
The disease has been recognized as a global public health emergency by the World Health Organization on March 11, 2020 after cases had started to be seen outside china in less than two-month period (Grace Hauck, 2020). On March 13, 2020, The Federal Ministry of Health of Ethiopia has confirmed a COVID-19 case in Addis Ababa. The case was the first one to be reported in Ethiopia since the beginning of the outbreak in China in December 2019 (WHO, 2020). Marketing is the activity and set of processes for creating, communicating, delivering and exchanging offerings which have value for customers, clients and partners. It is defined as the process of determining the needs and wants of consumers and being able to deliver products that satisfy those needs and wants.
Creation of superior customer value and delivering high levels of customer satisfaction are at the heart of present day marketing. Companies today, needs to understand customer needs, study completion, develop and offer superior value at reasonable price, and make the product available to customer at convenient place. Only then their products will be in demand and sell consistently (Kotler, 2012).
Statement of the Problem
The COVID-19 has reached all countries and affected many people. According to world meters updates on COVID-19 report of May 3/2020, so far about 3.43 million people are infected and 244 thousand have died from it (worldometer, 2020). The disease is rapidly spreading and infecting and killing many people.
According to the latest data by the John Hopkins University and Africa Center for Disease Control on COVID-19 in Africa, There are now more than over 42,500 confirmed cases of coronavirus across the continent, with a number of African countries imposing a range of prevention and containment measures against the spread of the pandemic and 1,759 of them died from it (Hui DS et al. 2020).
In china, among the patients infected with COVID-19, 41 % are with underlying disease, of which heart diseases (21%), is the most common, and followed by diabetes (6 %). Although much remain unknown, the most challenging features of COVID-19 include the unavailability of vaccine or curative treatment, its potential of quick transmission and the need of sophisticated medical equipment for severe case management (Lai, et al, 2019). Another bad side of this disease is its social, political and economic crisis due to the prevention measures like restriction of movements (El-Sadr WM, 2020). These challenges make the battle against COVID-19 to be more difficult in resource limited countries like Ethiopia.
As show the reports of Food and Agriculture Organization of the United Nations (FAO) is particularly concerned about the potential impacts of the virus and related containment efforts on food security and livelihoods in contexts of high vulnerability and where populations are already experiencing food crises. Experience from previous crises, particularly from the Ebola virus disease outbreak in West Africa in 2014, has indicated the significant impact of movement restrictions and disease containment efforts on food production and access, and the importance of maintaining and up scaling humanitarian food security interventions for the most vulnerable populations, alongside the health sector’s efforts to avert disease spread. In food crisis contexts, needs are already extremely high and basic service delivery is poor.
Movement restrictions necessary to contain the spread of the virus simultaneously threaten to disrupt the entire food supply chain from production to processing, packaging, transporting, marketing and consumption as well as livestock movements, which are critical for pastoralists’ survival. This would leave already vulnerable populations facing a growingreality of even further constrained access to food due to shortages, high food prices and curtailed incomes. Higher prices create or increase economic constraints which can fuel sentiments of (perceived) deprivation that in turn can lead to conflict. The impact of the price rises and consequent social effects varies between countries, depending in part on the sensitivity of local markets to global price movements as well as to the degree to which countries are dependent on food imports (FAO, 2020).
Due to COVID-19 pandemic, WHO and Ethiopian government strongly recommend peoples to stay at home and keep social distancing, this directly restrict marketing activities. Customer’s activities might be affected by distributers by using the above opportunity through holding the products in store and might not be rich to the customers as expected time. This may raise the price of goods or temporary product shortage will be existing.
Hypothesis of the Study
Hypotheses have been framed to indicate the direction in which the researcher study should proceed. In line with objectives, the following propositions have been hypothesized.
H1Transportation fee amendment has positive and significant on effects on price of convenience and shopping goods.
H2stay at home has positive and significant on effects on price of convenience and shopping goods.
H3social distance has positive and significant on effects on price of convenience and shopping goods.
Objective of the Study
To assess the effect of COVID – 19 pandemic on marketing activities specially price of Convenience and shopping Goods in Bench sheko zone, South West Ethiopia.
Literature Review
Theoretical Review
Product pricing is one of the most critical and complex issues that a firm faces. Price is the only marketing mix element that creates revenue, while all the others entail costs. This characteristic of pricing makes it a very important strategic marketing instrument. The amount of money charged for a product or service, or the sum of the values that consumers exchange for the benefits of having or using the product or service. Since pricing has a direct impact on a company's revenue, and thus profit, setting the right price is essential to a company's success Kotler, &Armstrong (2012). Price is important to marketers because it represents marketers' assessment of the value customers see in the product or service and are willing to pay for a product or service. Price is the only element that affects revenues, and thus, a business's profits. Price can lead to a firm's survival or demise. Adjusting the price has a profound impact on the marketing strategy, and depending on the price elasticity of the product, it will often affect the demand and sales as well. Both a price that is too high and one that is too low can limit growth Kotler, &Armstrong (2012). Pricing contributes to how customers perceive a product or a service. A firm that wants to indicate that it offers products of the highest quality will charge a high price. A high price indicates high quality. The term luxury comes to mind. Firms wants to position it as a low-cost provider, it will charge low prices. Just as they do with high-end providers, consumers know what to expect when they see low prices. Price is the money or other considerations (including other goods and services) exchanged for the ownership or use of a good or service. From the consumer point of view, price is used to indicate value when it is paired with the perceived quality of a product or service. Kotler, &Armstrong (2012).
Empirical Review
As ANSA, 2020 during COVID-19, a shift in consumption patterns has been noted in Italy. Markets saw an increase in purchases of both staple and long-shelf-life food and a shift towards e-commerce (Coldiretti, 2020). At the same time, there has been a reduction in the demand for fruits, horticultural and other perishable products, leading to a fall in prices (ANSA, 2020). Similarly, in China, reduced demand for vegetables, fruits, and aquatic products led to falling prices and slow sales. The poultry and egg food production chains have also faced strong downward price pressure (Luedi & Liu, 2020).
Countries that first affected by COVID-19 have put in place several policy responses to stabilize the supply of agricultural products, engage surpluses and prevent the loss of perishable products for producers. In China, events included promoting the “vegetable basket” policy alongside mechanisms to coordinate the supply and distribution of vegetables during the COVID-19 prevention and control period. The measures also included public procurement and distribution (Zhang, 2020). Also the E-commerce companies have also intensified the procurement of agricultural products to stand market demand for smallholder producers and create mechanisms to support the sales of accumulated products (Zhu & Guo, 2020).
As COVID-19 restrictions continue and evolve across the globe, economic vulnerability is growing at a rapid pace. In fragile contexts and those with weak social protection systems, people continue to rely more on their local economies for food and income than on the support of aid groups even when those economies are hamstrung by crisis. The global nature of the COVID-19 pandemic is affecting nearly everyone, albeit unevenly. Urban consumers and workers are at the forefront of impacted groups, along with those dependent on more complex and trade-dependent supply chains. Prices for staples are increasing in many locations. On the back of global and local trade restrictions, increased household stocking and Ramadan. In contrast, as purchasing power suffers, some locations are seeing price dips as consumers reduce consumption, shift to cheaper substitutes and reduce their reliance on restaurants and prepared foods. While capital-intensive sectors dependent on imports and exports are struggling, businesses with greater connections are better able to adapt. For example, agribusinesses in Nigeria are helping their vendors and aggregators access exemption permits, which exclude them from travel restrictions that could hinder their operations in Figure 1.

Figure 1: Conceptual Framework
Conceptual Framework
Research Methodology
The research approaches of this study were both quantitative and qualitative data (mixed research approach). In order to achieve the objectives of this study, the cross sectional and explanatory research designs were used for this study Explanatory research design in the relation to which data which is collected predominantly by questionnaire or by structured interview (Bryman & Bell, 2007). The Population can be defined as all people or items (unit of analysis) with the characteristics that one wishes to study (Anol B., 2012). Accordingly, this study were conducted on Bench sheko zone and the target populations for this particular study were customers and distributers of connivance and shopping Goods those are basically necessary for survival. The total sampling frame were customers, and distributers found in bench Sheko Zone.
In this study, stratified and Convenience sampling technique were used to get information from customers, and Distributers. Stratified sampling technique is preferred because it is used to assist in minimizing bias when dealing with the population. With this technique, the sampling frame was organized into relatively homogeneous groups (strata) before selecting elements in the sample.
For populations that are large Cochran (1963:75) developed the Equation 1 to yield a representative sample for proportion. Provides a simplified formula to calculate sample sizes this formula has used to the number of population size under study is large.
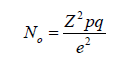
Where:
n is the sample size,
Z2is the abscissa of the normal curve cuts off an area α at the tails (1- α Equals the desired confidence level is 95%). The value of Z found in statistical tables which contain the area in the normal curve.
e is the level of precision (allowable error commonly 5% = 0.05)
p is the estimated proportion of an attribute that is present in the population
q is 1-p
Accordingly, from the total population by stratified sampling method 384 respondents were selected as a sample of Customer in Bench Sheko Zone. In addition distributors in this Zone were selected purposively for interviewee purpose.
Z = 1.96 from the z table value e = 0.05
p = 0.5
q = 0.5 =1-p
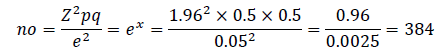
Since we are using multi stage sampling, we use design effect 2. 384*2=768.
In this study, whether a marketing activity affect by Covid 19 or not Qualitative choice models are used to compute probability of choices being made, and they attempt to relate the probability of making a particular choice to various explanatory factors (Sellar et al, 1982). Probabilities have to be between zero and one. Using linear probability model and ordinary least squares (OLS) is not preferable due to the return of probabilities outside the unit interval (Stynes and Peterson, 1984). Based on the above evidence those are provide by the aforementioned Authors the researchers were prefer Binary logistic Models.
Dummy variables have used to measure the dependent and independent variables. According to (Harry N. & Deborah A. 2012), if a researcher has designed a series of questions that when combined measure a particular trait (dimension) he/she has created a yes or no data.
The Model of equations used to answer the research objectives.
Y1 = Bo+ Bx1+Bx2+Bx3+Bx4+............................ Bxn
Y1 = price
X1 = stay at home
X2 = keeping social distance
X3 = transportation fee amendment X4 = distribution for price
Results and Discussion
Descriptive Statistical Analysis Socio Demographic Characteristic of Respondents
This section gives an analysis on the results on demographic factors of the respondents who participated in this research study in Table 1.
| Table 1 Socio Demographic Characteristic of Respondents |
|||
| Variables | Categories | Frequency | Percent |
|---|---|---|---|
| 18-27 | 266 | 35.9 | |
| 28-37 | 277 | 37.4 | |
| Age | 38-47 | 160 | 21.6 |
| >47 | 38 | 5.1 | |
| Total | 741 | 100.0 | |
| Male | 570 | 76.9 | |
| Sex | Female | 171 | 23.1 |
| Total | 741 | 100.0 | |
| Urban | 649 | 87.6 | |
| Residence | Rural | 92 | 12.4 |
| Total | 741 | 100.0 | |
| Cannot read and write | 96 | 13.0 | |
| Can read and write | 301 | 40.6 | |
| Higher class completed | 191 | 25.8 | |
| Diploma | 88 | 11.9 | |
| Educational status | |||
| Degree | 46 | 6.2 | |
| Masters | 8 | 1.1 | |
| Others | 11 | 1.5 | |
| Total | 741 | 100.0 | |
Source: spss output 2020.
As the above table shows 266 (37.9%) of the respondents were the age from 18-27,277 (37.4%) of the respondents were the age between the age 28-37, 160 (21.6%) of the respondents were the age from 38-47 while 38 (5.1%) of the respondents were the age from 47 and above. The mean age of the respondents are 31.7 with the standard deviation of 0.88 Majority of the respondent’s age was from 18-27 years old. Regarding gender of the participants, majority of the respondents who participated in the study are male 570 or (76.9%), while 171 or (23.1%) are female. Therefore this could be because male and female customers disparity in marketing activity.
In terms of residency of respondents were categorized in to two categories namely urban and rural. And also shows 87.6 percent of the respondents were living in urban while 12.4 percent of the respondents were live in rural. This shows the majority of the respondents are live in urban. Regarding educational qualification 96 (13%) of the respondents are illiterate, 301 (40.6%) of them could read and write. 191 (25.8) attended higher class, 88 (11.9%), 46 (6.2%), 8(1.1) of the respondents are Diploma, degree and masters holder respectively whereas the remaining 11 (1.5%) of the respondents in Figure 2.

Figure 2: Occupation of the Respondents
| Table 2 Bellow Questions Related with Price |
|||
| No | 532 | 71.8 | |
| Total | 741 | 100 | |
| Do you think Currently the price of Convenience Goods set by distributers and retailers are afforded by You? |
Yes | 168 | 22.7 |
| No | 573 | 77.3 | |
| Total | 741 | 100 | |
| Are you satisfied with the current pricing of shopping goods? | Yes | 155 | 20.9 |
| No | 586 | 79.1 | |
| Total | 741 | 100 | |
| Are you satisfied with the current pricing of convenience goods? | Yes | 182 | 24.6 |
| No | 559 | 75.4 | |
| Total | 741 | 100 | |
| Do you buy shopping Goods if the price is reduced Significantly? | Yes | 657 | 88.7 |
| No | 84 | 11.3 | |
| Total | 741 | 100 | |
| Does price of convenience Goods induce you to buy? | Yes | 661 | 89.2 |
| No | 80 | 10.8 | |
| Total | 741 | 100 | |
| Does the current price of shopping goods Give room for large customer base? | Yes | 164 | 22.1 |
| No | 577 | 77.9 | |
| Total | 741 | 100 | |
| Does the current price of convenience goods Give room for large customer base? | Yes | 154 | 20.8 |
| No | 587 | 79.2 | |
| Total | 741 | 100 | |
As we analyze from the above graph and figure occupation of the respondents, most of them are merchant and government employee which is 50.3 percent of the total respondents. And 17.9 and 13.1 percent of the respondents are unemployed and privet business owner respectively and 11.2 percent of the respondents are farmers and daily labor, and the remaining 7.6 are others. Its shows as majority of the respondents are merchants and governments employees Figure 2.
A total of eight questions were asked to assess whether covid 19 had effect on price or not 28.2%, and 22.7% of respondents agreed that the price of shopping and Convenience goods set by distributers and retailers are afforded by themselves respectively, 71.8 and 77.3% %of respondent did not agree with afforded price on shopping product and convenience product. This result implies most of respondents did not have ability to purchase product with current price of convenience and shopping goods or after occurrence of covid 19. Only 20.9% and 24.6% of respondents agreed the current price of shopping and convenience goods were afforded by the customer of shopping and convenience satisfied by the current pricing of shopping and convenience goods respectively. And 79.1% and 75.4% of respondents did not agree with the current price of shopping and convenience goods. This result implies that customers did not have ability to purchase the convenience and shopping product because of high price. 11.3% and 10.8% respondents were agreed to buy when the price will be reduced but 88.7% and 89.2% of respondents were not agree with this statement because of income level of the society decided to purchase or not purchase the product. And other reasons were poverty. 22.1% and 20.8% of respondents agreed with customer base opportunity and 77.9% and 79.2% of respondents did not agree with customer base opportunity related with price. This implies that current price of shopping and convenience goods did not give opportunities for customer staying at home in Table 3.
| Table 3 Convenience Goods |
||||
| Variables | Categories | Frequency | Percentage | |
|---|---|---|---|---|
| Stay at home | Due to staying at home the Price of shopping goods increased? | Yes | 684 | 92.2 |
| No | 57 | 7.8 | ||
| Total | 741 | 100 | ||
| Due to staying at home the price of convenience Goods has influence on your consumption | Yes | 671 | 90.6 | |
| No | 70 | 9.4 | ||
| Total | 741 | 100 | ||
| Due to staying at home the price of shopping Goods has influence on your consumption. | Yes | 689 | 93 | |
| No | 52 | 7 | ||
| Total | 741 | 100 | ||
| Due to staying at home the Price of | Yes | 627 | 84.6 | |
| convenience goods increased. | No | 114 | 15.4 | |
| Total | 741 | 100 | ||
The above tables shows that related with the price of convenience and shopping it shows as 84.6% and 92.2 % of the respondents responded as due to staying at home the price of convenience and shopping goods were increase respectively whereas 15.4% and 7.8% of the respondents responded the price of convenience and shopping goods were decrease due to staying at home. The final question was measure whether the price of convenience and shopping goods influence consumption of customers. As the above table shows 90.6% and 93% of the respondents agreed due to staying at home the price of convenience and shopping goods influence the consumption of the customers respectively while 9.4% and 7% of the respondents disagreed with the statements respectively in Table 4.
| Table 4 Convenience and Shopping Goods |
||||
| Variables | Categories | Frequency | Percentage | |
|---|---|---|---|---|
| Social distance | Due to social distance the price of convenience goods increased. | Yes | 633 | 85.4 |
| No | 108 | 14.6 | ||
| Total | 741 | 100 | ||
| Due to social distance Price of shopping goods increased. | Yes | 656 | 88.5 | |
| No | 85 | 11.5 | ||
| Total | 741 | 100 | ||
| Due to social distance the price of convenience Goods has influence on consumption | Yes | 642 | 86.6 | |
| No | 99 | 13.4 | ||
| Total | 741 | 100 | ||
| Due to social distance the current price of shopping Goods has influence consumption | Yes | 661 | 89.8 | |
| No | 80 | 10.2 | ||
| Total | 741 | 100 | ||
Social Distance
The above table also indicated that the price of convenience goods increased due to social distance 633 (85.4%) of respondents agreed that the price of convenience goods were increased and 108 (14.6%) respondents were not agreed price increased due to social distance. The above table also indicated that the price of shopping goods due to social distance 656 (88.5%) of respondents agreed that the price of shopping goods were increased and 85 (11.5%) of respondents were not agreed price increased due to social distance. About 642 (86.6%) of respondents were agreed the price of convenience goods has influence on their consumption and 99 (13.4%) of responds didn’t agreed. About 661 (89.8) of respondents were agreed the price of shopping goods has influence on consumption and 80 (10.2) didn’t agreed. This result indicated that covid 19 affect food storage, protection, processing, prevention, addressability, availability, price and consumption of convenience and shopping goods in Table 5.
| Table 5 Transportation Amendment |
||||
| Variables | Categories | Frequency | Percentage | |
|---|---|---|---|---|
| Transportation fee | Due to transportation fee amendment the Price of convenience goods increase | Yes | 634 | 85.6 |
| No | 107 | 14.4 | ||
| Total | 741 | 100 | ||
| Due to transportation fee amendment the Price of shopping goods increased | Yes | 669 | 90.3 | |
| No | 72 | 9.7 | ||
| Total | 741 | 100 | ||
| Due to transportation fee amendment the convenience Goods has influence on your Consumptions | Yes | 659 | 88.9 | |
| No | 82 | 11.1 | ||
| Total | 741 | 100 | ||
| Due to transportation fee amendment the shopping Goods has influence on your Consumptions | Yes | 673 | 90.8 | |
| No | 68 | 9.2 | ||
| Total | 741 | 100 | ||
Transportation Amendment
Regarding to the table effect of transportation fee amendment on the price of convenience and shopping goods 634(85.6%) of respondents are agreed that the price of convenience goods were increased and 107(14.4%) of respondents were disagreed due to transportation fee amendment price of convenience goods increased. Regarding the price of shopping goods and transportation fee amendment 669 (90.3%) of respondents are agreed that due to transportation fee amendment the price of shopping goods were increased and 72(9.7%) of respondents were disagreed due to transportation fee amendment price of shopping goods increased. Related to influence of transportation fee amendment on consumptions 659(88.9%) of respondents were agreed that transportation fee amendment influenced on their consumption and 82(11.1%) of respondents were not agreed influenced consumption of convenience goods. Related to the usage of shopping goods 673(90.8%) of respondents responded that transportation fee amendment has influence on their usage of shopping goods and 68(9.2%) of respondents were not agreed on usage of shopping goods in Table 6.
| Table 6 Omnibus Tests of Model Coefficients |
||||
| Chi-square | Df | Sig. | ||
|---|---|---|---|---|
| Step | 197.599 | 4 | 0.000 | |
| Step 1 | Block | 197.599 | 4 | 0.000 |
| Model | 197.599 | 4 | 0.000 | |
Logistic Regression Analysis
The relationship between the dependent variable price and the overall combination of the independent variables in other words predictors is tested in the Omnibus Tests of Model Coefficients table represented in Table. The model chi-square value of χ2 = 197.599, df 4, p, value .000 which is less than 0.05 tells us that our model as a whole fits significantly. So, the relationship between the combination of the independent variables and the dependent variable is verified in Table 7.
| Table 7 The Hosmer and Lemeshow Test |
|||
| Step | Chi-square | df | Sig. |
|---|---|---|---|
| 1 | 4.392 | 5 | 0.494 |
Hosmer and Lemeshow Test
The Hosmer and Lemeshow Test is a commonly used assessment of goodness of fit for logistic regression models. The true logistic regression model was fit to the data when Hosmer Lemeshow test p-value is >0.05 Allison. (2013). so, this model fulfil this test since 0.494>0.05 from the below in Table 8.
| Table 8 Variables in the Equation |
|||||||||
| B | S.E. | Wald | Df | Sig. | Exp(B) | 95% C.I.for EXP(B) | |||
|---|---|---|---|---|---|---|---|---|---|
| Lower | Upper | ||||||||
| Step 1a | Distribution | -.869 | 0.197 | 19.365 | 1 | 0.000 | 0.420 | 0.285 | 0.618 |
| Staying at home | 1.256 | 0.200 | 39.465 | 1 | 0.000 | 3.513 | 2.374 | 5.198 | |
| Social distancing | 1.041 | 0.208 | 25.039 | 1 | 0.000 | 2.831 | 1.883 | 4.257 | |
| Transportation fee amendment |
1.452 | 0.202 | 51.561 | 1 | 0.000 | 4.270 | 2.873 | 6.346 | |
| Constant | -1.142 | 0.245 | 21.645 | 1 | 0.000 | 0.319 | |||
a. Variable(s) entered on step 1: Distribution, Staying at home, Social distancing, and Transportation fee amendment.
Similarly, keeping social distancing and transportation fee amendment had effect on the price of shopping and Convenience goods (AOR [95% CI], 2.831[1.883-4.257]) and (AOR [95% CI], 4.270[2.873-6.346]) respectively. Distribution of goods negatively affect the price of shopping and convenience goods (AOR [95% CI], 0.420[0.285-0.618]).
Assuming all other factor constant distribution due to covid 19 has negative and statistically significantly effects on price during covid 19 at 5% level of significance. With an odd ratio of 0.42, implying distribution level due to covid 19 has less likely to get distribution of shopping and convenience goods from market.
The variable stay at home due to covid 19 has positive and statistically significantly relationship with price at 5% level of significance. With an odd ratio of (Exp (B)) of 3.513, this implies the people who have staying at home to wards price is 3.513 times more likely to get shopping and convenience goods with high price than those who have not follow staying at home.
The variable social distance due to covid 19 has positive and statistically significant relationship with price at 5% level of significance. With an odd ratio of (Exp (B)) of 2.831, this implies that the people who have keeping social distance towards price is 2.831 times more likely to get shopping and convenience goods with high price than those who have not keep social distance assuming all other factor constant transportation fee has positive and statistically significant relation with price at 5% level of significance. With an odd ratio of (Exp (B)) of 4.271, this indicating the increments of transportation fee amendment is 4.270 more likely to increase the price of shopping and convenience goods.
Conclusion
The result shows that negatively and statistically significant effect distribution effect on price in bench sheko zone. This implies that due to covid 19 lack of distribution has the main factors for the increments of price on shopping and convenience goods.
The result shows that positively and statistically significant effect on social distance effects on price in bench sheko zone. This implies that social distance and price has direct relationship between variable. This shows that social distance increased also price increased.’
The above finding shows has positively and statistically significant effects on stay at home and price effects on price in bench sheko zone. This implies that stay at home and price has direct relationship between variable. This shows that social distance increased also price increased.
The above finding a show has positively and statistically significant on transportation and price effects on price in bench sheko zone. This implies that transportation fee and price has direct relationship between variable. This shows that transportation fee increased also price increased.
Recommendation
- Bench Sheko Zone trade and industry bureau should form a committee through working with legislative body of bench sheko zone in order to control unfair practice performed by producers, distributers and retailers.
- Bench Sheko Zone Trade and industry bureau should set standard price for convenience goods and give a command for the producers, distributors and retailers to follow up the standard in order to safeguard the society from unfair price.
- The customers should be informing unfair activity of distributors and retailers to the committee formed by bench Sheko Zone Trade and Industry bureau in order to minimize unfair activity of the distributors and retailers.
- Trade and Industry bureau should take a corrective action on distributers and retailers those are unfairly sales product and holding the product on their warehouse to take opportunity.
Conflict of Interest
There is no conflict of interest among us we do everything accordingly without any kinds of conflict or disagreement between us
References
- A., Millen, R. & Moss, S. (2002). A comparison of the use of third-party logistics services by Australian firms between 1995 and 1999. International Journal of Physical Distribution & Logistics Management, 32 (1), pp. 59-68.
- ANSA, 2020 Coronavirus: Ortofrutta, crollo del 30% dei volumi all'ingrosso. T&G Ortofrutta. T&G Ortofrutta
- Aspinwall, L. V. (1958). The characteristics of goods theory In William, L. & Eugene, J. K. Eds Managerial marketing: Perspectives and viewpoints (pp. 633m643).Homewood, IL: Richard D. Irwin, Inc.
- Berman, B. (1996), Marketing Channels, John Wiley & Sons, New York, NY, p. 663.
- Bhatnagar, R., Sohal, A.S., & Millen, R. (1999) Third party logistics services: a Singapore perspective International Journal of Physical Distribution & Logistics Management, 29 (9), 569-87.
- Bucklin, Louis P.(1966) A Theory of Distribution Channel Structure Berkeley CA IBER Special Publications.
- Bucklin, L.P. (1965) „Postponement, Speculation and the Structure of Distribution Channels‟, Journal of Marketing Research 2 (February): 26–31
- Clifs, NJ, p. 57 6. Rosenbloom, B. (1999), Marketing Channels, 6th ed., the Dryden Press, Orlando, FL, p. 688
- Coldiretti. 2020. Coronavirus, dalla farina (+80%) al latte (+20%) nella top ten acquisti
- Cooper, J.C. (1993), Logistics Strategies for Global Businesses International Journal of Physical Distribution and Logistics Management, 23 (4), 12-23.
- De Kluyver & Pearce, (2006) Strategy a View from the Top Evidence from a sub-Sahara African nation International Journal of Logistics: Research and Applications, 7 (1), 45-57.
- Directorate UE & HP. Coronavirus : A guide to what you can expect across the UK, action plan, available at www.gov.uk/dhsc. 2020.
- Doney, P.M. and Cannon, J.P. (1997), ``An examination of the nature of trust in buyer-seller relationships‟‟, Journal of Marketing, Vol. 61 No. 2, April.
- El-Sadr WM, Justman J. Africa in the Path of Covid-19. N Engl J Med [Internet]. 2020;1– 2.
- Available from: http://www.ncbi.nlm.nih.gov/pubmed/32302075
- FAO, (2016). Impact of the Ebola virus disease outbreak on market chains and trade of agricultural products in West Africa. Dakar.
- Gaski, John F. (1996). Distribution channels: a validation study. International Journal of Physical Distribution & Logistics Management Bradford: Vol.26, Iss. 5; pg. 64.
- Grace Hauck, Karl Gelles, Veronica Bravo and MT. Coronavirus updates_ How COVID-19 unfolded in the US. 2020.
- Gichuru, M. (2012).Critical success factors in business process outsourcing of logistics companies in Kenya, Unpublished MBA Project University of Nairobi.
- Holton, R. H. (1958), "The distinction between convenience goods, shopping goods, and specialty goods". Journal of Marketing, 3 (July), pp. 53-56.
- Han, C. 2020. "Coordinate the overall promotion of epidemic prevention and control and the work of agriculture, rural areas and farmers", Qiu Shi,).
- Hui DS, Petersen E, Zumla A, Drosten C, Memish ZA, Mchugh TD, et al. The continuing 2019-nCoV epidemic threat of novel coronaviruses to global health — The latest 2019 novel coronavirus outbreak in Wuhan, China. Int J Infect Dis. 2020;264–6.
- https://www.africanews.com/2020/05/03/coronavirus-in-africa-breakdown-of-infected-virus-free-countries/, africannews. 2020
- https://www.ukessays.com/essays/marketing/the-factors-affecting-marketing-marketing- essay.php?vref