Review Article: 2022 Vol: 26 Issue: 1S
Empirical Testing of Capital Asset Pricing Model on Top 10 Companies Listed In Nse India
Palak Talwar, Shri Mata Vaishno Devi University
R. Gopinathan, Shri Mata Vaishno Devi University
Citation Information: Talwar, P., & Gopinathan, R. (2022). Empirical testing of capital asset pricing model on top 10 companies listed in nse india. Academy of Marketing Studies Journal, 26(S1), 1-10.
Abstract
This study focuses on the top ten companies listed on the National Stock Exchange of India (NSE), based on the fundamentals of market capitalization; we used the CAPM model; the Beta (Systematic Risk) role is to estimate the equity's risk and its role is to compare how far the whole equity bounces; monthly data is collected and analysed for the period starting from 1 May 2019 to 31 May 2020; the empirical findings of the individual assets returns are linearly related to their betas; the only risk that influence
Keywords
Capital Asset, NSE.
Introduction
The CAPM see that the estimated return on an asset is straightly related to systemic risk that is calculated by the asset’s beta. The CAPM thesis give details how the weighing of risk as well as expected returns help out to discover securities prices. Since the late 1940s along with the early 1950s, the foundation of the development of CAPM, and give authoritative forecasting as how to evaluate risk return relationship. Capital Asset Pricing Model is usually use in various approaches - like evaluating Cost of capital for different firms as well as estimating the operation of managed portfolios.
As the return from investment in stock market is uncertain, the risk as well as return in the stock market will be critical for investors to make the most of the return as well as diminish the risk, and therefore guard the attractiveness of investing in stock market. In 1952, Markowitz (1952), begins the portfolio hypothesis viewing investors how to make portfolios of specific investment to appropriately trade off.
CAPM develop as a mode to calculate this systematic risk. Sharpe (1964) states that the return on an individual stock, or a portfolio of stocks, should one and the similar to the cost of capital. The remaining procedure, that give you an idea about the relationship between risks an expected return. CAPM's first point is the risk-free rate–typically a 10-year government bond yield. That equity market remuneration comprises the estimated return from the market, smaller than the risk-free rate of return. That equity risk reward is accumulated by a coefficient Sharpe called it -"beta."
Review of Previous Studies
Review of Literature
Shriwastav (2017) In the relationship between expected return and risk, the CAPM has been empirically explored. He has analysed the financial statements of 15 companies that were publicly traded on the National Stock Exchange. From January 2006 until December 2010, the Period under consideration It was discovered that the CAPM does not hold the Indian equities market.
Bajpaia & Sharmab, (2015) CAPM was analysed and it was discovered that there is support for CAPM in the Indian stock market in terms of establishing a trade-off between risk and reward and supporting the efficient market hypothesis in the Indian setting.
Ratra (2017);Saji (2014) An Empirical Analysis of CAPM in the Indian Stock Market with Reference to the Indian Stock Market is presented in the current work. It is directly proportional to its Beta with respect to the Market Return in the CAPM Model based on the projected rate of return on a security. Consequently, this study tests the hypothesis that the beta of an asset is the only factor that determines its return, and that the return of an asset is linearly related to the betas of the assets, and that the only risk that influences the return is the systematic risk, which has not been established.
Basu & Chawla (2010) The risk return relationship of individual stocks traded on the National Stock Exchange that make up the Nifty Index would be evaluated, and the CAPM model would be used to determine this relationship, according to the study. The study discovered that, in addition to systematic risk, there are a variety of other factors that influence the return on investments. Sehgal (1997) found that there is not much evidence available to test the CAPM in Indian context Chaudhary (2016); Galagedera, (2007); Lintner (1965). The findings show that the CAPM does not have a great deal of explanatory power and that new models for asset pricing in India are required Shinde & Mane (2019). This study's research contradicts the model's expected return and systematic risk, which are linearly associated.
The most of study of the empirical sample of CAPM is concluded in the developed market. Even as rising countries have a lack of such empirical analyze of CAPM. In India there are particularly few works that addressed the related issue. Result of these analyses is well combined.
The selected companies, along with their Market Capitalization (in Rs Lakhs.) as well as their respective sectors and their weights are in the below Table 1.
| Table 1 Market Capitalization | ||||
| Sr. No. | Symbol | Company Name | Market Capitalizati on (In lakhs) |
Weight (%) |
| 1 | Reliance | Reliance Industries Limited | 70,603,579 | 11.84% |
| 2 | Tcs | Tata Consultancy Services Limited | 68,522,297 | 5.18% |
| 3 | Hindunilvr | Hindustan Unilever Limited | 49,758,412 | 3.68% |
| 4 | Hdfcbank | HDFC Bank Limited | 47,248,232 | 10.31% |
| 5 | Hdfc | Housing Development Finance Corporation Limited | 28,235,708 | 7.17% |
| 6 | Infy | Infosys Limited | 27,320,750 | 6.33% |
| 7 | Kotakbank | Kotak Mahindra Bank Limited | 24,786,522 | 4.10% |
| 8 | Bhartiartl | Bharti Airtel Limited | 24,053,552 | 3.09% |
| 9 | Itc | ITC Limited | 21,105,761 | 4.31% |
| 10 | Icicibank | ICICI Bank Limited | 20,954,333 | 5.37% |
| Source: NSE | ||||
The record of the selected companies that is considered in the analyses or study is mentioned in the above table.
These all selected companies are the effective securities of the stock market of India. These selected companies are (Infosys ltd.) Information Technology, Reliance Companies (Oil & Gas), Tata services ltd. (Automobile), and HDFC Bank, Kotak Bank ltd. (Finance) and many more. Month wise data are collected and analyzed for the period started from 1 May 2019 to 31 May 2020 for 1 year. All the data has collected from the Secondary source from NSE website.
According to Study, there are almost more than 1600 listed companies in NSE among that, we selected 10 companies. Every company depends on Market Capitalization which refers as (Market Cap) it is the accumulated value of the companies. The formula for the calculation of Market Capitalization is measured as: Current market value of shares of the company multiply by total outstanding company shares on the market. The Reliance ltd as well as the TCS Company (Tata Consistency Services) is two of the largest companies in India by Market Capitalization. The NIFTY 50 fers as (National Index Fifty) is a market index that is used by NSE of India based on stock market index. It covers almost 50 stocks from several sectors of the market. That is why it is called as one of the well diversified as well as versatile index. It provide weightage to the companies as well as sectors related to NSE that is the reason NIFTY 50 index is called as “Free Float Market Capitalization”.
As shown in the above table the NIFTY 50 gives a stock weightage to companies, the left side show the Name of selected Companies and on the right side the respective weightage. NIFTY 50 gives a stock weightage of 11.84% to Reliance Company, 10.31% weightage to HDFC Bank, 7.17% stock weightage to Housing Development Corp., 6.33% weightage to Infosys Ltd., 5.37% stock weightage to ICICI Bank, 5.18% weightage to TCS, 4.31% to ITC LTD., 4.10% to Kotak Bank Ltd., 3.69% to Hindustan Ltd., 3.09 stock weightage to Bharti Airtel Ltd.
The model of CAPM
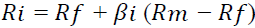
Where,  = stock return of particular company with respect to time
 = Risk-free interest rate
 = Beta of the stock measure the systematic risk
 = Market Return
In CAPM model the Beta (Systematic Risk) role is to estimate the equity’s risk (its role is to compare how far the whole equity bounces) and it can be calculated by the formula Covariance divided by Variance. Means if value of β is less than 1 it means stocks are less volatile (Aggressive) as compared to the overall risk, and if value is equal to 1 it means stock have same level of volatility as the whole market has. Moreover if value is greater than 1 it means stock is more volatility (Aggressive) as compared to overall market.
According to above table, the HDFC Bank, HDFC, as well as ICICI Bank, stock’s beta is 0.13, so it assumed to be 13% more aggressive as compared to the market. Whereas KOTAK beta is 0.12, it assumed to be 12% more aggressive as compared to market. And the rest Reliance, TCS as well as HUL stock’s beta is less than 1 means it is less aggressive (sensitive) as compared to the whole market.
On the other hand, Alpha (α) value of selected companies represents how badly a fund or stocks behave in relation to the performance of the securities in the market. The formula of calculating the value of Alpha is:
If value of Alpha (α) is positive it means it is well diversified portfolio, and if its value of (α) is negative it means it is not well diversified portfolio, and if Alpha value turn out to be zero its investment match up the benchmark index. So, according to Table 2 there are five Companies whose Alpha (α) value is negative those Companies are (RELIANCE, HDFC, HDF, TCS, and INFOSYS) the negative (-) value of α in CAPM means that it is not well-diversified portfolio or the return underperformed its benchmark index by 1% or it means that stocks has not performed good as the β would predict. On the other hand there are five more companies whose Alpha value is positive(+) those companies are (ICICI, KOTAK, HUL, ITC, and AIRTEL) there positive values means that it is well-diversified portfolio or its return outperformed its benchmark index by 1 or stock has performed good as the β would predict.
| Table 2 Capm for Top 10 Listed Companies in NSE | ||
| Company’s | CAPM_ALPHA | CAPM_BETA |
| Reliance | -0.292 | 0.087 |
| Hdfc_B | -0.293 | 0.132 |
| Hdfc | -0.293 | 0.134 |
| Tcs | -0.292 | 0.077 |
| Info | -0.292 | 0.089 |
| Icici | 0.121 | 0.137 |
| Itc | 0.154 | 0.100 |
| Kotak | 0.161 | 0.120 |
| Hul | 0.131 | 0.064 |
| Airtel | 0.065 | 0.056 |
Graphical Representation
Now here is the Graphical representation of CAPM model which shows comparison of all the selected Companies with respect to NIFTY where the (Rt) shows Rate of return and the Small thin line shows Standard Deviation of path and the Points (dots) show the clustering effect. Moreover, we calculate R2 which measures Goodness of fit that shows how well the data fit into the observation means based on observed value it make prediction.
Figure 1 shows Rt_Reliance means: Reliance Return- Rf = Excess Reliance Return.

Figure 1 RT_Reliance vs RT_Nifty
We have fitted regression line it shows positive (+) relationship between Return of Selected Companies and NIFTY 50.Whereas Rt_NIFTY means: NIFTY Return- Rf = Excess NIFTY Return, the R2 measure “Goodness of Fit” which shows that 57% of excess reliance returns is explained by Market return or NIFTY.We have fitted regression line it shows positive (+) relationship between Return of Reliance and NIFTY 50. Figure 2 Rt_HDFC Bank means: HDFC Bank Return- Rf = Excess HDFC Return, whereas Rt_NIFTY means: NIFTY Return- Rf = Excess NIFTY Return.

Figure 2 RT_HDFC Bank vs RT_Nifty
Figure 3 shows that Rt_HDFC means: HDFC Return- Rf = Excess HDFC Return, whereas Rt_NIFTY means: NIFTY Return- Rf = Excess NIFTY Return, the R2 measures that 70% of Excess HDFC Return is explained by Market Return or NIFTY. We have fitted regression line it shows positive (+) relationship between Return of HDFC and NIFTY 50. Figure 4 shows that Rt_TCS means: TCS Return- Rf = Excess TCS Return Whereas Rt_NIFTY means: NIFTY Return- Rf = Excess NIFTY Return, the R2 measures that 38% of Excess TCS Return is explained by Market Return or NIFTY. We have fitted regression line it shows positive (+) relationship between Return of TCS and NIFTY 50.

Figure 3 RT_HDFC vs RT_Nifty

Figure 4 RT_TCS vs RT_Nifty
Figure 5 Rt_INFY means: INFY Return- Rf = Excess INFY Return Whereas Rt_NIFTY

Figure 5 RT_INFY vs RT_Nifty
means: NIFTY Return- Rf = Excess NIFTY Return. Here the R2 measures that 36% of Excess INFY Return is explained by Market Return or NIFTY. We have fitted regression line it shows positive (+) relationship between Return of INFY and NIFTY 50. Figure 6 Rt_ICICI means: ICICI Return- Rf = Excess ICICI Return Whereas Rt_NIFTY means: NIFTY Return- Rf = Excess NIFTY Return, the R2 measures that 74% of Excess ICICI Return is explained by Market Return or NIFTY. We have fitted regression line it shows positive (+) relationship between Return of ICICI and NIFTY 50.

Figure 6 RT_ICICI vs RT_Nifty
Figure 7 Rt_ITC means: ITC Return- Rf = Excess ITC Return, whereas Rt_NIFTY means: NIFTY Return- Rf = Excess NIFTY Return, the R2 measures that 32% of Excess ITC Return is explained by Market Return or NIFTY.

Figure 7 RT_ITC vs RT_Nifty
We have fitted regression line it shows positive (+) relationship between Return of ITC and NIFTY 50. Figure 8 Rt_KOTAK means: KOTAK Return- Rf = Excess KOTAK Return, whereas Rt_NIFTY means: NIFTY Return- Rf = Excess NIFTY Return, the R2 measures that 63% of Excess KOTAK Return is explained by Market Return or NIFTY. We have fitted regression line it shows positive (+) relationship between Return of KOTAK and NIFTY 50 Figure 9.

Figure 8 RT_KOTAK vs RT_Nifty

Figure 9 RT_HUL vs RT_Nifty
Rt_HUL means: HUL Return- Rf = Excess HUL Return, whereas Rt_NIFTY means: NIFTY Return- Rf = Excess NIFTY Return. The R2 measures that 35% of Excess HUL Return is explained by Market Return or NIFTY. We have fitted regression line it shows positive (+) relationship between Return of HUL and NIFTY 50. Figure 10 Rt_AIRTEL means: AIRTEL Return- Rf = Excess AIRTEL Return, whereas Rt_NIFTY means: NIFTY Return- Rf = Excess NIFTY Return. The R2 measures “Goodness of Fit” which shows that 30% of Excess Airtel Return is explained by Market Return or NIFTY. We have fitted regression line it shows positive (+) relationship between Return of Airtel and NIFTY 50.

Figure 10 RT_Airtel vs RT_Nifty
Conclusion
Capital Asset Pricing Model (CAPM) is the one of the broadly used method to evaluate the stock return. It clarifies the risk return relationship and is used to understand the pricing of risky securities. The main focus is to learn how to make the highest return with the same level of risk managing portfolio risk that is based on CAPM. In this study the main aim is to know how to analyze that which stock perform overpriced and underpriced as well as who perform better as compare to the other portfolio. The result found that Capital Asset Pricing Model (CAPM) support the linear structure and it is good model for the explanation of securities return which guide the investor to take better investment decision.
References
Chaudhary, P. (2016). Testing of CAPM in Indian Context. Business Analyst, 1-18.
Markowitz, H. (1952) Portfolio Selection, The Journal of Finance, 7(1), 77-91.
Shriwastav, S. (2017) CAPM: Empirical Evidence from India. International Journal of core Engineering & Management, 3(10).