Research Article: 2025 Vol: 29 Issue: 6
Employee Performance Prediction System using Data Mining and Machine Learning
Naresh Boora, Institute of Public Enterprise, Hyderabad
S Sreenivasa Murthy, Institute of Public Enterprise, Hyderabad
Citation Information: Boora, N., & Murthy, S.S. (2025). Employee performance prediction system using data mining and machine learning. Academy of Marketing Studies Journal, 29(6), 1-24.
Abstract
Employee performance prediction plays a crucial role in managing human resources effectively and optimizing organizational outcomes. This paper proposes a novel approach that combines data mining techniques with machine learning algorithms to develop an Employee Performance Prediction System (EPPS). Additionally, a self-regularized Siberian Tiger Optimization (SSTO) algorithm is introduced as a feature selection mechanism to enhance the accuracy and efficiency of the prediction system. The EPPS utilizes historical employee data, including personal attributes, work experience, training records, and performance evaluations, to build a comprehensive performance prediction model. Various data mining techniques, such as data preprocessing, feature extraction, and feature selection, are employed to refine the dataset and extract relevant features that have a significant impact on employee performance. To further improve the accuracy of the prediction model, the self-regularized SSTO algorithm is introduced as a feature selection method. Inspired by the hunting behavior of Siberian tigers, the SSTO algorithm mimics the search and optimization process to identify the most influential features for performance prediction.
Keywords
Siberian Tiger Optimization, Data Mining, Machine Learning, Personal Attributes, Work Experience, Training Records, And Performance Evaluations.
Introduction
A crucial component of any organization's success is effective management of its human resources, and talent management is a vital component of it. Talent management is concerned with attracting, developing, and retaining talented people who can considerably improve the performance of the organization both now and in the future (Pham et al., 2020). Managing talent involves a wide range of activities, such as human resource planning, hiring talent, managing performance, advancing a career, and succession planning. Human resource planning is predicting the organization's future demands on human resources and creating plans to meet those requirements. Identifying talent is the process of acquiring it, attracting, and hiring the most qualified candidates for a job (Stone & Deadrick, 2015). It involves developing job descriptions and specifications, sourcing candidates, screening and interviewing candidates, and making job offers. The process of establishing performance standards, giving feedback, and assessing employee performance is known as performance management. It entails creating performance expectations, carrying out performance reviews, and giving staff members constructive criticism and coaching to help them perform better (Milliman & Clair, 2017).
The process of giving personnel opportunity to enhance their careers inside the organization while developing their talents (Aguinis & Burgi-Tian, 2021). It involves providing mentorship and coaching, employment rotations, and assignments, as well as training and development programmers. The process of identifying and training staff members who have the potential to hold important leadership positions within the company is called planning for succession (Barton, 2019). It entails locating critical positions, cultivating talent pools, and establishing development strategies for high-potential personnel. Effective talent management requires the HR professional's attention and the involvement of managers at all levels of the organization. It is a continuous process that requires ongoing monitoring, evaluation, and adjustment to ensure that the organization is attracting, developing, and retaining the most talented employees (Ustundag, A et al., 2018). Having a highly qualified and motivated workforce that can adjust to shifting business conditions and propel the organization's growth can give organizations that manage their employees well a competitive advantage (Kontoghiorghes, 2016).
In the KDD method, the extraction of patterns from the data is the focus of the data mining step (Gullo, 2015). Currently, some researchers are focused on tackling HRM issues using the use of machine learning and data mining (Fernandez et al., 2015). The majority of machine learning and data mining research in the field of HR issues is, in general, concentrate on the work of staff selection, and only a small number of studies apply to other tasks like planning, training, talent administration, and so forth (Martin-Rios et al., 2017) (Jia et al., 2018). HR management has recently sought a strategic role by turning to data mining and machine learning technologies due to new demands and enhanced visibility. Finding the patterns related to the talent will enable you to achieve this (Wang et al., 2018) (Helbing, 2018) To create the patterns, the main methods of data mining and machine learning can be utilized. In order to establish the appropriate Data Mining methodologies, it is crucial to match the challenges with data mining with the requirements for talent management (Helbing, 2018) (Tomasevic et al., 2020).
The following is how the paper is set up: Using recent studies, Section 2 outlines the literature review. A comprehensive discussion of the proposed approach is given in Section 3. Section 4 looked at the findings acquired in the proposed system and compared the results to existing techniques, and Section 5 concludes the paper.
Literature Review
In (Li, C., Naz, 2022) investigated high-performance work systems' (HPWS) effects on employee performance on the mediating function of mediators in this connection. A questionnaire served as the study's tool, and it was quantitative in nature. Using a stratified selection technique, 250 respondents from Pakistan's private textile industry in Lahore and Faisalabad were chosen. For statistical analysis and to test the proposed study model, partial least squares structural equation modelling was used Inagawa, (2025).
In (Baik et al, 2019) proposed the importance of the Techniques for human resource management using the High-Performance Work System (HPWS), as well as the supplementary effects of external factors like industry complexity and dynamism as factors influencing a worker's capacity to provide services. HPWS is positively linked with employees' ability to provide services, longitudinal data from 217 enterprises across 718 firm-years show that this link is more pronounced when ecological dynamism or environmental complexity is higher Karacay, (2017).
In (Amjad et al, 2021) investigated the guiding principles of improving "organizational sustainability" (OS). Study organizes the existing based on strategic choice theory and the attribution model, there is literature that shows that green human resource management (GHRM) practices are essential for environmental management and organizational sustainability. This study investigates how GHRM practices, such as training and development, performance evaluation, reward and compensation, and organizational sustainability, affect organizational sustainability through the mediation impacts of environmental performance and employee performance Li et al., (2019).
In (Lather et al., 2019) proposed in evaluate and project employee performance in an organization based on a range of factors, such as, individual characteristics, domain-specific characteristics, kind and amount of schooling, socioeconomic status, and a range of psychological factors, among others. The supervised learning approaches employed in this study to take these factors into account and provide insights into employee productivity and commitment are Naive Bayes, Logistic Regression, Neural Networks, Support Vector Machines, and Random Forest Singh & Khuteja, (2024).
In (Shankar et al., 2018) analyzed the data on to identify the common reasons for turnover, current and past employees should be consulted. To reduce employee attrition, they applied well-known classification techniques to human resource data, among them are Decision Tree, Logistic Regression, SVM, KNN, Random Forest, and Naive Bayes. To prevent staff attrition, we apply the feature selection approach to the data and analyses the outcomes.
In (Waeyenberg et al., 2018) predicted effectiveness of implementing performance management will depend on three factors. Prior to performing the performance management duties, line managers should be competent of doing so. The second prerequisite is that they must be driven to do their responsibilities. Thirdly, line managers should have plenty of time to do their jobs in addition to the expectations from other organizational units. They may encounter role conflict if they don't. Multiple cross level hypotheses were established.
In (Tomczak et al., 2018) proposed the employee conduct, including incivility, productivity, and utilization of business time. EPM systems gather objective, in-the-moment data that can be employed for many different things, such as wellness programmers and staff safety, training and development, and tracking of logistics. Even while EPM has advantages for organizations, these systems can negatively impact employee behavior, organizational commitment, perceptions of justice, and employee satisfaction. The introduction of these technologies, while taking into account employee attitudes and perceptions of privacy, can reduce these negatives, according to study.
In (Cai et al., 2018) proposed the accounting for the complete underlying social networks for employees have a multiplex structure. We gather three datasets from three organizations, each consisting of five different employee connection categories, and we use them to forecast employee performance using degree centrality and eigenvector centrality in a superimposed multiplex network (SMN) and an unfolded multiplex network (UMN). In order to show how the various connection categories are intertwined and how their effects on employee performance vary, we employ a regression analysis and a study of the quadratic assignment process (QAP), we employ a regression analysis and a study of the quadratic assignment process (QAP).
In (Pahmi et al., 2018) a method of quantitative study that entails gathering data of several kinds, including nominal, continuous, categorical, and ordinal. The study, which is focused on workers at businesses in Sukuma, Indonesia, has 15 independent variables and one dependent variable. The sample size includes 120 employees, chosen using random sampling. The data collection methods include questionnaires, interviews, and documentation. To analyze the data, the study uses the CART algorithm, which is suitable for handling multiple types of data.
In (Kamatkar et al., 2018) proposed the data mining classification techniques are used in the Knowledge Discovery in Databases (KDD) process to categorize large datasets into various groups, such as Disability and Employee Performance. Specifically, the paper examined the application of the Using the classifier model from the WEKA data mining tools with an employee's age and hire date, started working there, and their years of experience. By analyzing these factors, the study aims to provide insight into employee work-cycles and identify performance patterns among both disabled and non-disabled employees. Management can then utilize this data to make wise decisions about worker efficiency and effectiveness Van Waeyenberg & Decramer, (2018) Table 1.
| Table 1 Problem Statement | |||
| Year & Author & Citation | Aim | Methodology | Limitation |
| (Li et al., 2022) | An investigation was made into the relationship among an atmosphere of high-performance work and workers' performance. | Quantitative analysis | It can be challenging to generalize findings from one organization |
| (Baik et al., 2019) | A high-performance work system's internal ecosystem and employees' ability to provide services to customers are intertwined. | High Performance Work System | Employees may feel overworked and underappreciated |
| (Amjad et al.,2020) | Examined was the effect of green management of human resources procedures on an organization's sustainability. | Green Human Resource Management | May be more expensive to implement or may not generate immediate financial returns |
| (Lather et al.,2019) | Forecasting employee performance through the application of machine learning techniques. | Supervised learning techniques | The model is incomplete or inaccurate, the model's predictions may also be inaccurate |
| (Shankar et al., 2018) | Anticipating employee attrition through the utilization of data mining | Decision tree, Logistic Regression, SVM, KNN, Random Forest, Naive bayes methods |
The quality of the data can restrict how accurate data mining models are. |
| (Waeyenberg et al., 2018) | The application of line managers' AMO to effectively manage employee performance | Hierarchical linear modelling |
May not fully capture the complexity of employees' work and contributions |
| (Tomczak et al.,2019) | Evidence-driven suggestions for monitoring employee performance | Electronic Performance Monitoring | Performance metrics may not capture the full range of an employee's contributions |
| (Cai et al.,2017) | Using multiplex network analysis, examine how well employees perform and how they interact with one another. | Superimposed multiplex network, Unfolded multiplex network |
It difficult for organizations to implement this type of analysis on their own |
| (Pahmi et al., 2018) | utilizing the CART algorithm to find the elements that affect employee performance. | Classification and Regression Trees | May be many potential factors that impact employee performance |
| (Kamatkar., et al., 2018) | Employing data mining's classification technique to enhance an employee management system | Employee Management System, Knowledge Discovery in Databases | May not capture the full range of factors that impact employee performance or retention. |
Proposed Methodology
The proposed overrun segmentation model comprises four phases. In the Data Collection phase, relevant data pertaining to cancer images is gathered from various sources. The Preprocessing phase involves the application of techniques such as noise removal, image enhancement, and normalization to ensure the data is in a suitable format for analysis. In the Feature Extraction and Feature Selection phase, meaningful features are extracted from the preprocessed data, and a subset of relevant features is chosen to reduce dimensionality and enhance prediction accuracy Figure 1.

Figure 1 Overall Architectural Diagram
Data Collection
The employee performance prediction dataset is an open-source dataset that provides information on employee productivity in the garment industry. The dataset is structured based on day and quarter and is intended to assist organizations in forecasting employee performance. By analyzing the data, businesses can discover patterns and trends in employee productivity and leverage that information to enhance their operations. The dataset is a valuable asset for companies that aim to streamline their workforce and improve productivity. This data can aid businesses in making informed decisions about employee management, identifying potential areas of improvement, and optimizing processes to maximize efficiency. Data set were taken in (https://www.kaggle.com/datasets/gauravduttakiit/employee-performance-prediction, 2023).
Preprocessing
In the Employee Performance Prediction step, the dataset undergoes preprocessing to ensure its quality and enhance the performance of the prediction model. Data cleaning involves removing any inconsistent or irrelevant data points, handling missing values, and resolving any inconsistencies in the dataset. Data augmentation techniques are employed to generate additional training samples, increasing the diversity and size of the dataset. Standardization is performed to transform the data into a common scale, removing any variations in the range of values. Normalization is applied to scale the data between 0 and 1, ensuring that each feature has equal importance during model training. These preprocessing steps ensure that the dataset is suitable for analysis and maximize the accuracy and effectiveness of the employee performance prediction model.
Data cleaning
In the raw data, there were certain cases that didn't fit. This was necessary in order to get rid of errors and anomalies. The data was created into Excel sheets. Following that, the several data kinds were evaluated and modified. Data cleaning and missing value filling were done prior to the application of feature selection to the a more targeted relevant subset of the essential qualities for the classification exercise. dataset in order to discover the key characteristics. The model was created using the WEKA Data Mining toolbox, which is compatible with the arff format that was prepared and converted from these data. Three distinct data sets were produced using the information.
Standardization
Standardization refers to the process of transforming data to have a common scale or range. In the context of an Employee Performance Prediction System, standardization can be used to prepare the input data for analysis and modeling. For example, suppose the input data includes various performance metrics such as the number of sales made, the number of customer complaints received, and the number of projects completed. These metrics might be measured on different scales, making it difficult to compare and analyze them together. Standardization can be used to transform these metrics to a common scale, like z-scores, which show the number of standard deviations from the mean value.
By standardizing the input data, it becomes easier to identify patterns and relationships between the different performance metrics. This can help in building more accurate and effective models for predicting employee performance. Standardization can also improve the interpretability of the models by making the coefficients and feature importance measures more comparable across different variables.
Normalization
The normalization process involves changing the raw data's scale or transformation so that each feature makes an equal contribution. It deals with the issue of outliers and dominating features, two data issues that hinder the learning capabilities of machine learning algorithms. In order to normalize the data within a certain range using statistical measures from the raw (unnormalized) data, numerous methods have been presented. Take into account a dataset with f features and N instances, where x denotes the data that will be learned by the learning process and y denotes the associated class label. In this study, multiple normalization techniques are taken into account to examine how they affect classification performance. These techniques are divided into groups based on how the raw data is normalized using specific statistical properties of the data.
Feature extraction
Mean is the average value of a dataset, while median represents the middle value and is less influenced by outliers. Kurtosis measures the shape of a distribution, and variance quantifies the spread of data points from the mean. Adaptive Weighted Principal Component Analysis (AWPCA) combines PCA with adaptive weighting to extract relevant information and reduce dimensionality. Adaptive Weighted Linear Discriminative Analysis (AWLDA) enhances class separation in classification using adaptive weighting. Information Gain is a feature selection measure that identifies informative features by measuring the reduction in uncertainty.
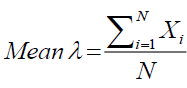
Mean
In Equation 1, the mean, a statistical metric that shows the average value of a bunch of integers, is expressed. It is calculated by adding up all of the set's values and dividing the result by the total number of values. Because it is sensitive to all values in the set and is simple to compare across different sets of numbers, the mean is a valuable indicator of central tendency. Outliers or extremely high or low values in the set, however, might distort the mean and impact the outcome. In these circumstances, other central tendency metrics, like the median or mode, may be more appropriate.
 (1)
(1)
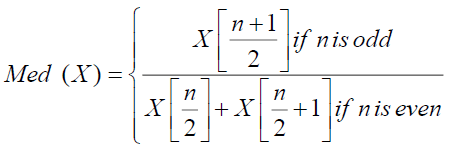
Median
When a dataset is arranged from least to greatest, the median statistical measure (shown in Eq. 2) reflects the midpoint of the range of values. It is distinct from the dataset's mean, which is the arithmetic average of all of the values. The median is useful when the dataset contains outliers or extreme values that can distort the mean. By arranging the data points in order and then figuring out the median, the middle value may be discovered. The median value occurs when there are precisely two middle values among an even number of data points. The median is commonly used in various fields, including statistics, economics, and finance, to describe the central tendency of a dataset.
 (2)
(2)
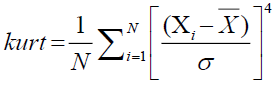
Kurtosis
Kurtosis is a statistical measure (shown in Eq.3) that gauges how peaked or flat the distribution's tails are to describe a distribution's form. Positive kurtosis causes a distribution to have heavier tails and a more peaked center than a normal distribution, whereas negative kurtosis causes a distribution to have lighter tails and a flatter center. A distribution with zero kurtosis has the same shape as a normal distribution. Kurtosis is an important measure in statistical analysis, due to the fact that it divulges details concerning outliers and the suitability of various statistical tests and models. High kurtosis can indicate that a distribution has extreme values or outliers that can affect the validity of statistical analyses, while low kurtosis can indicate that a distribution has insufficient variability to accurately represent the underlying data.
 (3)
(3)
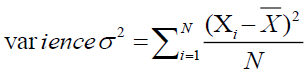
Variance
An indicator of how widely apart or variable a group of data points are from the mean or average value is called variance. It is calculated by averaging the squared departures from the mean of each data point. Data points with a high variation are further away from the mean, whereas those with a low variance are located closer to the mean. Variance is a useful measure of variability in data analysis and can help in making decisions about statistical inference, hypothesis testing, and modeling. To analyses and compare data sets, it is frequently used in the fields of social science, engineering, and business fields (shown in Eq.(4)).
 (4)
(4)
Principal component analysis
Principal component analysis (PCA), a popular multivariate technique, separates a set of associated variables into a set of main components, which are linearly uncorrelated variables. The dataset's initial main components in this conversion hold the most data, on average. A high-dimensional dataset can be turned into a lower-dimensional dataset in PCA applications by using just the first few principal components, decreasing the updated data's dimensionality as a result. The majority of the information in the data is concentrated in a limited number of coordinates, and little information is carried in the other coordinates, according to a new coordinate system discovered using PCA. To put it simply, an orthonormal basis will be discovered by PCA as the new base.
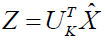
Assume U is the new orthonormal basis, each column of U is a unit vector in one dimension, and we want to maintain the system's K coordinates. If we take it to be the first K component. If we take it to be the first K component, keep generality in mind. The new base  the fresh base
  is an orthonormal basis. The data matrix is expressed as sub-matrix made up of the first K columns of
 (5)
(5)
Then
 (6)
(6)
Its mean
and
In order to retain the majority of the data and replace  with a matrix regardless of the data point, PCA seeks to identify the orthonormal matrix . By using a matrix with the identical values in all of its columns, we will specifically approximate
  . We shall approximate
  with
with  a row vector with all elements equal to 1, if this column is b and it serves as the bias. Let's say that in order to find EQUATION, we must find b satisfied:
 (7)
(7)
When utilizing the objective function's b as a guide, which is 0, we can solve the derivative problem as follows:
 (8)
(8)
Were,  and
and  where for each column in X, is the means vector
Using the data we have, we can roughly estimate
 (9)
(9)
Finding orthonormal matrix U using PCA is challenging, making approximation the best option. Suppose the means vector x is constant  . Then,
The ideal PCA issue will develop into
 (10)
(10)
Satisfied 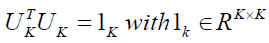 is required to ensure that the United Kingdom is based on an orthonormal basis, and that it is the unit matrix in K-dimensional space.
The procedure
The PCA algorithm looks something like this:
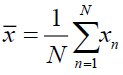
Step 1: Figure out what each data set's mean vector is.
Step 2: Subtract each data point from the means vector for all the data 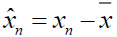
Step 3:  the data matrix is orthonormal. We have a matrix of covariance
 (11)
(11)
Step 4: The eigenvalues and eigenvectors of the covariance matrix should be calculated, and they should be arranged in decreasing order of eigenvalues.
Step 5: Create an orthogonal system is created by the UK matrix with columns by choosing the K eigenvectors that correspond to the K biggest eigenvalues. The orthonormal data matrix forms a subspace that is formed by these K vectors, also referred to as the primary components.
Step 6: Making In step six, an orthonormal data matrix projection to the specified subspace is made.
Step 7: The updated information is represented by the coordinates of the data points in the updated space.
The following method can be used to approximate the original data using the new data:
 (12)
(12)
Adaptive weighted Linear discriminative analysis
Class pairs in the chosen subspace with modest KL divergences have a tendency to converge, which could lead to poor classification results. To emphasize nearby class pairs, we first introduce a novel methodology in this section. The proposed problem will then be solved using an effective algorithm that will also have its theoretical analysis presented.
Problem Formulation
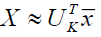
The Fisher criterion is been changed to focus more on class pairs with low divergence. In contrast to FLDA, This applies an adaptive weight to each class pair in this case, using the weighted arithmetic mean of the KL divergences. Weight  by minimizing the weighted summation function.
 (13)
(13)
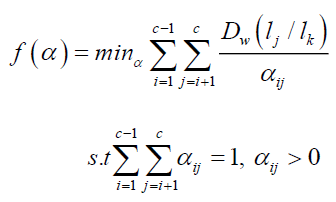
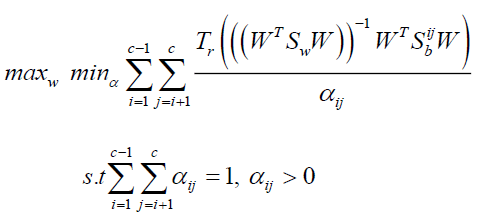
Observing the weight tends to increase as the KL divergence related to it grows, this significantly reduces the dominance of class pairs with large KL divergence. Each between-class pair's weights are assigned after that. By maximizing the  specified in Eq. (13), the projection matrix is produced, moreover, the following is the objective formulation:
 (14)
(14)
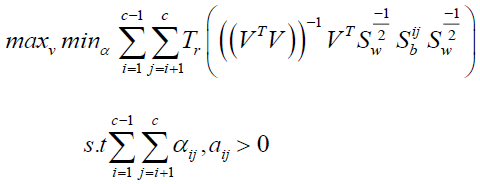
Problem (14) can be recast as if homoscedastic assumption is made
 (15)
(15)
Problem (15) is roughly equivalent to conventional FLDA when all of the elements of equal 1. using the next form
 (16)
(16)
An orthogonal constraint strategy can also be used to rewrite the issue (16), as shown below:
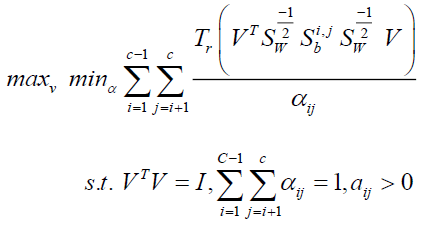 (17)
(17)
The ideal solution of (17) is generated as  V when the optimal solution
  is discovered.
According to the outer maximization's goal function, non-smooth because, as can be shown in problem (17), the interior minimizing is over discrete variables, which are rather than being preset, learned from the low-dimensional feature space data. Fortunately, an efficient iterative calculation may be used to determine this problem's optimal solution (Baik, K, et al., 2019). The detailed presentation of the optimization process will be made in the following subsection.
Information gain
In more detail, information gain is a statistical measure that quantifies the reduction in uncertainty of the target variable that can be achieved by using a particular feature or attribute to split the data. The target variable in an Employee Performance Prediction System may be a measure of employee performance, such as productivity, customer satisfaction, or revenue generated.
The amount of unpredictability or uncertainty in a set of data is measured by the term "entropy." In the context of an Employee Performance Prediction System, entropy can be used to measure the degree of uncertainty in the target variable, which represents the variability or unpredictability of employee performance. To calculate information gain, For the full dataset, the entropy of the desired variable is first determined. The target variable's entropy is then determined for each subset after the dataset is divided according to each feature. The information gain is then determined by comparing the target variable's entropy before and after the data were divided depending on each characteristic.
Features that result in a higher reduction in entropy, or a higher information gain, are considered should be more accurate and instructive for forecasting worker performance. These features can then be used to build more accurate and effective models for predicting employee performance, which can improve decision making in areas such as employee training, performance evaluation, and career development. Information gain is a valuable measure for identifying the most relevant features in an Employee Performance Prediction System and building more accurate models for predicting employee performance.
Feature Selection
The Self-Regularized Siberian Tiger Optimization (SRSTO) is a proposed algorithm for feature selection. Inspired by the hunting behavior of Siberian tigers, SRSTO aims to identify the most influential features in a dataset by iteratively selecting and updating them based on their performance. This self-regularization mechanism helps to improve the robustness and efficiency of feature selection in various applications.
Siberian Tiger Optimization
This section introduces the STO method that is suggested, followed by a mathematical modelling of how it would be implemented.
Inspiration of STO
A member of the "Panthera Tigris" genus, the Siberian or Amur tiger lives in northeast China, north Korea, and the far east of Russia. Based on where they can be found, the Siberian tiger has been referred to by a variety of names, including "Amur tiger," "Ussuri an tiger," "Korean tiger," and "Manchurian tiger." Rusty-yellow or reddish-rust in color, the Siberian tiger has distinct white and black stripes on its body. This species has a minimum body length of 150 cm, a skull length of 25 cm, a zygomatic breadth of 18 cm, and teeth that are at least 26 mm in size. The Siberian tiger can stand on its hind legs thanks to its flexible body. This tiger's weight ranges from 100 to 167 kg for females and from 180 and 306 kg for males Figure 2.

Figure 2 Siberian Tiger Picture Retrieved from Wikimedia Commons' free Media Repository
Mathematical Modelling
Based on this animal's natural behaviors, two distinct phases are used to simulate the procedure for updating the STO's location of Siberian tigers.
Initialization
Through an iterative process, the suggested STO can use the population's collective searching abilities to provide a workable solution to the issue. The Siberian tigers that make up the STO population move across the search space in search of better answers. Every single Siberian tiger belongs to those who use STO. It describes a possible solution to the problem as a result. The variables' values are represented by the problem's location in the search space. This means that the Siberian tiger population may be statistically represented as a matrix and that every individual Siberian tiger can be mathematically represented as a vector, as illustrated in (18).
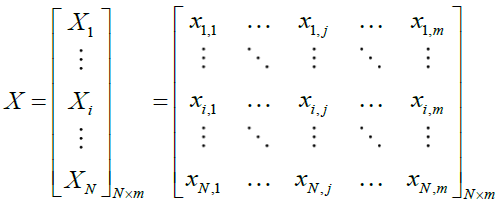 (18)
(18)
 is the
  Siberian tiger (a possible answer),
  is the total number of Siberian tigers, and is the population matrix representing the locations of Siberian tigers.
At the start of STO implementation, Siberian tigers are randomly placed in the search space utilizing (19).
 (19)
(19)
where  are random values in the range [0,1],
  is the search space's jth dimension of (the problem variable), m is the total number of problem variables, and
  and
and  and
and  stand for the
  problem variable's lower and upper bounds, respectively.
The values of the problem's variables depend, as was already established, on where each Siberian tiger is located in the search space. Consequently, a value of the problem's objective function can be evaluated and assigned to each Siberian tiger. Using a vector referred known as the objective function vector, the set of determined values corresponding to the objective function can be shown, as stated in (20).
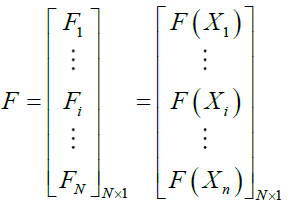 (20)
(20)
 is the vector of objective function values, and
  is the calculated objective function value for the
  Siberian tiger.
Information about the caliber of these potential solutions is significantly revealed by the outcomes of the objective function. The most outstanding participant  (the best candidate solution) is determined the highest value that the objective function might have allowed for. Since the goal function's values are updated during each iteration of the procedure, the best member must also be updated during each iteration by comparing its value to the updated values.
Phase 1: Prey Hunting
Strong hunters who take on a range of prey, Siberian tigers. The initial round of STO updates is therefore based on a simulation of the hunting strategies used by Siberian tigers. The Siberian tiger will pick its prey, attack it, and then hunt it down until it dies. As a result, there are two steps in the simulation of the prey hunting phase.
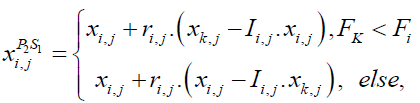
The first phase involves updating the population's members' positions based on the prey's selection and attack. During this step, the positions of the STO members vary dramatically and abruptly, which enhances the algorithm's ability to search globally and explore the search space with precision. The suggested prey places for each Siberian tiger are selected using the STO design from other population members that have greater objective function values than that specific individual. In the collection in (21) are the locations of these hypothetical prey.
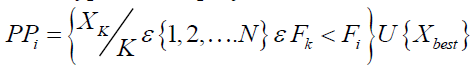 (21)
(21)
Where is the number of STO participants overall., while X beat stands for the most qualified candidate (best STO member). Then, the population's Siberian tiger will select one participant; from this point forward, we'll refer to that participant as that member) at random from this set  , and its new position will be determined based on the simulation of the attack on the prey carried out using (22).
 (22)
(22)
Where  is the dimension of
 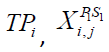 is the new position of the ith member according to the first stage of the first phase of STO,
  is its jth dimension, m is the number of problem variables, are random numbers in the range [0,1], and
  are random numbers from the set [1,2]. If the new calculated location raises the value of the objective function, it is allowed when updating STO members. Implementing this procedure is modelled (23).
 (23)
(23)
where  is the value for the member's function of objectiveness.
  at position
  .
.
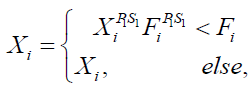
The second stage involves updating the population members' positions in accordance with the chase method. The Siberian tiger moves about while attacking the prey during this phase. The algorithm's capacity for local search and exploitation is improved through this process, leading to better results. First, utilizing (24), Close to the scene of the attack, a new location for the Siberian tiger is found. This new position will be used to replicate the chase process. The newly calculated position of the relevant member then replaces the previous position in accordance with (25) if the objective function's value is increased.
 (24)
(24)
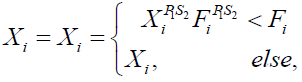 (25)
(25)
where FP1S2i is the objective function value,  is the new role of the Siberian tiger based on the second phase of the STO's initial phase, is its
  dimension, is a random number in the range [0,1], and t is the algorithm's iteration counter
Phase 2: Fighting with a Bear
Siberian tigers are known to engage in combat black and brown bears in order to defend their lives and settle differences over prey, according to observations of their natural environment. Because of this, STO members are updated during the subsequent phase. using a simulation of the Siberian tigers' bear-fighting tactics. The Siberian tiger ambushes the bear before striking it in this fight. The fights between these two creatures will rage on the battlefield for the rest of this battle until the Siberian tiger slays the bear. As a result, the attack and conflict phases of the Siberian tiger and bear's battle strategy are both represented.
The other people in the population were present in the initial phase. are considered as the group of bears to represent the bear attack Siberian tiger. The assaulted bear's position (designated as k) is chosen at random from this group of potential bears. Because of this period, the position of STO members could alter significantly and abruptly which could improve the ability of the suggested method to conduct global search and exploration. So, using (26), a new location is first determined regarding the ith member of STO, where  . This is done in order to emulate the aforementioned ideas.
 (26)
(26)
where  is a bear location's jth dimension,
  is the ith member's new position based on the 2nd phase of STO, is its jth dimension, is a random number in the range [0,1], and is a random number from the set '1,2'. Then, in accordance with (27), if the value of the goal function is increased, the related member's previous location is replaced by this newly determined position.
 (27)
(27)
where  is the bear's (the member of STO) Value-added objective function and is the
  objective function value.
The second stage involves updating based on simulations of issues connected to battle, the positions of the population members. This behavior alters population members' positions slightly, which enhances STO's local search and exploitation capabilities. In order to simulate this behavior, (28) is first used to compute a random position close to the scene of the conflict.
Hear the random values  , hear we change the random values in
If random value <0.5
If random value >0.5
 (28)
(28)
 Where t is the algorithm's iteration counter,
  , is the Siberian tiger's new position based on the second stage of the second phase of STO, and
  is its th dimension.
The update process will accept the new location if the goal function's value improves in line with (29).
 (29)
(29)
Prediction
The proposed model incorporates Pyramid Feature Learning to enhance the learning of high-order features. It achieves this by creating three distinct convolutional models, each employing different feature learning and pooling operations. Additionally, the model introduces multi-kernel with adaptive batch normalization for improved performance. Adaptive activation functions are also introduced to enhance convergence. Finally, the prediction is conducted using an Optimized GRU (Gated Recurrent Unit) model. This comprehensive approach aims to enhance the model's ability to learn complex features, optimize performance, and improve prediction accuracy.
Pyramid CNN for feature learning
The main idea behind a Pyramid CNN is to process an input image at multiple scales or resolutions, allowing the network to capture both fine-grained details and global context information. This is achieved by constructing a pyramid of image representations, where each level of the pyramid corresponds to a different scale are shown in Figure 3.

Figure 3 Pyramid CNN
Here's a general overview of how a Pyramid CNN for feature learning works:
• Image Pyramid Generation: The input image is initially resized to the desired resolution. Then, a series of down-sampling operations are applied to generate a set of images at different scales. Each down-sampling step reduces the resolution by a factor, typically using techniques like max pooling or stride convolutions.
• Feature Extraction: At each level of the image pyramid, a separate CNN sub-network is employed to extract features from the corresponding image representation. These sub-networks usually share the same architecture and weights but operate at different scales. The sub-networks can be traditional CNNs or more advanced architectures like ResNet or VGG.
• Feature Fusion: The features extracted from each level of the pyramid are combined to form a unified representation that captures both local and global context. This fusion process can be performed in various ways, such as concatenation, element-wise summation, or weighted averaging.
• Classification or Further Processing: The fused features are then used as input for subsequent layers in the network, which can include fully connected layers, additional convolutional layers, or other task-specific modules. This part of the network is responsible for making predictions or performing further processing based on the learned features.
The key advantage of a Pyramid CNN is its ability to capture features at different scales, which helps in handling objects of various sizes in an image. By considering multiple resolutions, the network can detect small details as well as grasp the overall context of the scene, leading to improved performance in tasks like object recognition or semantic segmentation.
Optimized GRU
An optimized GRU (Gated Recurrent Unit) refers to a variation of the GRU architecture that incorporates modifications to improve its efficiency, performance, or capabilities. The GRU is a kind of recurrent neural network (RNN) that's popular for simulating sequential information and has been particularly effective in natural language processing tasks like language generation and machine translation.
Here are some key optimizations commonly employed in an optimized GRU:
• CuDNN implementation: NVIDIA created the deep neural network-specific GPU-accelerated library CuDNN. enhanced GRU implementations often utilize CuDNN to take advantage of GPU parallelization and optimize the computations performed during GRU operations. This can significantly speed up training and inference times.
• Recurrence unrolling: In standard RNNs, including GRUs, the recurrent connections are typically processed sequentially, which limits parallelization and can lead to slower training. Optimized GRUs can utilize techniques like recurrence unrolling, where the recurrent connections are unfolded over multiple time steps in advance. This allows for more parallel computations, resulting in faster training and improved performance.
• Parameter sharing: GRUs have several sets of learnable parameters, including update gates, reset gates, and candidate outputs. Optimized GRUs may employ parameter sharing strategies to decrease the total number of parameters, resulting in a more compact and effective model. Parameter tying or weight sharing techniques can be used to reuse the same set of weights across different parts of the GRU, leading to reduced memory footprint and potentially better generalization.
• Dropout and regularization: Dropout are a regularization technique commonly used in neural networks to prevent overfitting. It randomly sets a fraction of the input or hidden units to zero during training. Optimized GRUs may incorporate dropout layers at appropriate locations within the network to regularize the learning process and improve generalization performance.
• Initialization strategies: Proper initialization of the GRU's weights can greatly influence the model's performance training dynamics and convergence. Optimized GRUs may employ specific weight initialization strategies, such as the Xavier or He initialization, to ensure stable and efficient learning.
• Gradient clipping: Using a technique called gradient clipping, training can avoid gradients that explode. It involves scaling down the gradients if they exceed a predefined threshold. Optimized GRUs may incorporate gradient clipping to stabilize the training process and prevent numerical instability.
Result
Data collection
The dataset is a valuable asset for companies that aim to streamline their workforce and improve productivity. This data can aid businesses in making informed decisions about employee management, identifying potential areas of improvement, and optimizing processes to maximize efficiency. Data set were taken in (https://www.kaggle.com/datasets/gauravduttakiit/employee-performance-prediction) Table 2.
| Table 2 Summarized Evaluation Metrics for Different Models | |||||
| STO | WSO | MOA | RSO | PROPOSED | |
| Accuracy | 0.950838 | 0.856983 | 0.903911 | 0.939665 | 0.97095 |
| Precision | 0.877095 | 0.642458 | 0.759777 | 0.849162 | 0.927374 |
| Sensitivity | 0.877095 | 0.642458 | 0.759777 | 0.849162 | 0.927374 |
| Specificity | 0.969274 | 0.910615 | 0.939944 | 0.962291 | 0.981844 |
| FMeasure | 0.877095 | 0.642458 | 0.759777 | 0.849162 | 0.927374 |
| MCC | 0.846369 | 0.553073 | 0.699721 | 0.811453 | 0.909218 |
| NPV | 0.969274 | 0.910615 | 0.939944 | 0.962291 | 0.981844 |
| FPR | 0.030726 | 0.089385 | 0.060056 | 0.037709 | 0.018156 |
| FNR | 0.122905 | 0.357542 | 0.240223 | 0.150838 | 0.072626 |
Accuracy
In terms of accuracy, the models performed as follows: STO achieved an accuracy of 95.08%, WSO achieved 85.70%, MOA achieved 90.39%, RSO achieved 93.97%, and the proposed model achieved the highest accuracy of 97.09%. Accuracy represents the proportion of correct predictions made by the model. Therefore, the proposed model showed the highest level of accuracy, indicating that it had the highest overall performance in correctly predicting the outcomes. STO, RSO, and MOA also demonstrated strong accuracy, while WSO had a relatively lower accuracy compared to the other models Figure 4.

Figure 4 Accuracy Prediction Graph
Precession
In terms of precision, the STO model achieved a score of 0.877, indicating that when it predicted a positive result, it was correct 87.71% of the time. The WSO model had a lower precision of 0.642, suggesting that it had a lower accuracy in correctly predicting positive cases. The MOA model performed better with a precision of 0.760, indicating a higher rate of correct positive predictions. The RSO model had a precision of 0.849, showing a relatively higher accuracy in correctly identifying positive cases. The proposed model demonstrated the highest precision of 0.927, implying a strong ability to accurately predict positive outcomes Figure 5.

Figure 5 Precession Prediction Graph
Sensitivity
The sensitivity values for each model are as follows: STO (87.71%), WSO (64.25%), MOA (75.98%), RSO (84.92%), and PROPOSED (92.74%). Sensitivity, also known as recall or true positive rate, measures the ability of a model to correctly identify positive cases. A higher sensitivity indicates a better ability to capture true positive cases. In this case, the PROPOSED model has the highest sensitivity, indicating that it can successfully identify a larger proportion of positive cases compared to the other models Figure 6.

Figure 6 Sensitivity Prediction Graph
Specificity
The specificity values for the different models are as follows: STO - 96.93%, WSO - 91.06%, MOA - 93.99%, RSO - 96.23%, and PROPOSED - 98.18%. Specificity measures the proportion of correctly identified negative cases out of all actual negative cases. The PROPOSED model has the highest specificity (98.18%), indicating that it accurately identified a larger percentage of true negative cases compared to the other models Figure 7.

Figure 7 Specificity Prediction Graph
F- Measure
The F-measure is a metric that combines both precision and sensitivity into a single value, providing a balanced measure of a model's performance. For the STO model, the F-measure is 87.71%, indicating a good balance between correctly identifying positive cases and accurately predicting positive results. The WSO model has a lower F-measure of 64.25%, indicating a lower overall performance in terms of both precision and sensitivity. The MOA model has an F-measure of 75.98%, suggesting a moderate performance in correctly identifying positive cases. The RSO model has an F-measure of 84.92%, indicating a relatively good balance between precision and sensitivity. Finally, the proposed model achieves the highest F-measure of 92.74%, indicating the best overall performance in correctly predicting positive results and accurately identifying positive cases Figure 8.

Figure 8 F- Measure Prediction Graph
Mathew correlation coefficient
The Matthews correlation coefficient (MCC) is a measure that combines the true positive, true negative, false positive, and false negative rates to provide an overall assessment of classification model performance. In this context, the MCC values for the models are as follows: STO (0.846), WSO (0.553), MOA (0.700), RSO (0.811), and PROPOSED (0.909). A higher MCC value indicates a stronger correlation between the model's predictions and the actual outcomes. The PROPOSED model demonstrates the highest MCC value of 0.909, suggesting the strongest overall performance among the evaluated models Figure 9.

Figure 9 MCC Prediction Graph
Negative predictive value
The negative predictive value (NPV) for each model is as follows: STO - 96.93%, WSO - 91.06%, MOA - 93.99%, RSO - 96.23%, and PROPOSED - 98.18%. NPV represents the proportion of negative predictions that are actually true negatives. A higher NPV indicates a lower rate of false negatives. Therefore, the proposed model has the highest NPV of 98.18%, indicating that when it predicts a negative result, it is correct 98.18% of the time Figure 10.

Figure 10 MCC Prediction Graph
False Positive rate
The false positive rate (FPR) is a metric that measures the proportion of negative cases incorrectly classified as positive by a model. In the context of the provided models, the STO model has an FPR of 3.07%, indicating that 3.07% of the negative cases were mistakenly predicted as positive. The WSO model has a higher FPR of 8.94%, suggesting a higher rate of false positives. The MOA model has an FPR of 6.01%, the RSO model has an FPR of 3.77%, and the proposed model has the lowest FPR of 1.82%. A lower FPR is generally desirable as it indicates a reduced number of false positives, which means a model is more accurate in correctly identifying negative cases Figure 11.

Figure 11 FPR Prediction Graph
False negative rate
The false negative rate (FNR) is a measure of the proportion of positive cases that were incorrectly classified as negative by the model. In the given models, the STO model has the highest FNR of 12.29%, indicating that it had a relatively higher tendency to incorrectly classify positive cases as negative. The WSO model has the highest FNR of 35.75%, suggesting that it had the highest rate of misclassifying positive cases. The MOA model has an FNR of 24.02%, while the RSO and PROPOSED models have lower FNR values of 15.08% and 7.26% respectively. A lower FNR is desirable as it indicates a better ability to accurately identify positive cases. Therefore, the PROPOSED model demonstrates the best performance among the given models in terms of minimizing false negatives and correctly identifying positive cases Figure 12.

Figure 12 FNR Prediction Graph
Conclusion
In conclusion, this paper proposes an Employee Performance Prediction System (EPPS) that combines data mining techniques and machine learning algorithms to accurately predict employee performance. The EPPS utilizes historical employee data and employs various data mining techniques to refine the dataset and extract relevant features. Additionally, a self-regularized Siberian Tiger Optimization (SSTO) algorithm is introduced as a feature selection mechanism to enhance the accuracy and efficiency of the prediction system. In the evaluation of the proposed model and the existing models (STO, WSO, MOA, RSO), several performance metrics were considered, including accuracy, precision, sensitivity, specificity, F-measure, MCC, NPV, FPR, and FNR. The proposed model outperformed all other models across most of these metrics, demonstrating its superiority in classification tasks. It achieved high accuracy (0.97095) and precision (0.927374), indicating its ability to accurately classify positive instances. The proposed model also showed good sensitivity (0.927374), correctly identifying positive instances, and high specificity (0.981844), effectively identifying negative instances. The F-measure (0.927374) and MCC (0.909218) values further confirm the model's overall effectiveness. These results support the conclusion that the proposed model exhibits superior performance compared to the existing models, making it a compelling choice for classification tasks.
References
Aguinis, H., & Burgi-Tian, J. (2021). Talent management challenges during COVID-19 and beyond: Performance management to the rescue. BRQ Business Research Quarterly, 24(3), 233-240.
Indexed at, Google Scholar, Cross Ref
Amjad, F., Abbas, W., Zia-UR-Rehman, M., Baig, S. A., Hashim, M., Khan, A., & Rehman, H. U. (2021). Effect of green human resource management practices on organizational sustainability: the mediating role of environmental and employee performance. Environmental Science and Pollution Research, 28(22), 28191-28206.
Indexed at, Google Scholar, Cross Ref
Baik, K., Kim, K. Y., & Patel, P. C. (2019). The internal ecosystem of high performance work system and employee service-providing capability: A contingency approach for servitizing firms. Journal of Business Research, 104, 402-410.
Indexed at, Google Scholar, Cross Ref
Barton, A. (2019). Preparing for leadership turnover in Christian higher education: Best practices in succession planning. Christian Higher Education, 18(1-2), 37-53.
Indexed at, Google Scholar, Cross Ref
Cai, M., Wang, W., Cui, Y. and Stanley, H.E., 2018. Multiplex network analysis of employee performance and employee social relationships. Physica A: Statistical Mechanics and Its Applications, 490, pp.1-12.
Indexed at, Google Scholar, Cross Ref
Fernandez, A., Lopez, V., del Jesus, M. J., & Herrera, F. (2015). Revisiting evolutionary fuzzy systems: Taxonomy, applications, new trends and challenges. Knowledge-Based Systems, 80, 109-121.
Indexed at, Google Scholar, Cross Ref
Gullo, F. (2015). From patterns in data to knowledge discovery: What data mining can do. Physics Procedia, 62, 18-22.
Indexed at, Google Scholar, Cross Ref
Helbing, D. (2018). Societal, economic, ethical and legal challenges of the digital revolution: from big data to deep learning, artificial intelligence, and manipulative technologies. In Towards digital enlightenment: Essays on the dark and light sides of the digital revolution (pp. 47-72). Cham: Springer International Publishing.
Indexed at, Google Scholar, Cross Ref
Inagawa, A. S. (2025). The Role of AI-Driven HR Analytics in Enhancing Employee Performance and Decision-Making in Retail Industries. Vifada Management and Social Sciences, 3(1), 01-16.
Indexed at, Google Scholar, Cross Ref
Jia, Q., Guo, Y., Li, R., Li, Y., & Chen, Y. (2018). A conceptual artificial intelligence application framework in human resource management.
Kamatkar, S. J., Tayade, A., Viloria, A., & Hernández-Chacín, A. (2018, June). Application of classification technique of data mining for employee management system. In International conference on data mining and big data (pp. 434-444). Cham: Springer International Publishing.
Indexed at, Google Scholar, Cross Ref
Karacay, G. (2017). Talent development for Industry 4.0. In Industry 4.0: Managing the digital transformation (pp. 123-136). Cham: Springer International Publishing.
Indexed at, Google Scholar, Cross Ref
Kontoghiorghes, C. (2016). Linking high performance organizational culture and talent management: satisfaction/motivation and organizational commitment as mediators. The International Journal of Human Resource Management, 27(16), 1833-1853.
Indexed at, Google Scholar, Cross Ref
Lather, A. S., Malhotra, R., Saloni, P., Singh, P., & Mittal, S. (2019, November). Prediction of employee performance using machine learning techniques. In Proceedings of the 1st international conference on advanced information science and system (pp. 1-6).
Indexed at, Google Scholar, Cross Ref
Li, C., Naz, S., Khan, M. A. S., Kusi, B., & Murad, M. (2019). An empirical investigation on the relationship between a high-performance work system and employee performance: measuring a mediation model through partial least squares–structural equation modeling. Psychology research and behavior management, 397-416.
Indexed at, Google Scholar, Cross Ref
Martin-Rios, C., Pougnet, S., & Nogareda, A. M. (2017). Teaching HRM in contemporary hospitality management: a case study drawing on HR analytics and big data analysis. Journal of teaching in travel & tourism, 17(1), 34-54.
Indexed at, Google Scholar, Cross Ref
Milliman, J., & Clair, J. (2017). Best environmental HRM practices in the US. In Greening people (pp. 49-73). Routledge.
Indexed at, Google Scholar, Cross Ref
Pahmi, S., Saepudin, S., Maesarah, N., & Solehudin, U. I. (2018, September). Implementation of CART (classification and regression trees) algorithm for determining factors affecting employee performance. In 2018 International Conference on Computing, Engineering, and Design (ICCED) (pp. 57-62). IEEE.
Indexed at, Google Scholar, Cross Ref
Pham, N. T., Thanh, T. V., Tucková, Z., & Thuy, V. T. N. (2020). The role of green human resource management in driving hotel’s environmental performance: Interaction and mediation analysis. International Journal of Hospitality Management, 88, 102392.
Indexed at, Google Scholar, Cross Ref
Shankar, R. S., Rajanikanth, J., Sivaramaraju, V. V., & Murthy, K. V. S. S. R. (2018, July). Prediction of employee attrition using datamining. In 2018 ieee international conference on system, computation, automation and networking (icscan) (pp. 1-8). IEEE.
Indexed at, Google Scholar, Cross Ref
Singh, K., & Khuteja, A. (2024). Employee Performance Prediction Using Machine Learning Algorithms. Journal of Scientific Research and Technology, 42-56.
Stone, D. L., & Deadrick, D. L. (2015). Challenges and opportunities affecting the future of human resource management. Human Resource Management Review, 25(2), 139-145.
Indexed at, Google Scholar, Cross Ref
Tomasevic, N., Gvozdenovic, N., & Vranes, S. (2020). An overview and comparison of supervised data mining techniques for student exam performance prediction. Computers & education, 143, 103676.
Indexed at, Google Scholar, Cross Ref
Tomczak, D. L., Lanzo, L. A., & Aguinis, H. (2018). Evidence-based recommendations for employee performance monitoring. Business Horizons, 61(2), 251-259.
Indexed at, Google Scholar, Cross Ref
Van Waeyenberg, T., & Decramer, A. (2018). Line managers’ AMO to manage employees’ performance: the route to effective and satisfying performance management. The International Journal of Human Resource Management, 29(22), 3093-3114.
Indexed at, Google Scholar, Cross Ref
Wang, J., Ma, Y., Zhang, L., Gao, R. X., & Wu, D. (2018). Deep learning for smart manufacturing: Methods and applications. Journal of manufacturing systems, 48, 144-156.
Indexed at, Google Scholar, Cross Ref
Received: 16-Sep-2025, Manuscript No. AMSJ-25-16379; Editor assigned: 17-Sep-2025, PreQC No. AMSJ-25-16379(PQ); Reviewed: 11-Oct-2025, QC No. AMSJ-25-16379; Revised: 28-Oct-2025, Manuscript No. AMSJ-25-16379(R); Published: 02-Nov-2025