Research Article: 2022 Vol: 26 Issue: 5
Factors Affecting Awareness towards Investment In Equity Shares: A Social Network Analysis Approach
Ranjit Singh, Indian Institute of Information Technology
Jayashree Bhattacharjee, Stock Holding Corporation of India Ltd
Kajol, Indian Institute of Information Technology
Citation Information: Singh, R. Bhattacharjee, J. & Kajol. (2022). Factors affecting awareness Towards investment in equity shares: A social network analysis approach. Academy of Marketing Studies Journal, 26(5), 1-14.
Abstract
The investors' familiarity with the firm, organisation, product, or service is measured by their awareness level. Investors' awareness of the different advantages and disadvantages of equity investing, its methods, and the analysis of the equity to arrive at a conclusion is referred to as equity investment awareness. A detailed literature analysis was conducted in order to discover the elements impacting equity investment awareness, and Social Networking Analysis was performed to determine the relationship between the contributing factors. The study discovered that intent and ability to invest, education, age, money, trust, and other factors are the most important drivers of equity investment awareness.
Keywords
Awareness, Equity, Equity investment, Social Network Analysis, Investors.
Introduction
A critical mass of well-informed investors is essential for confidence to grow in the equity market. An investor receives a lot of information on the market, and this information creates noise for them. They will have more faith in the stock market if they are aware of the various investment possibilities accessible. But the biggest issue is a lack of knowledge about the current state of the stock market by the investor Haritha & Uchil (2019). Self-awareness, in particular, can impact people’s choices to invest in stocks by shaping their perceptions of the costs and rewards of doing so Vissing-Jorgensen (2002); Das (2012). Volume of trade in the stock market depends upon the awareness level of investors about investments Singh (2011); Goyal & Sharma, 2014)). The level of awareness that investors have has a big impact on their decisions Das (2011) Talluru (1997); Rajeswari (2014); Singh & Bhattacharjee (2019). In the same parlance Haritha (2019) stated that awareness level might have a long-term impact on investors’ sentiment, hence influencing their financial performance. Some investors are conscious of their investment needs and choose their investment portfolio on their own, while others are oblivious of their requirements and may rely on advice from friends/relatives/brokers/websites and news channels to assist them find the best companies to invest in India's stock market. Therefore, more knowledgeable an investor is, the better investment decisions he can make. As a result, investors' awareness of the investment is an important aspect of their decision-making process.
The need of the hour is to identify the factors that can influence investor awareness of equities shares. Not all of the identified elements are equally relevant. They are interdependent. There are two parts to this investigation. In the first half, a systematic literature review is used to identify the drivers affecting equity investment awareness, and in second half, Social Network Analysis (SNA) is used to establish the most relevant components and their interrelationships. The SNA method was used to determine the link between the components and the most influencing factor among them after the factors impacting equity investment awareness were found. SNA is a method and collection of techniques for studying social interactions, as well as the patterns and consequences of such relationships Haythornthwaite (1996). Moreno was the one who first brought it up (1934). SNA is a statistical method for determining the existence and strength of a relationship between two variables. SNA looks at both social structure and individual characteristics at the same time Moreno (1934). The present paper attempts to find out the factors affecting the awareness towards equity share investment. This paper addresses two research questions:
RQ1: What are the factors that affect the awareness towards equity share investment?
RQ2: What are the relative weights of different factors identified?
RQ 3: Is there any relationship and interrelationship among the factors? If yes, in which way?
The remaining part of this paper is planned as follows: Section 2 of this paper illustrates methodology and data collection; Section 3 of the paper contains the list of prior literature identifying the factors affecting awareness level; Section 4 describes social network analysis and its interpretation; Section 5 shows the discussion about the research; lastly section 6 deal with the conclusion and the implications.
Review of Literature and Methodology
The study presents a blend of descriptive and empirical methodology. A comprehensive systematic evaluation of the current literature was conducted using the PRISMA methodology (Figure 1). Using all of the inclusion and exclusion criteria, 22 papers were identified as being relevant to the study and were considered. The results can be transferred into their respective databases and cross-checked for accuracy, however because these databases are dynamic and constantly updated, the quantity of documents returned may vary (Gupta et al. 2017). The search syntax is shown in Table 1.

Figure 1 Prisma Flow-Diagram of Literature Included in the Study
| Table 1 Search Syntaxes on Various Digital Database Sources | ||
| Data Sources | Keywords | |
| (awareness AND equity shares) | (awareness, financial awareness AND equity shares) AND (OR determinants) | |
| Web of Science | 60 | 15 |
| Science Direct | 5 | 1 |
| Emerald Insight | 1100 | 875 |
Different terminologies are employed in this study while employing SNA. These are explained below:
1. Node and Path: The construction of a social network is made up of two components: nodes and paths. A node is a spot where several lines intersect. A data structure's basic unit is the node. The information contained in a single data structure is represented by a node. Individuals in a social network can be represented as nodes in a graph, with the relationships between them represented as edges. Paths are the sequence of edges between pair of nodes.
2. Centrality: Centrality is a set of matrices that aims to quantify the importance or effect of a given node inside a network. The predominance of an individual in a network is referred to as centrality.
3. Degree centrality: The distribution of nodes and how they are connected, as well as the probability of being either strongly or less highly connected, is referred to as degree centrality. In terms of Freeman (1979), degree centrality is given as
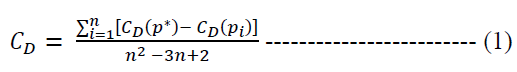
Where, CD= Degree Centrality
p = paths
n = nodes
4. In-degree and Out-degree: The amount of edges that come into a vertex is referred to as its in-degree. Deg + (v) are the symbol for it.
5. The out-degree of a vertex, on the other hand, refers to the number of edges that extend outward from the vertex. It's indicated with the letter deg- (v).
6. Betweenness centrality: Betweenness centrality is a metric for how frequently a node acts as a link between other nodes. Freeman (1979) defined betweenness as "the average difference between the centrality of the most central point CB(P*) and the centrality of all other points
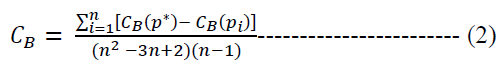
Where, CB= Betweenness Centrality
p = paths
n = nodes
7. Closeness centrality: Closeness centrality determines which node has the shortest distance between it and all other nodes.
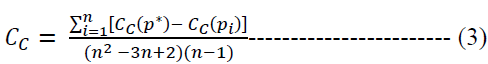
Where, C_C = Closeness Centrality
p = paths
n = nodes
8. Network Cohesion: The measure of connectivity and togetherness among components inside a network is referred to as network cohesion in social network analysis. Cohesion is a metric that determines the degree of intra-dependability among module members. The better the programme design, the higher the position.
9. Network Density: The fraction of ties that are connected out of all possible ties is known as network density. The higher the density, the more connected the network is.
10. The network graph was created using the UCINET software.
There are some factors which influence the awareness in respect of equity shares are tabulated in Table 2:
Data collection
The Delphi technique is used to list the factors impacting equity investment awareness. It's a type of structured communication that relies on a group of experts' perspectives Dalkey & Helmer (1963). Figure 2 illustrates the Delphi approach in action Figure 2.

Figure 2 Process Flow of Delphi Technique
It is presumptively true that the validity of group judgement is greater than that of individual judgement Kajol et al. (2020a); Kajol et al (2020b); Singh et al. (2021). Hallowell & Gambatese (2010) found that doing Delphi research requires at least eight experts, but Alizadeh et al. (2020) focused on the experts' expertise rather than the panel's size. Thus, nine experts from academia and industry, all with excellent expertise and experience, were invited to join the Delphi panel in this study to identify the identified elements affecting retail stock investors' awareness. Appendix 1 has information on the experts. A questionnaire was created to describe the study's goal and the significance of the parameters observed. Appendix 2 contains a copy of the questionnaire.
The factors were arranged in row and column forms, as shown in table 2, and the experts had to insert "1" in the relevant cell if there was a relationship between them, otherwise "0." The data was processed for further examination once each expert's responses were collected. The dependent-independent relationship between the components was evaluated throughout the analysis of the available data based on the majority of replies. For example, if 5 out of 9 experts agree there is a relationship between two elements and write "1" in the relevant cell, the relationship is shown to be "1" in the final matrix. The factor matrices were first created in an Excel sheet and then transferred to the SNA analysis software, UCINET. By behaviour and colouring the nodes, social network diagrams were created using text and excel files Table 3.
| Table 3 Expert Opinion Data Matrix Illustrating Relationship Between Factors (1 Signals' Relationship'; 0 Denotes 'No Relationship') | ||||||||||
| II | AI | IAS | E | W | A | G | O | I | T | |
| II | 0 | 0 | 0 | 0 | 0 | 0 | 0 | 0 | 0 | 1 |
| IA | 1 | 0 | 0 | 1 | 1 | 0 | 0 | 0 | 1 | 1 |
| IAS | 1 | 0 | 0 | 0 | 0 | 0 | 0 | 0 | 0 | 1 |
| E | 1 | 1 | 0 | 0 | 1 | 0 | 0 | 1 | 1 | 1 |
| W | 1 | 1 | 0 | 0 | 0 | 0 | 0 | 1 | 1 | 1 |
| A | 1 | 0 | 0 | 1 | 0 | 0 | 0 | 0 | 0 | 0 |
| G | 0 | 0 | 0 | 0 | 0 | 0 | 0 | 0 | 0 | 0 |
| O | 1 | 1 | 0 | 0 | 1 | 0 | 0 | 0 | 1 | 1 |
| I | 1 | 1 | 0 | 0 | 0 | 0 | 0 | 1 | 0 | 0 |
| T | 1 | 1 | 0 | 0 | 0 | 0 | 0 | 0 | 0 | 0 |
Analysis
The current study identifies ten factors, which are shown in the network diagram as blue colour square shape nodes. Figure 3 shows a network diagram of degree centrality obtained with the UCINET software Figure 3.

Figure 3 Degree Centrality of the Factors Influencing Investors’ Awareness
Influencing factors are represented in the network diagram by square-shaped nodes of varying sizes. The size of the nodes represents their influence. Small Square is used to represent all small nodes in the network, such as age (A), education, and so on. This is because these elements have the fewest relationships with other factors in the network. The larger square implies that these components have the most out-degree relations in the network, such as trust (T), wealth (W), and so on. The relationship between the nodes is represented by the links between them. The strongly impacting aspects are represented in the diagram's centre section. The highly affecting factors are those that have the most direct or indirect impact on the other factors.
The data matrix's visual representation is made up of 31 ties, with a compactness value of 0.465. Density and cohesiveness are two network measurements that are commonly used to define the features of a whole network. The current data set's network density is 0.344, which means the network only contains 34.4 per cent of all possible ties. The average distance between nodes is calculated as 1.643 walks.
The study employed the approach of ranking the elements worth more attention among them by adding two indicators out-degree and in-degree in order to prioritise the most impacting factor. Table 2 shows the in-degree and out-degree of the influencing factors. The in-degree centrality of a node or a factor relates to the number of ties it receives, whereas the out-degree centrality refers to the number of ties it sends. From two separate perspectives, these two indicators indicated the qualities and affects of the influencing element Table 4.
| Table 4 Degree of Centrality of Factors Influencing Equity Investment Awareness | |||
| Factors | out-degree | Factors | in-degree |
| E | 6 | II | 8 |
| W | 5 | T | 6 |
| AI | 5 | AI | 5 |
| O | 5 | I | 4 |
| I | 3 | W | 3 |
| T | 2 | O | 3 |
| A | 2 | E | 2 |
| IAS | 2 | A | 0 |
| II | 1 | G | 0 |
| G | 0 | IAS | 0 |
The out-degree and in-degree centrality scores were separated into three portions in order to categorise the extent of the link between the elements. Out-degree has the greatest value of 6 and the lowest value of 0. Since our goal was to determine three levels of out-degree, the difference between highest and lowest, i.e. 6, was divided by three, yielding 2. As a result, the out-degree value's first class interval was 0 (smallest value) to 2 (0+2), i.e., 0-2. Similarly, by adding 2 to the previous upper limit the next higher value, the next higher range was obtained. Singh & Bhattacharjee (2019); Choudhury & Singh (2015); Singh & Bhowal (2009) have constructed interpretation table using the similar methodology. As a result, the interpretation table 5 was created Table 5.
| Table 5 Interpretation of Out-Degree Values | |
| Range of out-degree values | Interpretation |
| 0–2 | Least influential factors |
| 2 – 4 | Moderately influential factors |
| 4 – 6 | Highly influential factors |
On the basis of table 5, it can be interpreted that education (E), wealth (W), ability to invest (AI), occupation (O) are highly influencing the other factors of awareness. Income (I), trusts (T), age (A), incentive to asset supplier (IAS) are moderately influencing the other factors of awareness. Rest of the factors have low impact on influencing other factors of the awareness.
An interpretation table 6 was prepared using the methodology adopted similar to table 5. The in-degree centrality score had the maximum value of 8 and the lowest value of 0. The difference between the highest and lowest was divided by three to determine their impact at three levels, yielding 2.67. As explained in table 5, similar interpretation table 6 was prepared Table 6.
| Table 6 Interpretation of In-Degree Values | |
| Range of in-degree values | Interpretation |
| 0 – 2.67 | Least influenced factors |
| 2.67- 5.33 | Moderately influenced factors |
| 5.33 – 8 | Highly influenced factors |
On the basis of table 6, it can be interpreted that intent to invest (II), trust (T) are highly influencing factors. Whereas, ability to invest (AI), income (I), wealth (W), occupation (O) are moderately influencing factors and rest of the factors are least influencing.
Degree centrality only considers a node's direct relationships to other nodes, not its indirect ties to all other nodes Singh et al. (2021). By focusing on the distance between each node and all others, closeness centrality techniques stress the distance between an actor and all others in the network Table 7.
| Table 7 Closeness Centrality of Factors Influencing Awareness about Equity Investment | |||
| Factors | out-close | Factors | in-close |
| A | 28.125 | II | 50.000 |
| E | 25.000 | T | 45.000 |
| AI | 24.324 | AI | 42.857 |
| W | 24.324 | I | 37.500 |
| O | 24.324 | W | 36.000 |
| IAS | 24.324 | E | 34.615 |
| I | 23.077 | O | 32.143 |
| T | 21.951 | A | 10.000 |
| II | 19.565 | G | 10.000 |
| G | 10.000 | IAS | 10.000 |
The rate at which data is transported from one node to the next is seen in Table 7. Out-close and in-close centrality scores were separated into three portions to categorise the extent of the link among the elements. As explained for table 5 and table 6, an interpretation table was prepared to interpret out-closeness centrality. The highest value of out-closeness centrality was 28.125 and the lowest value was 10.000 Rogers et al. (2013). This was distributed in three levels to identify three levels of out-closeness centrality using the similar methodology as done in table 5. As a result, the table 8 of interpretation was created Table 8.
| Table 8 Interpretation of Out-Close Values | |
| Range of out-close values | Interpretation |
| 10.000 – 16.042 | Low flow of information |
| 16.042 – 22.084 | Moderate flow of information |
| 22.084 – 28.125 | High flow of information |
On the basis of table 8, it can be interpreted that gender (G) has least flow of information to the other factors of awareness. Trust (T) and Intent of Invest (II) have moderate flow of information to the other factors of awareness. Rest of the factors have high flow of information to the other factors of the awareness Gamage & Sewwandi (2015).
Similarly, the measures of in-close centrality were divided into three groups. The in-close centrality measure had a maximum value of 50 and a minimum value of 10. To determine their impact at three levels, the difference between the highest and lowest was divided by three, yielding 13.333. As a result, the first class interval of in-degree value was 10.333 (10+13.333) to 23.333 (10+13.333). Similarly, by adding 13.333 to the next higher value, the next higher range was found. As a result, the interpretation table 9 was created Table 9.
| Table 9 Interpretation of In-Close Values | |
| Range of in-degree values | Interpretation |
| 10 –23.333 | Low flow of information |
| 23.333 – 36.333 | Moderate flow of information |
| 36.333 – 50 | High flow of information |
On the basis of table 9, it can be concluded that age (A), gender (G), and incentive to asset supplier (IAS) have minimal information flow from other factors. The flow of information from other factors is high for income (I), ability to invest (AI), trust (T), and intent to invest (II), and moderate for the rest of the factors Jappelli & Padula (2013).
The number of shortest pathways travelling through a node is measured by betweenness centrality Umadevi (2013). The indicators of betweenness centrality describe how well a factor or an interrelation may regulate the affects that flow through it. As an intermediary factor, it is used to rank the elements according to their degree of control Table 10.
| Table 10 Betweenness Centrality of Factors Influencing Awareness About Equity Investment | |
| Factors | Betweenness Centrality |
| AI | 15.833 |
| T | 10.000 |
| E | 5.833 |
| I | 1.833 |
| W | 1.833 |
| II | 0.833 |
| O | 0.833 |
| A | 0 |
| G | 0 |
| IAS | 0 |
The betweenness centrality of components is shown in Table 10. The criteria were ordered based on the value of betweenness centrality. The ability to invest has the largest network betweenness centrality, which indicates it can regulate the impact of the greatest number of influencing elements. On the basis of the betweenness centrality score, the study attempted to divide the elements into three levels of influence. The highest measure of betweenness centrality was 15.833, while the lowest was 0. To calculate the three levels of betweenness centrality, the difference between the greatest and lowest values of betweenness centrality was divided by three, yielding 5.277. Similar to the methodology explained in table 5, interpretation table 11 was formed to interpret the values of betweenness centrality Table 11.
| Table 11 Interpretation of Betweenness Centrality Values | |
| Range of betweenness centrality | Interpretation |
| 0 – 5.278 | Least influential factors |
| 5.278 – 10.556 | Moderately influential factors |
| 10.556 – 15.833 | Highly influential factors |
Table 11 shows that the ability to invest (AI) is the only highly important component, and it has the potential to influence the impact of the greatest number of influencing factors. The moderately influencing elements are trust (T) and education (E), whereas the remaining seven components are categorised as least influential factors that can control the impact of a small number of influential factors.
Discussion
Ability to invest was found to be a significant influencing factor in the social network as it has highest betweenness centrality (15.833). It has high in-degree (5) and high out-degree (5), indicating that it gets heavily influenced by other factors, while simultaneously having a strong influence on the other factors. The high in-close (42.857) and out close (24.324) denotes high inflow and outflow of information from other factors. Investors’ ability to invest in equity market depends on investors’ supportive income Azhar et al. (2017); Wang (2011). In SNA, trust and education are major factors with moderate betweenness centralities of 10.000 and 5.833, respectively. The in-degree of trust is 6 and the in-close is 45, which is higher than the out-degree of trust which is 2 and the out- close is 21.951. It means that an investor's faith in the equities market has a proclivity for obtaining more information from other components in the network, and hence is influenced by them. Qureshi et al. (2014) found that the investors who are well-versed in the stock market and have a higher level of financial awareness are more likely to trust market activities, which influences their decision to invest or not. Education has more out-degree (6) than in-degree (2), and in-close (34.614) is greater than out-closes (25) according to the analysis, implying that education can impact other network elements and the flow of information from those factors is considerable. To raise their level of awareness, investors require investment education options through television, the internet, newspapers, and professional publications Kumar & Arora (2013). Investors who are well-informed can make better investing decisions than those who are not Kumar & Arora (2013).
Implication
This study contributes to the pre-existing body of knowledge in the discipline of investor awareness by looking into the factors affecting awareness and interrelationship between the factors. The results have a number of managerial, policy and theoretical implications.
Managerial Implications
The marketers should frame their policy with respect to spreading awareness about equity investment by keeping in mind the ability of the investors to invest, since it is the most influencing factor in this respect. Financial awareness has direct impact on the wealth of the investors which consequently affect their ability to invest Van Rooij et al. (2012). Separate policies should be framed to spread awareness for the rich investors. The investors with higher ability to invest adopt a strategy which is expected to provide higher return whereas the investors with lower ability to invest generally concerned about the safety of their capital Tekçe et al. (2016). The managers should focus on building trust in the minds of investors and with increase in awareness, trust will built up Balloch et al. (2015); Chen et al. (2019). Investors who are well-informed about the stock market and have a high level of financial understanding are more inclined to trust market activity, which influences their decision to invest or not to invest Qureshi et al. (2014). Effective use of social media can help the companies in building trust Huang et al. (2019). Education of investors has an influence on their awareness about equity investment and therefore, the companies should design their awareness campaign considering the education of the investors Singh & Bhowal (2010). Katarachia et al., (2014) stated that financial literacy should be improved when it comes to investment. For lesser educated people, it should be designed so that they can understand it easily Singh & Bhowal (2012) Katarachia & Konstantinidis (2014).
Policy Implications
Ability to invest is considerably linked with the degree of awareness among the investors Kavitha (2015). More ability to invest will lead to high degree of awareness which will increase the knowledge of investors and the frequency of their investment as well. According to a study by Sewwandi (2015), which was backed up by Shefrin & Statman (1985), the majority of individual investors made equities market investments based on their ability to invest. More the ability to invest more is the risk-taking capability and more money goes to equity market. Bordoloi et al. (2020) state that financial awareness strengthens the link between education and investment decisions. Verma (2008) and Das (2011) found that education and the level of awareness about the investment complexities are positively correlated. Mwesigwa et al.(2013) found that trust is a key factor in stock market performance and economic efficiency. Ambuehl et al. (2015) suggested developing educational methods that more effectively encourage people to put relevant information into practise while making financing decisions. Fachrudin & Fachrudin (2016) concluded that education has a significant influence on financial literacy.
Singh & Bhowal, (2012) suggested creation of investor education associations at a small scale which will enhance the trust leading to frequent trading. Employers can arrange initiatives like education programs which will benefit employees by increasing their satisfaction towards their work as well as the organisation they are working with Singh & Bhowal (2012). Qureshi et al. (2014) opined that there is a need to check the stock exchange market rules with a view to make it more powerful.
Academic Contributions
The study posits a worthwhile avenue for researchers by exploring the factors affecting awareness about equity share investment from a different perspective, i.e., Social Network Analysis (SNA) which has not yet been done in any studies. At present, it is rare to see scholars conducting research on such topic using a different technique namely SNA. The past research has mostly focused on identifying factors using literature review or doing empirical examination of factors affecting awareness about equity investment. The study found that not all factors affecting equity investment awareness are equal in importance, and that there is a relationship between them. This study is first of its kind doing such examination. Furthermore, the same kind of study could also be conducted for different countries. Besides, the factors thus identified can also be investigated empirically. The factors affecting awareness about equity investment are identified through systematic literature review, however, the weighted importance of all the factors and the inter-relationship between the factors has been identified through SNA. Qualitative research is best suited for developing a theoretical understanding of the subject and quantitative research is best suited to empirically test the theories thus developed Volpe et al. (1996).
Limitations of the Study and Scope of Future Work
The Indian population has rural as well as urban people therefore; the findings could vary when conducted in other countries or geographical region. Secondly, this study has been conducted by taking into account the factors identified using review of limited literature. There could have been other factors also had there been review of some more literature and which could have a substantial impact on the findings. Third, this study is based on the opinion of limited number of experts. In order to generalise the findings, an empirical investigation is required by collecting data from large number of respondents. Lastly, the authors have used the cross-sectional data in the study. The longitudinal study could be conducted to analyze the same problem. The study has not included mediation and moderation effect of factors. Authors encourage aspiring researchers to analyze mediation and moderation effect of factors in the future research.
Conclusion
The study focuses on the factors that mutually have an impact on the investor’s awareness towards equity investment and ascertains most influencing factors and least influencing factors affecting awareness about equity investment. The study employs a thorough evaluation of relevant literature on financial awareness, as well as the Delphi technique for identifying components and the SNA technique for determining the link between them. Degree centrality, betweenness centrality and closeness centrality have been used in this study to determine the impact of factors on the existence of awareness. It is necessary to create aware investor in order to provide a boost to the investment scenario in the region which in turn is expected to go a long way in uplifting the economy of a region Singh & Bhowal (2009). This study identifies the factors affecting the awareness and the inter-relationship between the factors. So, the findings can be suitably used to enhance the level of awareness about equity investment as explained in the previous sections.
References
Agarwal, S., Driscoll, J.C., Gabaix, X., & Laibson, D. (2009). The age of reason: Financial decisions over the life cycle and implications for regulation. Brookings papers on Economic activity, 2009(2), 51-117.
Alizadeh, S., Maroufi, S. S., Sohrabi, Z., Norouzi, A., Dalooei, R. J., & Ramezani, G. (2020). Large or Small Panel in the Delphi Study? Application of Bootstrap Technique. Journal of Evolution of Medical and Dental Sciences, 9(15), 1267-1272.
Ambuehl, S., Bernheim, B.D., & Lusardi, A. (2015). GFLEC Working Paper Series.
Azhar, Z., Azilah, N., & Syafiq, A. (2017, November). Investment awareness among young generation. In International Conference on Business and Management Research (ICBMR 2017) (pp. 126-135). Atlantis Press.
Balloch, A., Nicolae, A., & Philip, D. (2015). Stock market literacy, trust, and participation. Review of Finance, 19(5), 1925-1963.
Indexed at. Google Scholar, Cross ref
Banumathy, K. (2016). Investors' Awareness about Investment in Stock Market. Issues and Challenges of Commerce and Management, 77.
Barber, B.M., & Odean, T. (2001). Boys will be boys: Gender, overconfidence, and common stock investment. The quarterly journal of economics, 116(1), 261-292.
Indexed at. Google Scholar, Cross ref
Behrman, J.R., Mitchell, O., Soo, C., & Bravo, D. (2010). Financial Literacy, Schooling and wealth accumulation, Working Paper Series No 16452, National Burean of Economics Research, America.
Bhattacharjee, J., & Singh, R. (2017). Awareness about equity investment among retail investors: A kaleidoscopic view. Qualitative Research in Financial Markets.
Indexed at. Google Scholar, Cross ref
Bhushan, P., & Medury, Y. (2013). Gender differences in investment behaviour among employees. Asian Journal of Research in Business Economics and Management, 3(12), 147-157.
Bordoloi, D., Singh, R., Bhattacharjee, J., & Bezborah, P. (2020). Assessing the awareness of Islamic law on equity investment in state of Assam, India. Journal of Islamic Finance, 9(1), 001-012.
Bucher-Koenen, T., & Lusardi, A. (2011). Financial literacy and retirement planning in Germany. Journal of Pension Economics & Finance, 10(4), 565-584.
Indexed at. Google Scholar, Cross ref
Chen, C., Zhao, L., Bian, J., Xing, C., & Liu, T.Y. (2019, July). Investment behaviors can tell what inside: Exploring stock intrinsic properties for stock trend prediction. In Proceedings of the 25th ACM SIGKDD International Conference on Knowledge Discovery & Data Mining (pp. 2376-2384).
Chen, H., & Volpe, R.P. (2002). Gender differences in personal financial literacy among college students. Financial services review, 11(3), 289-307.
Choudhury, M., & Singh, R. (2015). Customers' experience in financial inclusion through bancassurance. The Journal of Insurance Institute of India, 2(4), 55-61.
Dalkey, N., & Helmer, O. (1963). An experimental application of the Delphi method to the use of experts. Management science, 9(3), 458-467.
Indexed at. Google Scholar, Cross ref
Das, S.K. (2012). Small investor’s behaviour on stock selection decision: A case of Guwahati stock exchange. International Journal of Advanced Research in Management and Social Sciences, 1(2), 59-78.
Das, S.K. (2011). An empirical analysis on preferred investment avenues among rural and semi-urban households. Journal of Frontline Research in Arts and Science, 1(2), 26-36.
Fachrudin, K.R., & Fachrudin, K.A. (2016). The influence of education and experience toward investment decision with moderated by financial literacy. Polish Journal of Management Studies, 14.
Indexed at. Google Scholar, Cross ref
Finke, M.S., Howe, J.S., & Huston, S.J. (2017). Old age and the decline in financial literacy. Management Science, 63(1), 213-230.
Indexed at. Google Scholar, Cross ref
Fonseca, R., Mullen, K.J., Zamarro, G., & Zissimopoulos, J. (2012). What explains the gender gap in financial literacy? The role of household decision making. Journal of Consumer Affairs, 46(1), 90-106.
Indexed at. Google Scholar, Cross ref
Gamage, W., & Sewwandi, T. (2015). Behavioral Biases in Investment Decision Making: A Literature Review. In International Conference on Business and Information.
Guiso, L., & Jappelli, T. (2005). Awareness and stock market participation. Review of Finance, 9(4), 537-567.
Indexed at. Google Scholar, Cross ref
Hallowell, M.R., & Gambatese, J.A. (2010). Qualitative research: Application of the Delphi method to CEM research. Journal of construction engineering and management, 136(1), 99.
Haritha, P.H., & Uchil, R. (2019). Impact of investor sentiment on decision-making in Indian stock market: an empirical analysis. Journal of Advances in Management Research, 17(1), 66-83.
Indexed at. Google Scholar, Cross ref
Hastings, J., & Mitchell, O.S. (2020). How financial literacy and impatience shape retirement wealth and investment behaviors. Journal of Pension Economics & Finance, 19(1), 1-20.
Indexed at. Google Scholar, Cross ref
Haythornthwaite, C. (1996). Social network analysis: An approach and technique for the study of information exchange. Library & information science research, 18(4), 323-342.
Indexed at. Google Scholar, Cross ref
Huang, T.C., Zaeem, R.N., & Barber, K.S. (2019). It is an equal failing to trust everybody and to trust nobody: Stock price prediction using trust filters and enhanced user sentiment on Twitter. ACM Transactions on Internet Technology (TOIT), 19(4), 1-20.
Jappelli, T., & Padula, M. (2013). Investment in financial literacy and saving decisions. Journal of Banking & Finance, 37(8), 2779-2792.
Indexed at. Google Scholar, Cross ref
Kajol, K., Biswas, P., Singh, R., Moid, S., & Das, A.K. (2020a). Factors affecting disposition effect in equity investment: A Social Network Analysis approach. International Journal of Accounting & Finance Review, 5(3), 64-86.
Indexed at. Google Scholar, Cross ref
Kajol, K., Nath, M., Singh, R., Singh, H.R., & Das, A.K. (2020b). Factors affecting seasonality in the stock market: A social network analysis approach. International Journal of Accounting & Finance Review, 5(4), 39-59.
Indexed at. Google Scholar, Cross ref
Katarachia, A., & Konstantinidis, A. (2014). Financial education and decision making processes. Procedia Economics and Finance, 9, 142-152.
Kavitha, C. (2015). Investors attitudes towards stock market investment. International Journal of scientific research and management, 3(7), 3356-3362.
Kumar, R., & Arora, R.S. (2013). Investors’ perceptions about mutual funds in India. Indian Journal of Finance, 7(1), 44-52.
Lusardi, A., & Mitchell, O.S. (2011). Financial literacy and retirement planning in the United States. Journal of pension economics & finance, 10(4), 509-525.
Indexed at. Google Scholar, Cross ref
Malmendier, U., & Shanthikumar, D. (2007). Are small investors naive about incentives?. Journal of Financial Economics, 85(2), 457-489.
Indexed at. Google Scholar, Cross ref
Maruthu, P.P., & Benjamin, C.S. (2010). A study on equity investors awareness. Doctoral dissertation, Bharathia University, Tamilnadu.
Monticone, C. (2010). How much does wealth matter in the acquisition of financial literacy?. Journal of Consumer Affairs, 44(2), 403-422.
Indexed at. Google Scholar, Cross ref
Moreno, J.L. (1934). Who shall survive?: A new approach to the problem of human interrelations.
Indexed at. Google Scholar, Cross ref
Qureshi, H.A., Mehmood, S., & Sarwar, A. (2014). Determinants of Trust and Level of Awareness of Retail Investors In Stock Market of Pakistan. Science International, 26(5).
Rajeswari, N. (2014). A study on investment awareness and preferences of the salaried class in Tirunelveli District. International Journal of in Multidisciplinary and Academic Research, 3(6), 1-14.
Rogers, M., Sulait, T., & Edson, R.A. (2013). The role of market liquidity, information efficiency on stock market performance: Empirical evidence from Uganda stock exchange. African Journal of Business Management, 7(37), 3781-3789.
Shefrin, H., & Statman, M. (1985). The disposition to sell winners too early and ride losers too long: Theory and evidence. The Journal of finance, 40(3), 777-790.
Indexed at. Google Scholar, Cross ref
Shobana, V.K., & Jayalakshmi, J. (2010). Investors’ awareness and performance. Organisational Management, 22(3), 16-18.
Singh, R. (2011). Overconfidence in financial decisions: a critical review. IASMS Journal of Business Spectrum, 4(02), 105-114.
Singh, R., & Bhattacharjee, J. (2019). Measuring equity share related risk perception of investors in economically backward regions. Risks, 7(1), 12.
Indexed at. Google Scholar, Cross ref
Singh, R., & Bhowal, A. (2009). Developing entrepreneurial culture by inculcating the culture of equity investment. Business Vision, 5(1), 87-99.
Singh, R., & Bhowal, A. (2010). Imparting investment education to employees by the employer: an expectation-experience gap study. Amity Management Analyst, 5(2), 57-65.
Singh, R., & Bhowal, A. (2012). Marketing dimension of equity related risk perception of employees: Own company’s shares vs other company’s shares. Management Insight, 6(2).
Singh, R., Bhattacharjee, J., & Kajol, K. (2021). Factors Affecting Risk Perception in Respect of Equity Shares: A Social Network Analysis Approach. Vision, 09722629211046082.
Indexed at. Google Scholar, Cross ref
Talluru, L.R. (1997, October). A fuzzy expert system for mutual fund selection. In 1997 IEEE International Conference on Systems, Man, and Cybernetics. Computational Cybernetics and Simulation (Vol. 1, pp. 680-685). IEEE.
Indexed at. Google Scholar, Cross ref
Tekçe, B., Y?lmaz, N., & Bildik, R. (2016). What factors affect behavioral biases? Evidence from Turkish individual stock investors. Research in International Business and Finance, 37, 515-526.
Indexed at. Google Scholar, Cross ref
Umadevi, V. (2013). Case study–centrality measure analysis on co-authorship network. Journal of Global Research in Computer Science, 4(1), 67-70.
Van Rooij, M.C., Lusardi, A., & Alessie, R.J. (2012). Financial literacy, retirement planning and household wealth. The Economic Journal, 122(560), 449-478.
Indexed at. Google Scholar, Cross ref
Verma, M. (2008). Wealth management and behavioral finance: The effect of demographics and personality on investment choice among Indian investors. The IUP Journal of Behavioral Finance, 20.
Vissing-Jorgensen, A. (2002). Towards an explanation of household portfolio choice heterogeneity: Nonfinancial income and participation cost structures.
Volpe, R.P., Chen, H., & Pavlicko, J.J. (1996). Personal investment literacy among college students: A survey. Financial Practice and Education, 6(2), 86-94.
Wang, A. (2011). Younger Generations’ Investing Behaviors in MutualFunds: Does Gender Matter?. The journal of wealth management, 13(4), 13-23.
Indexed at. Google Scholar, Cross ref
Received: 20-May-2022, Manuscript No. AMSJ-22-12048; Editor assigned: 23-May-2022, PreQC No. AMSJ-22-12048(PQ); Reviewed: 14-Jul-2022, QC No. AMSJ-22-12048; Revised: 20-Jul-2022, Manuscript No. AMSJ-22-12048(R); Published: 29-Jul-2022