Research Article: 2023 Vol: 27 Issue: 2
Factors Shaping Consumer′s Green Perceived Value, Self−Brand Connection and Brand Loyalty for Green Brands In India
Balakrishnan Menon P, Rajagiri College of Social Sciences, Mahatma Gandhi University
Citation Information: Menon, P.B. (2023). Factors shaping consumer’s green perceived value, self-brand connection and brand loyalty for green brands in India. Academy of Marketing Studies Journal, 27(2), 1-19.
Abstract
This study aimed to evaluate the perception of green brand customers towards Green Benefits, that is, the utilitarian environmental benefit (UEB) and warm glow (WG), green trust (GTR), green health perception (GHP) and green transparency (GRT) on green perceived value (GPV). It validated the mediating role of GPV between Green Benefits and Brand Loyalty. It also evaluated the mediating role of the self-brand connection between perceived green value and brand loyalty. The study relied on a sample size of 420 respondents, who purchased green products in Kerala. SPSS and AMOS Graphics tools were used for data analysis. Confirmatory Factor Analysis (CFA) was performed to evaluate the sufficiency and acceptability of the measurement items of each of the dimensions/constructions. It was found that green benefits, trust, and health perception positively influenced consumers to buy green products. GPV mediated between green brand benefits and brand loyalty. Green perceived value directly improved brand loyalty. GPV contributed positively to building self-brand connections, which in turn, influenced brand loyalty towards green products. The results could be used by marketers to develop strategies to attract customers to buy green products and increase brand loyalty towards it. Organizations can utilize the results of this study to develop or design various communication strategies to build green value perceptions as perceived by customers, to enhance their brand loyalty.
Keywords
Utilitarian Environmental Benefit, Warm Glow Benefit, Green Trust, Green Health Perception, Green Transparency, Green Perceived Value, Self-Brand Connection, Brand Loyalty.
Introduction
The main social and environmental problems including global warming and sustainability have increasingly attracted consumer awareness of these issues. Consumers are willing to pay premium prices for goods that help attain a sustainable environment, social responsibility, and greening features. A green brand is defined as a brand that offers a remarkable environmental advantage over its competitors and these eco-advantages of the green brands help in catching the customers who give importance to the environment and are green while purchasing something. Some green brands also focus on ethical and social concerns towards the environment as well as customers (Berrone, Fosfuri, Gelabert, & Gomez-Mejia, 2013). To understand customers’ perceptions of green products, proper attention must be paid to green brand-related issues (Chen, 2008).
Consumers need clear and transparent information on green brands to achieve consumption-related priorities and must accept that green brands have advantages and values that go beyond what alternative brands provide (Chen, 2010).
The study aims to discover the factors that affect customers' perception of the consumption of green brands. Indian consumers are known for seeking more perceivable product benefits, than the actual price they pay for such products. Brands claiming to be producing green products, need to convince customers about the environmental benefits as well as the perceptible green value proposition to their customers. Therefore, this study aims to analyze how green benefits such as utilitarian environmental and warm glow benefits, green transparency, green trust, and green health perception, have an impact on the green perceived value (GPV) of green brands. Moreover, it tries to find out whether GPV acts as a mediating variable between utilitarian environmental benefits, warm glow benefits, perceived green transparency, green trust, green health perception and brand loyalty. It also attempts to interpret the positive association of GPV with self-brand connection and its direct relationship with brand loyalty and the indirect relationship with brand loyalty through self-brand connection. This can help marketers decide on factors that have a productive influence on customers to buy green brands and increase their loyalty towards those brands.
Research Gap
There are very few studies on the impact of green perceived value contributing towards brand connection and brand loyalty for green products, especially in the Indian context. Consumer behavioural patterns differ in the context of the purchasing of green products in India. It is necessary to study the impact of green perceived value on purchase intention and decision to buy, especially in the Indian context. This study is necessary as it analyzes the green value perceptions and customer-green-brand relationships among consumers.
Objectives of the Study
The objectives of the study are listed below:
1) To determine customers’ perceptions towards green brands and how they impact brand loyalty.
2) To find the impact of five antecedents (utilitarian environment, warm glow benefits, green transparency, green trust, and green health perception) on GPV.
3) To determine the direct influence of GPV on brand loyalty
4) To find an indirect relationship between GPV and brand loyalty via a self-brand connection.
Review of Literature
Theoretical Foundations
From a theoretical perspective, consumer perceived value is the overall evaluation of products or services purchased by the consumer and what the consumer receives in return from these products and services (Zeithaml, 1988). Two theoretical models of brand equity - Aaker’s model and Keller’s model - were also used in this study (Aaker, 1996; Keller, 2008).
Utilitarian Environmental Benefit
As compared with conventional attributes, the environmental benefit outweighs it and is considered an essential attribute for green brands (Lin, Lobo, & Leckie, 2017). The utilitarian environmental benefit is an important concept to be focused on by marketers as it helps to enhance the utility of buying such products and helps in saving, quality, and convenience, as well as enhancing the efficiency of the purchasing experience (Shan & Hsun, 2012). According to previous research, there is a positive relationship between product performance and customers’ GPV (Baker, Parasuraman, Grewal, & Voss, 2002). It is examined that functional and environmental benefits have an impact on GPV and thus, the following is hypothesized:
H1. The utilitarian environmental benefit is positively associated with GPV.
Warm Glow
In the context of green brands, a warm glow means a positive feeling that the customer experiences, when they purchase green brands (Chen & Chinghsun, 2012). The sense of moral satisfaction in the minds of customers with a common good is termed a warm glow, a form of impure altruism (Patrick, Ibanez, & Vanessa, 2012). Therefore, marketers should necessarily be focused on the warm glow of the firm and how it impacts the customers (Lin, Lobo, & Leckie, 2017). In essence, a warm glow leads to a positive assessment of a company and its brands by consumers. So, the following is hypothesized:
H2. Warm glow benefits are positively associated with GPV.
Green Transparency
A firm or a brand should have commitments to the customers and environment in a moral, social as well as ethical way (Lin, Lobo, & Leckie, 2017). Brands need to be transparent in their green policies and initiatives. When customers are provided with this relevant information about the firm's green initiatives and policies, it will help in involving customers in pro-environmental behaviour (Patrick, Ibanez, & Vanessa, 2012). This green transparency, therefore, will motivate the action of the firm as they offer customers relevant information (Lin, Lobo, & Leckie, 2017) and thus the following can be hypothesized:
H3. Perceived green transparency is positively associated with GPV.
Green Trust
Green trust means the customer's belief to depend on a product or a brand due to their expectation which is resulting from the product's credibility, benevolence, and ability to its environmental performance (Ballester & Alema´n, 2005). When green brands provide sufficient information regarding their green activities, initiative and processes, customers will trust the brand (Chen, 2010). Due to increasing environmental problems, people depend more on green products which shows trust towards the product and its perceived value (Mezger, Cabanela, Cabiddu, & Rüdiger, 2020). Therefore, hypothesis H4 is formulated.
H4. Green trust is positively associated with GPV.
Green Health Perception
The green brand delivers the health benefits from its green products as expected by the customers. If the expected goals are delivered to them, that specific green brand can create brand loyalty among customers (Hur, Kim, & Park, 2011). Providing customers with what they perceive to receive will help in creating green perceived value in the minds of customers thus developing brand loyalty (Grandi, Burt, & Cardinalia, 2021). So, the following can be hypothesized:
H5. Green health perception is positively associated with GPV.
Green Perceived Value
Green perceived value (GPV) means to the consumer's overall evaluation or appraisal of the net benefits of a product or service and is based on what they have received from the product and what is been given by the product based on the environmental preferences of consumers, sustainable expectations, and green needs (Dwivedi, 2014). GPV helps the brands in attaining differentiation and thereby creating effective customer relationships with the brand (Patrick, Ibanez, & Vanessa, 2012). Perceived value by the customer can have a mediating role between green benefits, green transparency, green trust, and green health perception with that of brand loyalty (Baker, Parasuraman, Grewal, & Voss, 2002). Thus, this study suggests that utilitarian environmental benefits, warm glow, green transparency, green trust, and green health perception have an indirect relationship with brand loyalty via GPV. Adding potential benefits to the products increases the perceived value among customers (Spiller & Ariely, 2020). Thus, the following is hypothesized:
H6. GPV mediates the relationships between (a) utilitarian environmental benefit, (b) warm glow benefit, (c) perceived green transparency (d) green trust (e) green health perception and brand loyalty.
Self-Brand Connection
Self-brand connection means the connection that the individual has with a specific brand and associates the brands with their self-concept. This will create a positive self-concept in the minds of people (Dwivedi, 2014). So, the brands must create a positive self-concept or self-brand connection with their customers as it helps in increasing brand loyalty (Lin, Lobo, & Leckie, 2017). The GPV should improve the connectivity of consumers with a specific brand. Some researchers claim that the value perceived by customers is linked directly with loyalty and positive word-of-the- mouth communications (Chen, 2008), while others argue that satisfaction and brand trust mediate their relationship (Park & Kim, 2016). Brands with a story that consumers can easily relate to are not only evaluated more favourably but also have a higher likelihood of purchase than brands with few or no self-brand connections (Harrigana, Eversa, P, & Daly, 2018). Therefore, the following has been hypothesized:
H7. GPV is positively associated with the self-brand connection.
H8. GPV is directly associated with brand loyalty and indirectly associated with brand loyalty through self-brand connection.
Brand Loyalty
Brand loyalty is referred to as the positive association that customers have towards a brand or a particular product. When a customer is loyal to a particular brand, he or she will tend to buy the same brand again (Huang, Fang, Huang, Chang, & Fang, 2014). Customers should have a clear idea about the green strategies and initiatives that the brand takes and they should find the brand is environmentally sustainable (Lin, Lobo, & Leckie, 2017). Brand loyalty is important for a firm or a brand as it increases the sale of the product and thereby increases the profit (Park & Kim, 2016). Higher brand loyalty implies higher consumer satisfaction, increased brand choice, and higher consumer spending (Chung & Kim, 2020).
From the above literature reviews on green brands and the perception of the customers about green brands, it is depicted that there is a need for analyzing the customer's preferential factors which will impact the green perceived value and brand loyalty.
Research Methodology
Hypotheses for Testing
A summary of the hypotheses discussed in the earlier section is listed below:
H1. The utilitarian environmental benefit is positively associated with GPV.
H2. Warm glow benefits are positively associated with GPV.
H3. Perceived green transparency is positively associated with GPV.
H4. Green trust is positively associated with GPV.
H5. Green health perception is positively associated with GPV.
H6. GPV mediates the relationships between (a) utilitarian environmental benefit, (b) warm glow benefit, (c) perceived green transparency (d) green trust (e) green health perception and brand loyalty.
H7. GPV is positively associated with the self-brand connection.
H8. GPV is directly associated with brand loyalty and indirectly associated with brand loyalty through self-brand connection.
Variables in the Study
The variables, factors used for measurement, and their sources are listed in Table 1.
| Table 1 Data Source Of Variables And Factors | ||
| VARIABLES | FACTOR ANALYZED | SOURCE OF SCALE |
| Utilitarian Environmental Benefit | 1. Environmental benefit of the product. 2. The Respect of the brand towards the environment. |
(Lin, Lobo, & Leckie, 2017) |
| Warm Glow Benefits | Moral satisfaction of customers while purchasing green brands. |
(Lin, Lobo, & Leckie, 2017) |
| Positive feelings towards the brand | ||
| Green Transparency | 1. Transparency about green policies and initiatives. 2. Information about the environmental impact. |
(Lin, Lobo, & Leckie, 2017) |
| Green Trust | 1. Reliability and trustworthiness of the brand 2. Willingness to depend on the green brand. |
(Chen, 2010) |
| Green Health Perception | Health benefits delivered to the customers. Positive health perception created by the brand |
(Zulfiqar, 2015) |
| Green Perceived Value | 1. Net benefits from green products. 2. Benefits as expected by the customers. |
(Lin, Lobo, & Leckie, 2017) |
| Self-Brand Connection | 1. Incorporation of the brands into the customer’s self-concept. 2. Positive self-concept about the green product. |
(Lin, Lobo, & Leckie, 2017) |
| Brand Loyalty | 1. Positive association of the customers towards the green brand. 2. Repurchasing tendency of customers. 3. Purchase green brands over other brands. 4. Recommend to others. |
(Lin, Lobo, & Leckie, 2017) |
Conceptual Model
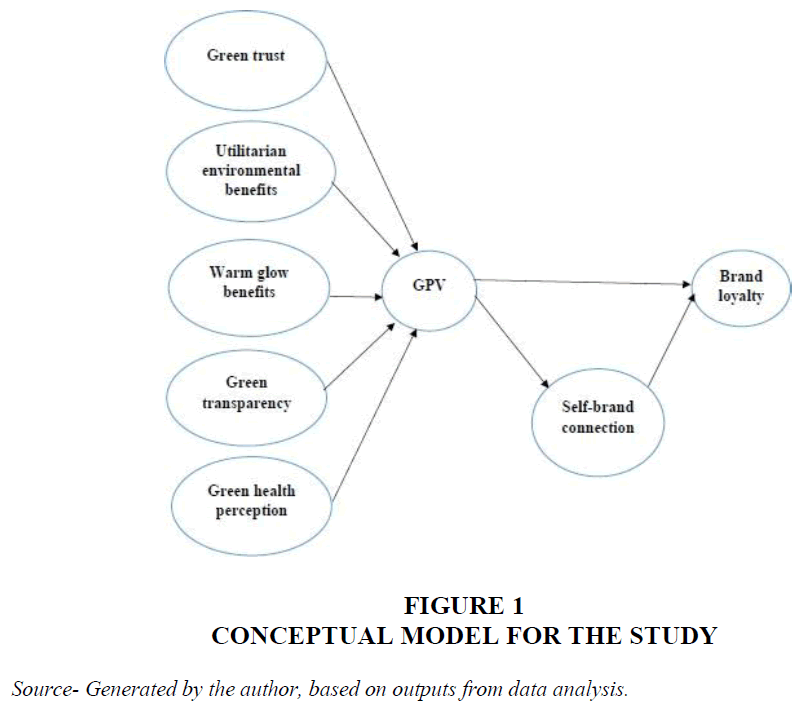
The conceptual model developed for the study is shown in Figure 1.
Figure 1 Conceptual Model for the Study
Source- Generated by the author, based on outputs from data analysis.
Research Design
The type of research used for the study was descriptive research. The population considered for conducting the study was the consumers in the State of Kerala in India, who are the purchasers of green products covered in brands such as Amul, Dettol, and Lifebuoy, both from online as well as offline retail outlets. The sample size was 420 respondents. The respondents were between the age of 18 to 50 years, who are purchasers of green products, and were taken as the sample respondents for conducting the study. People aged 18 to 50 are considered for the study because a majority of the people within this people will be more brand conscious and will be aware of the various initiatives of such brands. Respondents were randomly chosen from customer source lists obtained from prominent department stores in the city of Cochin, Kerala state. The questionnaire included 34 questions that covered the aspects that influence the variables in the study that is the utilitarian environmental benefit, warm glow, green transparency, green trust, green health perception (independent variables), green perceived value (mediating variable), self-brand connection (mediating variable) and brand loyalty (dependent variable) and the socio-demographic details were included in the questionnaire. Google forms were designed to collect the data online, by sending the forms through email to the chosen respondents. The responses to the questions were measured on a 5- point Likert scale ranging from strongly disagree to strongly agree.
SPSS and AMOS Graphics are the tools that were used for data analysis. Reliability tests, descriptive statistics, socio-demographic analysis, and correlation were conducted using SPSS and validity tests, regression analysis, factor loading, structural model analysis, model fit indices and mediation test were done using AMOS. On each dimension of the constructs, Confirmatory Factor Analysis (CFA) was performed to decide if the measurement items of each of the dimensions/constructions are sufficient to reflect it.
Data Analysis and Interpretation
The study relied on a sample size of 420 respondents, who purchased green products in Kerala, in which the number of male respondents was 169 and the number of female respondents was 251, showing that 40.2% of the respondents were males and 59.8% of them were females. Results showed that 52.6% of them were students, 30% of the sample were full-time employed, 4.4% were part-time employed and 12.6% of the sample were unemployed. It was observed from the data analysis that the means ranged from 3.6327 to 3.7913 for the variables. In the Likert scale used, value 5 on the scale refers to “Strongly Agree” and value 1 refers to “Strongly Disagree”. Mean values are seen to be well above the central value of 2.50 on the Likert scale which means that the item indicators are good enough for the measurements of the variables. The standard deviations ranged from 0.84055 to 0.91008. The Skewness value ranged between -0.625 and -0.980 which is within the acceptable range of ±2.0. For the Kurtosis, the values ranged between 0.297 and 1.393 which is acceptable and is within the cutoff of ±1.0. As these measured statistical values were within the recommended ranges, it indicated the presence of normal distribution for the sample. It was found that all the variable in the study has their Cronbach's Alpha ranging from 0.70 - 0.95. The reliability analysis showed that the reliability of the variables was good and the variable measurements were reliable for conducting the study.
Discriminant Validity
To check the discriminant validity of the study, the square root of the AVE (Average variance extracted), which is shown along the diagonal in Table 2, must be greater than the values in the corresponding columns. As the table depicts the diagonal values are higher than the values in their respective columns, the study proves discriminant validity. Thus, discriminant validity was established amongst the variables. It means that the constructs are distinctly different from each other, which ensures that the latent variables in the study are not correlated with other latent variables.
| Table 2 Discriminant Validity Score Values | ||||||||||||
| CR | AVE | MSV | Max R(H) | UEB | WG | GRT | GTR | GHP | GPV | BL | SBC | |
| UEB | 0.876 | 0.703 | 0.7 | 0.877 | 0.838 | |||||||
| WG | 0.913 | 0.777 | 0.71 | 0.914 | 0.813 | 0.882 | ||||||
| GRT | 0.932 | 0.774 | 0.701 | 0.934 | 0.835 | 0.801 | 0.880 | |||||
| GTR | 0.938 | 0.752 | 0.71 | 0.939 | 0.816 | 0.82 | 0.829 | 0.867 | ||||
| GHP | 0.893 | 0.736 | 0.71 | 0.893 | 0.827 | 0.778 | 0.832 | 0.828 | 0.858 | |||
| GPV | 0.93 | 0.768 | 0.73 | 0.93 | 0.822 | 0.843 | 0.810 | 0.816 | 0.821 | 0.877 | ||
| BL | 0.938 | 0.792 | 0.676 | 0.939 | 0.736 | 0.747 | 0.720 | 0.753 | 0.822 | 0.800 | 0.890 | |
| SBC | 0.912 | 0.776 | 0.65 | 0.914 | 0.751 | 0.759 | 0.736 | 0.771 | 0.797 | 0.806 | 0.795 | 0.881 |
Note: Abbreviations CR – Composite Reliability, MSV - Maximum Shared Variance.
Convergent Validity
Convergent validity establishes that the observed variables are the true indicators of a particular construct and all the variables should converge to the construct so that the derived model of all the variables ensures necessary fitness. To have strong convergent validity for variables the values of factor loading should be greater than 0.50 (Hair, Ringle, & Sarstedt, 2011). It can be seen from table 2 values that the variables are compliant with convergent validity by referring to composite reliability (CR) and average variance extracted (AVE). From the above table, it is depicted that CR > 0.7, CR > AVE and AVE > 0.5 for all the variables, meeting the required threshold values. It ensures to prove that the variables comply with convergent validity requirements. The factor loading values were seen to be above 0.70, further establishing the convergent validity of the variables.
Model Fit Indices
Table 3 shows the model fitness indices and their values.
| Table 3 Model Fit Indices | ||
| Indices | Acceptable value | Model fit values obtained |
| CMIN (χ2) | _ | 915.303 |
| df | _ | 349 |
| CMIN/df | <3 | 2.623 |
| p-value | <=0.05 | <0.001 |
| GFI | >=0.90 | 0.91 |
| AGFI | >=0.80 | 0.827 |
| NFI | >=0.90 | 0.931 |
| CFI | >=0.90 | 0.956 |
| RMSEA | <=0.08 | 0.062 |
| P close | <=0.05 | .000 |
It can be seen from Table 3 that all the required model fitness indices are meeting the acceptable requirements. This ensured that the model is a good fit for the variables used in the study.
Derived Structured Equation Model (SEM)
The table 4 shows the standardized beta, unstandardized beta (B), standardized error (β), critical ratio and p-value.
| Table 4 Structured Equation Model Values with Path Coefficients Results | ||||||||
| Std. Beta | Un-std. Beta | S.E. | C.R. | P-Value | Result | |||
| GPV | <--- | UEB | 0.178 | 0.134 | 0.027 | 4.955 | <0.001 | Accepted |
| GPV | <--- | WG | 0.372 | 0.267 | 0.027 | 9.875 | <0.001 | Accepted |
| GPV | <--- | GRT | -0.029 | -0.021 | 0.024 | -0.871 | 0.384 | Rejected |
| GPV | <--- | GTR | 0.576 | 0.412 | 0.03 | 13.508 | <0.001 | Accepted |
| GPV | <--- | GHP | 0.509 | 0.365 | 0.03 | 12.239 | <0.001 | Accepted |
| SBC | <--- | GPV | 0.712 | 0.852 | 0.065 | 13.047 | <0.001 | Accepted |
| BL | <--- | GPV | 0.465 | 0.545 | 0.08 | 6.842 | <0.001 | Accepted |
| BL | <--- | SBC | 0.337 | 0.33 | 0.065 | 5.067 | <0.001 | Accepted |
Hypothesis Testing
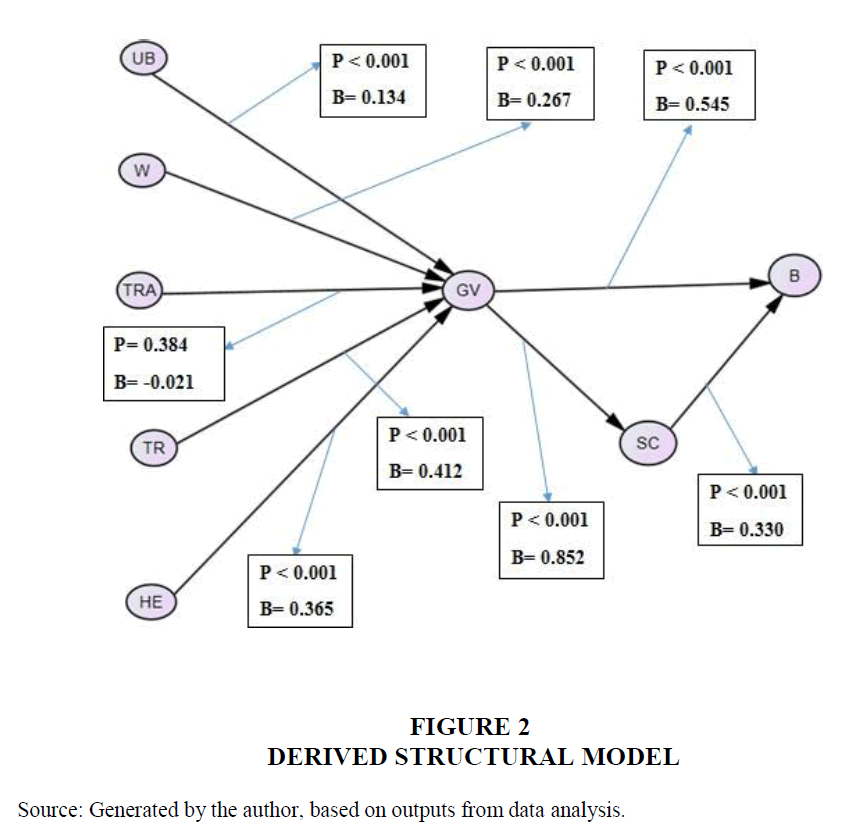
For the hypothesis to be accepted, the p-value should be less than or equal to 0.05 at a 5% significance level. The values are obtained for Beta (β) and p-value (p) from the hypotheses testing results can be evaluated. H1: utilitarian environmental benefit is positively associated with GPV (β = 0.134, p<0.001) is accepted. H2: Warm glow benefits are positively associated with GPV (β = 0.267, p<0.001) is accepted. H4: Green trust is positively associated with GPV (β = 0.576, p<0.001) is accepted. H5: Green health perception is positively associated with GPV (β = 0.509, p<0.001) is accepted. H7: GPV is positively associated with the self-brand connection (β = 0.712, p<0.001) is accepted. H8: GPV is directly associated with brand loyalty (β = 0.465, p<0.001), and associated with brand loyalty indirectly through self-brand connection (β = 0.337, p<0.001) is accepted. Since, the independent variables utilitarian environmental benefit, warm glow, green trust, and green health perception are positively related to green perceived value and the green perceived value is having a positive influence on brand loyalty. Hence the mediating relation between these independent variables and the dependent variable brand loyalty is also satisfied. Therefore, H6: GPV mediates the relationships between (a) utilitarian environmental benefit, (b) warm glow benefit, (c) perceived green transparency (d) green trust (e) green health perception and brand loyalty is accepted.
The third hypothesis H3: Perceived green transparency is positively associated with GPV, is not satisfied as the p-value is well above 0.05. This shows that there is no impact of green transparency on green perceived value.
Derived structural model
The derived model from the structured equation modelling (SEM) is depicted in Figure 2, with path coefficients and the p-values derived from the model. It established and accepted all the relationships specified in hypotheses H1 to H8, except for H3, which was rejected. It means that there is no impact of green transparency on green perceived value. The mediation results are reported in the section that follows.
Figure 2 Derived Structural Model
Source: Generated by the author, based on outputs from data analysis.
Mediation Effect of Green Perceived Value
Green perceived value (GPV) is tested to evaluate if there exists a mediating effect between the independent variables utilitarian environmental benefit (UEB), warm glow benefits (WG), green transparency (GRT), green trust (GTR), green health perception (GHP) with brand loyalty (BL) in the model as shown in Figure 2. For testing of mediating effect of GPV, the direct and indirect relationships between each of these individual variables with brand loyalty need to be established. However, since it was proved through hypothesis H3 that there is no relationship between green transparency (GRT) and green perceived value (GPV), it is not required to test the mediating effect of GPV between GRT and BL.
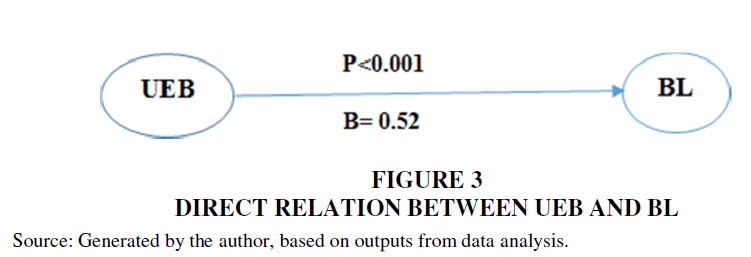
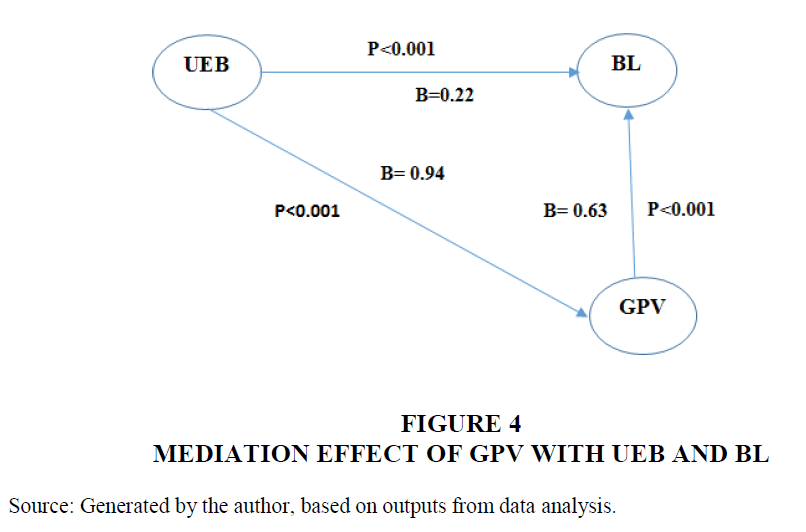
Figures 3 and 4 show the direct and indirect relationships between UEB and BL, and table 5 shows the beta values of these relationships.
Figure 3 Direct Relation between UEB and BL
Source: Generated by the author, based on outputs from data analysis.
Figure 4 Mediation effect of GPV with UEB and BL
Source: Generated by the author, based on outputs from data analysis.
| Table 5 Mediation effect of GPV with UEB and BL | ||
| STANDARDIZED ESTIMATIONS | P-VALUE | |
| UEB → BL | 0.52 | <0.001 |
| UEB → GPV, GPV → BL | 0.59 | <0.001 |
From table 5, the multiplier value 0.94 * 0.63 = 0.59, which is indicating the indirect relationship value UEB→GPV, GPV→BL, is larger than the direct relationship value of UEB →BL, which is 0.22 in figure 4. Since the direct relationship is significant between UEB to BL, there exists a partial mediation of GPV between UEB and BL.
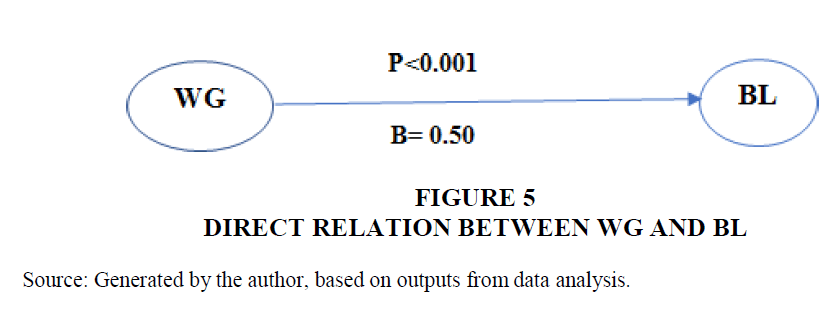
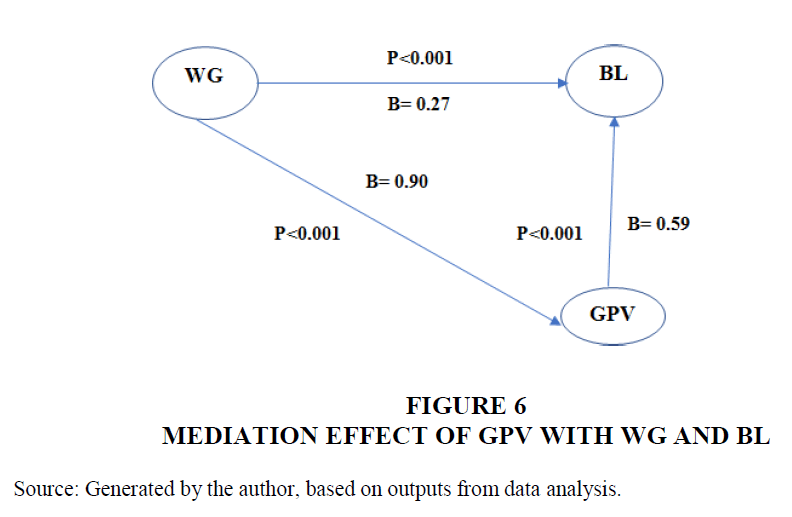
Figures 5 and 6 show the direct and indirect relationships between WG and BL, and table 6 shows the beta values of these relationships.
Figure 5 Direct Relation between WG and BL
Source: Generated by the author, based on outputs from data analysis.
Figure 6 Mediation effect of GPV with WG and BL
Source: Generated by the author, based on outputs from data analysis.
| Table 6 Mediation Effect Of GPV With WG and BL | ||
| STANDARDIZED ESTIMATIONS |
P-VALUE | |
| WG → BL | 0.50 | <0.001 |
| WG → GPV, GPV → BL | 0.53 | <0.001 |
From table 6, the multiplier value 0.90 * 0.59 = 0.53, which is showing the indirect beta value of WG→GPV, GPV→BL, is larger than the direct beta value of WG → BL, which is 0.27 in figure 6. Since the direct relation is significant, there exists a partial mediation by GPV between WG and BL.
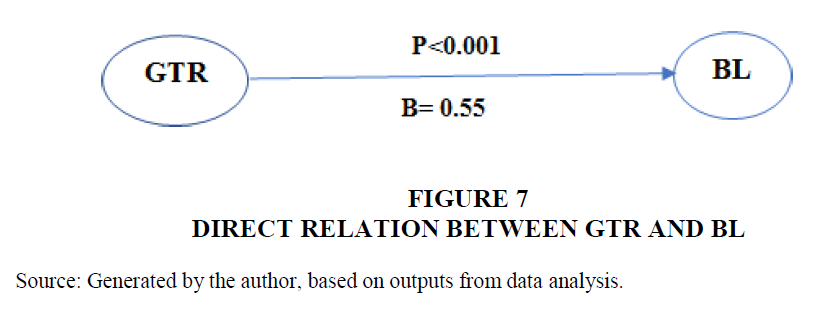
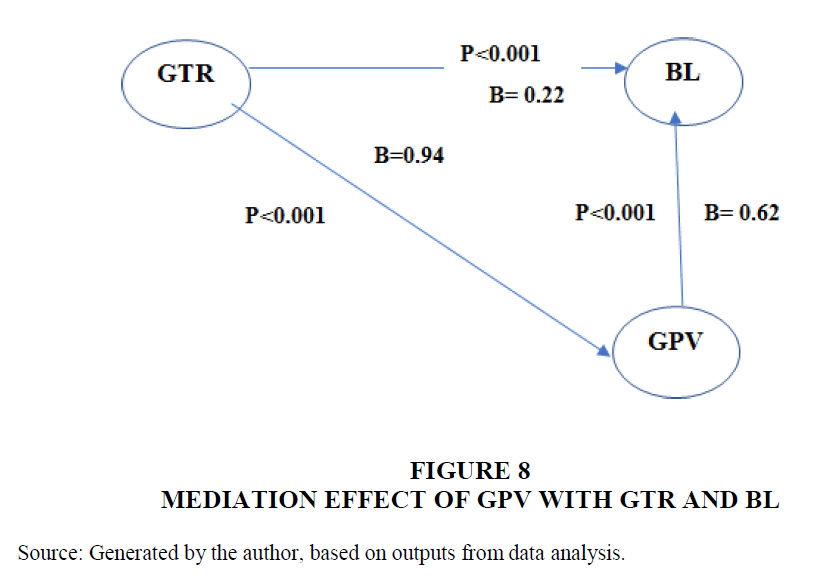
Figures 7 and 8 show the direct and indirect relationships between GTR and BL, and table 7 shows the beta values of these relationships.
Figure 7 Direct Relation between GTR and BL
Source: Generated by the author, based on outputs from data analysis.
Figure 8 Mediation effect of GPV with GTR and BL
Source: Generated by the author, based on outputs from data analysis.
| Table 7 Mediation effect of GPV with GTR and BL | ||
| STANDARDIZED ESTIMATIONS |
P-VALUE | |
| GTR → BL | 0.55 | <0.001 |
| GTR → GPV, GPV → BL | 0.58 | <0.001 |
From table 7, the multiplier value 0.94 * 0.62 = 0.58, indicating the indirect beta between GTR→GP and GPV→BL, is larger than the direct beta GTR→BL, which is 0.22 in figure 8. Since the direct relation is significant, there exists a partial mediation of GPV between GTR and BL.
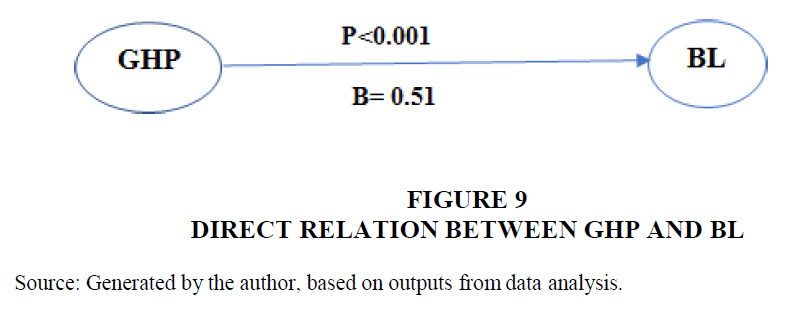
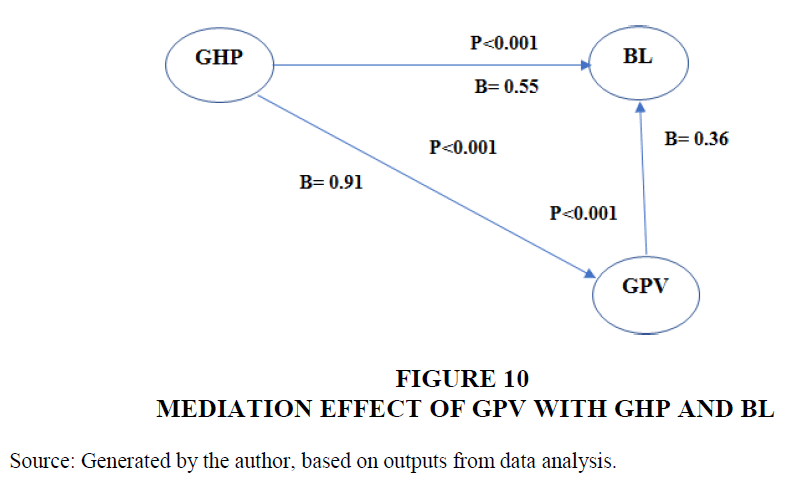
Figures 9 and 10 show the direct and indirect relationships between GHP and BL, and table 8 shows the beta values of these relationships.
Figure 9 Direct Relation between GHP and BL
Source: Generated by the author, based on outputs from data analysis.
Figure 10 Mediation effect of GPV with GHP and BL
Source: Generated by the author, based on outputs from data analysis.
| Table 8 Mediation effect of GPV with GHP and BL | ||
| STANDARDIZED ESTIMATIONS |
P-VALUE | |
| GHP → BL | 0.51 | <0.001 |
| GHP → GPV, GPV → BL | 0.33 | <0.001 |
From table 8, the multiplier value 0.91 * 0.36= 0.33, which is showing the indirect beta of GHP→GPV, GPV→BL, is less than the direct beta value of GHP→BL, which is 0.55 in figure 10. Since the direct relation is significant, there exists a partial mediation of GPV between GHP and BL.
Mediation Effect of Self-Brand Connection
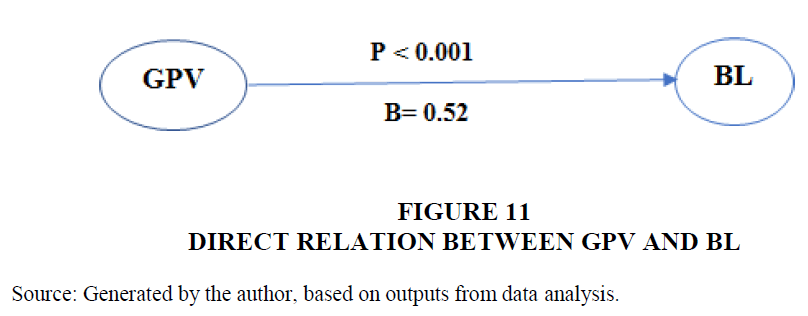
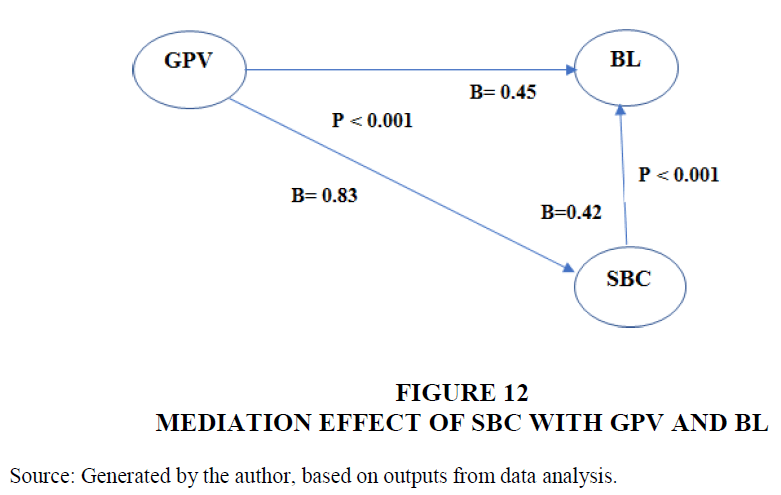
The mediation effect of self-brand connection (SBC) between GPV and BL is tested and figures 11 and 12 show the direct and indirect relationships between GPV, SBC and BL, and table 9 shows the beta values of these relationships.
Figure 11 Direct Relation between GPV and BL
Source: Generated by the author, based on outputs from data analysis.
Figure 12 Mediation effect of SBC with GPV and BL
Source: Generated by the author, based on outputs from data analysis.
| Table 9 Mediation effect of SBC with GPV and BL | ||
| STANDARDIZED ESTIMATIONS | P-VALUE | |
| GPV → BL | 0.52 | <0.001 |
| GPV → SBC, SBC → BL | 0.35 | <0.001 |
From table 9, the multiplier value 0.83* 0.42= 0.35, which is showing indirect beta of GPV→SBC, SBC→BL, is less than the direct beta value GPV→BL, which is 0.45 in figure 12. Since the direct relation is significant between GPV and BL, there exists a partial mediation of self-brand connection (SBC) between GPV and BL.
Findings and Implications
It was found that utilitarian environmental benefits (UEV) and warm glow benefits (WG) have a direct impact on green perceived value (GPV). Green trust (GTR) has a direct relationship to green perceived value and green health perception also has a direct relationship to green perceived value (GPV). However, it was found that green transparency (GRT) has no direct relationship with GPV. GPV has a direct relationship with brand loyalty and with the self-brand connection. GPV also has an indirect relation with brand loyalty via the self-brand connection. Thus, the self-brand connection has a partial mediating effect between green perceived value and brand loyalty. From the mediating test conducted, and the results discussed in the specific section, it was proved that green perceived value acts as a partial mediating variable between utilitarian environmental benefit, warm glow benefit, green transparency, green trust and brand loyalty individually. It was found that there was no relationship between green transparency and GPV, as the specific relationship was rejected while testing the hypothesis. Moreover, green perceived value has a partial mediating effect between green health perception and brand loyalty. The major finding brought from the study is how brand loyalty is created for green brands.
Contribution of the Study
Theoretical Implication
The results of the study contribute value addition to academic knowledge and add practical application and value addition to green products and brand marketing. There are many specific theoretical contributions to the study. This study found that the influential factors of utilitarian environmental benefit (UEV), warm glow benefits (WG), green trust (GTR) and green health perception (GHP) on green perceived value (GPV) and finally spearheading and leading towards building product and brand loyalty (BL). In the study, it is proved that GPV is an important attribute to measure in the case of green brands such that it will lead to enhance customer brand loyalty. These results are supported by the study (Lin, Lobo, & Leckie, 2017), which testified to the impact of UEV and WG benefits on GPV. However, the study results supported the prevalence of green transparency (GRT) on impacting GPV. However, this current study found that there is no impact of GRT on GPV. This indicated that Indian consumers trusted the products by their perceived value and green initiatives, and were oblivious to the need for brands to emphasize green transparency effects, rather focused more on UEV, WG and GHP benefits of products. A study conducted (Chen, 2010) testified factors such as green brand image, green satisfaction, green trust, and green brand equity, and their relationship with green brand equity. The results support the current study results of green trust influencing green perceived value and brand loyalty. The result supported the current study of UEB affecting brand loyalty. In another study conducted (Zameer, Wang, & Yasmeen, 2019), it was found that a green brand image has a stronger influence on customers' mindshare to create a competitive advantage. This is a substantial value addition to the literature on brand equity creation, especially for green brands.
Managerial Implications
The managerial implication of the study has ramifications not only in the Asian context but in the marketing of green products and brands across the globe. It provides solid guidance to brand marketers of organizations producing and marketing green products to concentrate on creating green perceived value as elicited in the study and communicate effectively to consumers, thereby building self-brand connection and brand loyalty, leading to customer brand loyalty and equity. To improve the customer's green value perception and lead them to brand loyalty, green brands must effectively invest in green benefit programs and effectively enforce brand marketing communications to make the customers aware of these green environmental supporting programs, thereby contributing towards brand loyalty.
The study also implies that both emotional and functional benefits have an impact on building customer brand loyalty. Therefore, brands must focus both on the environmental aspects and the functional benefits of the product to attract customers. To strengthen the link between customers' green value perception and self-brand connection, green brands should focus on advertisements that emphasize the brand features and their positive role in consumers' lives and sustainable policies. This will help in developing consumers’ affective attitudes toward green brands. This can substantially benefit green brand marketers to increase brand loyalty, awareness, association, and perceived environmental quality generation to customers, leading to enhanced brand equity and value to products and brands.
Limitations
Attributes such as customer satisfaction, product quality, product attributes and brand equity influencing brand loyalty can be considered in future studies.
Moreover, the study is only restricted to green product brands. It does not consider green services.
Conclusion and Future Implications
The study shows that green benefits (warm glow and utilitarian environmental benefits), green trust and green health perception have a positive influence on green perceived value. Green perceived value has a positive impact on self-brand connection and brand loyalty. Moreover, green perceived value has mediating relation with brand loyalty via the self-brand connection. Thus, green brands can adopt various strategies based on the above factors that influence the customers purchasing decisions so that they can build brand loyalty.
Future implications for the study can include a comparative study of the customers of different countries for finding the impact of differences in culture on their green perceived value and its impact on building brand loyalty. As the study has examined the influence of green perceived value on brand loyalty, other relational outcomes can also be examined in future research. Specifically, in future research, other attributes like brand equity are very effective in being studied as it involves brand loyalty.
Conflict of Interest
The authors certify that they have no affiliations with or involvement in any organization or entity with any financial interest, or non-financial interest in the subject matter or materials discussed in this manuscript.
Funding Acknowledgement
The authors received no financial support for research, authorship, and the publication of this article.
References
Aaker, D. A. (1996). Building strong brands. New York: Free Press.
Baker, J., Parasuraman, A., Grewal, D., & Voss, G. B. (2002). The influence of multiple store Environment Cues on Perceived Merchandise Value and Patronage Intentions. Journal of Marketing, 120- 141.
Indexed at, Google Scholar, Cross Ref
Ballester, E. D., & Alema´n, J. L. (2005). Does brand trust matter to brand equity? Journal of Product & Brand Management.
Indexed at, Google Scholar, Cross Ref
Berrone, P., Fosfuri, A., Gelabert, R.L., & Gomez-Melia, G. (2013). Necessity as the mother of ‘green’ inventions: institutional pressures and environmental innovations. Strategic Management Journal, 34: 891–909.
Indexed at, Google Scholar, Cross Ref
Chen, Yushan (2008). The positive effect of green intellectual capital on the competitive advantages of firms. Journal of Business Ethics, 271–286.
Indexed at, Google Scholar, Cross Ref
Chen, Yushan (2010). The Drivers of Green Brand Equity: Green Brand Image, Green Satisfaction, and Green Trust. Journal of Business Ethics, 307–319.
Indexed at, Google Scholar, Cross Ref
Cheng, Yushan & Chinghsun, C. (2012). Greenwash and green trust, the mediation effects of green Consumer Confusion and Green Perceived Risk. Journal Of business ethics.
Indexed at, Google Scholar, Cross Ref
Chung, Y., & Kim, A. J. (2020). Effects of mergers and acquisitions on brand loyalty in Luxury Brands: The moderating roles of luxury tier difference and social media. Journal of Business Research, 434-442.
Dwivedi, A. (2014). Self-brand connection with service brands: examining relationships with performance satisfaction, perceived value, and brand relationship quality. School of Management & Marketing, 37- 53.
Indexed at, Google Scholar, Cross Ref
Grandi, B., Burt, S., & Cardinalia, M. G. (2021). Encouraging healthy choices in the retail store environment: Combing product information and shelf allocation. Journal of Retailing and Consumer Services.
Indexed at, Google Scholar, Cross Ref
Hair, J. F., Ringle, C. M., & Sarstedt, M. (2011). PLS-SEM: Indeed a Silver Bullet. Journal of Marketing Theory and Practice, 139–151.
Indexed at, Google Scholar, Cross Ref
Harrigana, P., Eversa, U., P, M., & Daly, M. (2018). Customer engagement and the relationship between involvement, engagement, self-brand connection and brand usage intent. Journal of Business Research, 388-396.
Huang, C. C., Fang, S. C., Huang, S.-M., Chang, S.-C., & Fang, S.-R. (2014). The impact of relational bonds on brand loyalty: the mediating effect of brand relationship quality. Managing Service Quality, 184- 204.
Indexed at, Google Scholar, Cross Ref
Hur, W.-M., Kim, Y., & Park, K. (2011). Assessing the Effects of Perceived Value and Satisfaction on Customer Loyalty: A ‘Green’ Perspective. Corporate Social Responsibility and Environmental Management.
Indexed at, Google Scholar, Cross Ref
Keller, K. L. (2008). Strategic brand management. Upper Saddle River: Pearson Prentice Hall.
Lin, J., Lobo, A., & Leckie, C. (2017). The role of benefits and transparency in shaping consumers’ green perceived value, self-brand connection and brand loyalty. Journal of Retailing and Consumer Services, 133–141.
Mezger, A., Cabanela, P., Cabiddu, F., & Rüdiger, K. (2020). What does it matter for the trust of green consumers? An application to the German electricity market. Journal of Cleaner Production.
Park, H., & Kim, Y.-K. (2016). Proactive versus reactive apparel brands in sustainability: Influences on brand loyalty. Journal of Retailing and Consumer Services, 114- 122.
Indexed at, Google Scholar, Cross Ref
Patrick, H., Ibanez, A., & Vanessa. (2012). Consumer attitude and purchase intention toward green energy brands. The roles of psychological benefits and environmental concern. Journal of Business Research, 1254-1463.
Shan, C. Y., & Hsun, C. C. (2012). Enhance green purchase intentions. Journal of Management Decision, 502- 520.
Spiller, S. A., & Ariely, D. (2020). How does the perceived value of a medium of exchange depend on its set of possible uses? Organizational Behavior and Human Decision Processes, 188-200.
Indexed at, Google Scholar, Cross Ref
Zameer, H., Wang, Y., & Yasmeen, H. (2019). Reinforcing green competitive advantage through green production, creativity and green brand image: Implications for cleaner production in China. Journal of Cleaner Production.
Indexed at, Google Scholar, Cross Ref
Zeithaml, Valarie A. (1988). Consumer Perceptions of Price, Quality, and Value: A Means. Journal of Marketing, 52(2).
Received: 20-Oct-2022, Manuscript No. AMSJ-22-12704; Editor assigned: 24-Oct-2022, PreQC No. AMSJ-22-12704(PQ); Reviewed: 26-Nov-2022, QC No. AMSJ-22-12704; Revised: 23-Dec-2022, Manuscript No. AMSJ-22-12704(R); Published: 14-Jan-2023
