Research Article: 2021 Vol: 25 Issue: 3
Financial Integration and Economic Growth In the Southern African Development Community.
Ch. Paramaiah, Skyline University College
Sello M.N. Lesotho Revenue Authority Lesotho
Pranav Kumar, Skyline University Machema R, National University of Lesotho
Abstract
Introduction
Deciphering the causes of economic growth has for ages been one of the central issues in macroeconomics. Among the many scholars that have weighed in on causes of economic growth is Solow (1956), who proposed that economic growth is caused by savings. According to Solow (1956) the growth-augmenting effect of savings depends on the ability of savings to result in a corresponding increase in investment which eventually leads to economic growth and development. Thus, one of the implications of Solow (1956)’s proposition is that economic growth can be achieved by increasing the savings rate. This is because capital mobility allows consumption-smoothing, reducing risk, and stimulates investment and hence economic growth beyond the limits of domestic savings.
Prasad et al. (2007) also notes that capital flows boost a country’s growth and by extension alleviates poverty by augmenting domestic savings, reducing the cost of capital, increasing productivity through transferring technological knowledge, and stimulating the domestic financial sector development. Because of the positive effect of capital flows on economic growth alluded to above that financial integration has increased worldwide. Specifically, this integration has been due to the increased globalisation of investments in search of better returns and risk diversification opportunities. In addition, most countries have endeavoured to entice capital inflows by liberalising restrictions on capital flows as well as deregulating financial markets (Agenor, 2003).
Despite the abovementioned benefits of financial integration, Yang (2012) postulates that there are some arguments against financial integration. First, countries plagued with weak institutions and information asymmetries may lack the ability to absorb external capital into new investment if they are integrated into international financial markets. Second, financial integration may also increase risk, which would undermine financial stability in developing countries that lack well-established financial systems and good policies to regulate financial systems. According to Aziakpono (2013) financial integration benefits developing countries remains debatable, he argues that both economic theory and empirical literature offers different views on the effect of financial integration in an economy. Theory suggests both benefits and costs of integration, while empirical literature conflicting evidence on the effect of financial integration on economic growth.
The financial integration in most of the African countries initiated through capital account liberalization is one the development strategies. Misati et al. (2015), in their study highlight that existing evidence suggests that not all African countries were able to attain the positive growth- effects of financial integration. Kargbo (2017) has postulated that FDI is an important source of external finance that can boost domestic investment and employment in developing countries, Kargbo (2017) also noted that FDI can also boost long term growth, by transferring technology and knowledge from foreign firms to domestic firms. One of the objectives of the SADC is to foster economic growth, eliminate poverty, and thus enhance the standard of living and quality of life of its community This implies that SADC views integration as one of the means that would improve the welfare of its citizens. There are few studies that have been carried out for the case of SADC have several weaknesses which necessitate further investigation of the subject. For instance, Misati et al. (2015) have studied financial integration and economic growth in SADC but their study utilises a methodology which only caters for endogeneity in their estimation but it does not emphases the possibility that SADC countries might be pursuing similar economic policies by virtue of having the same integration objective implying therefore that there might be a possibility of cross-country interdependence in the region.
There are different opinions on the relationship between financial integration and economic growth. Those conflicting views then raises the following empirical question, is financial integration related to economic growth? This question is even more relevant in the case of SADC, where financial integration has been identified to boost the region’s economic growth. There is need to investigate the relationship in the case of SADC to ascertain whether attempts to foster financial integration in SADC will not be a futile exercise. There have been studies carried out to examine the relationship between financial integration and economic growth, however, such studies have been found to have several weaknesses which further necessitate the need to carry out the investigation further in this paper.
Objectives of the Study
To assess the relationship between financial integration and economic growth in the SADC. To assess the relationship between financial integration and economic growth for each SADC member state.
Economic Performance In Sadc
The SADC region is the largest contributor of GDP growth in Africa, contributing about 54.3 percent of the nominal GDP of Sub-Saharan Africa (Mosikari et al. 2016). Allen and Ndikumna (2000) have highlighted that the individual SADC countries have fared differently, due to wars, political instability, droughts, bad economic policy that have resulted in many member states enduring harsh economic conditions. It is evident from table 1, that the combined SADC countries average growth rate from 2012 to 2015 was 3.6 percent. The countries with the highest growth rate during the same period were the DRC which recorded an average growth rate of 7.5 percent, followed by Mozambique and Tanzania that respectively recorded average growth rates of 7.1 percent and 6.9 percent.
| Table 1 SADC Countries’ GDP Growth Rates (%) | ||||||
| Country | 2011 | 2012 | 2013 | 2014 | 2015 | Average |
| Angola | 4.1 | 8.8 | 5.0 | 4.0 | 0.9 | 4.6 |
| Botswana | 6.0 | 4.5 | 9.9 | 3.2 | -0.3 | 4.7 |
| DRC | 6.9 | 13.4 | 2.4 | 7.2 | 7.7 | 7.5 |
| Lesotho | 7.0 | 5.4 | 2.0 | 4.5 | 1.6 | 4.1 |
| Madagascar | 1.5 | 3.0 | 2.3 | 3.3 | 3.1 | 2.6 |
| Malawi | 4.9 | -0.6 | 6.3 | 6.0 | 6.0 | 4.5 |
| Mauritius | 4.1 | 3.6 | 3.5 | 3.9 | 3.6 | 3.7 |
| Mozambique | 7.1 | 7.2 | 7.1 | 7.4 | 6.6 | 7.1 |
| Namibia | 5.1 | 5.1 | 5.7 | 6.5 | 5.3 | 5.5 |
| Seychelles | 5.4 | 3.7 | 5.0 | 6.2 | 6.8 | 5.4 |
| South Africa | 3.3 | 2.2 | 2.3 | 1.6 | 1.3 | 2.1 |
| Swaziland | 2.0 | 4.1 | 4.7 | 3.3 | 1.3 | 3.1 |
| Tanzania | 7.9 | 5.1 | 7.3 | 7.0 | 7.0 | 6.9 |
| Zambia | 5.6 | 7.6 | 5.1 | 4.7 | 2.9 | 5.2 |
| Zimbabwe | 11.9 | 10.6 | 4.5 | 3.8 | 1.7 | 6.5 |
| Total SADC | 4.2 | 4.6 | 3.7 | 3.3 | 2.4 | 3.6 |
According to the IMF (2014), the mining sector was one of the main drivers of growth in the DRC, particularly copper production with the commercial and construction sector also performing well. Mining and quarrying were also the main driver of Mozambique’s growth as well as agriculture, transportation and communication, and financial services (CBL 2014). The Tanzanian economy on the other hand was driven by construction, trade and repairs, agriculture, transport, storage, and manufacturing. In terms of the contribution to the total SADC GDP growth, Table 2 shows that South Africa is the largest contributor with an average contribution of 53.6 percent from 2011 to 2015. Angola and Tanzania are the next biggest contributors with averages of 18.5 percent and 6.1 percent, respectively.
| Table 2 Variables and Sources of Data | ||||
| Variable | Acronym | Description | Source | Expected sign |
| Real GDP growth | GR | Real GDP growth (annual %) | WDI | n/a |
| Financial Integration | FI1 | Chin-Ito index | Chin & Ito database | + |
| FI2 | Foreign direct investment (% of GDP) | WDI | + | |
| Openness | OPEN | (Imports + Exports) of goods and Services (% of GDP) | WDI | + |
| Inflation | INFL | Consumer price inflation (annual % changes in CPI) | WDI | +/- |
| Government | GOV | General Government final consumption expenditure (% of GDP) | WDI | +/- |
| Investment | INV | Gross Fixed Capital formation (% of GDP) | WDI | + |
| Private Sector Credit | PSC | Private sector credit extension (% of GDP) | WDI | + |
Review of Literature
Financial integration is a concept that has been around in the economics literature for aeons. However, the literature still lacks a standard definition of financial integration. Edison et al. (2002) defines it as “the degree to which an economy does not restrict cross-border transactions”. Perea & Nieuwenhuyze (2014) add to this definition by putting forth that financial integration can be defined along two axes, namely, from a legal and institutional point of view which is a de
jure definition and from a factual basis which is a de facto definition. They note that the de jure definition captures the degree to which a country’s policies enable cross-border capital movements, and is a pre-requisite for the de facto financial integration. Perea & Nieuwenhuyze (2014) note also that though de jure and de facto financial integration are closely related, adopting policies that facilitates financial integration does not automatically result in capital flows nor does such policies imply anything on the magnitude of the flows.
Schmukler (2004) emphasised that the integration occurs when both the domestic financial system and the capital account liberalises this will influence the economies to experience an increase in cross country capital movements. Prasad et al. (2003) highlighted that financial globalisation and financial integration are different concepts, according to them financial globalisation is concept that refers to global linkages arising from cross border financial flows, whereas financial integration refers to a country’s integration to global financial markets. Despite noting these differences Prasad et al. (2003) continue to use financial globalisation and financial integration interchangeably.
According to Edison et al. (2002) the most used measure of government restrictions on international financial transactions is the International Monetary Fund (IMF)’s restriction measure. The data for the measure is derived from the IMF’s Annual Report on Exchange Arrangement and Exchange Restriction (AREAER) line E.2 on its summary table. Quinn (1997) developed a new measure, that captures the differing degrees of openness on a scale of 0-14 in 0.5-point increments. It is important to note that the basis of the Quinn (1997) index was the IMF AREAER measure, this is because Quinn (1997) developed the index by coding three aspects of the IMF measure, namely the capital account transaction, current account transaction and the aspect on the binding international agreement that a country has that limits its ability to restrict exchange and capital flows. The Quinn (1997) index is also not free from criticism Edison et al. (2002) note one of the index’s weaknesses as that, it is subjective.
In their study Kose & Prasad (2004) emphasised that the more efficient global allocation of capital from capital rich industrial countries to capital poor developing economies through financial integration. This results in higher rates of return on savings for residents of industrial countries and by increasing growth in developing countries. Obstfeld (1994) provides a similar view to that of Kose and Prasad (2004) by developing a model of global portfolio diversification that spells out the link between growth and financial integration. Obstfeld (1994)’s model assumes that each country can invest in two linear projects, with one safe and the other risky.
Methodology and Data Description
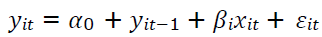
The study employs analytical framework to address its objectives of establishing the relationship between financial integration and economic growth, the following dynamic panel data model is specified:
 (1)
(1)
Where:
yit is a measure of economic growth for country i at time t and i = 1... N and t = ... T, xit is a vector of control variables, βi is a vector of regression coefficients and εit is a vector of white noise error terms.
The financial integration and economic growth was measured by using two measures for robustness, one measure being a de jure measure of financial integration while the other is a de facto measure. Specifically, the measures used are FDI flows as a portion of GDP and the Chin- Ito index. The motivation for using the Chin-Ito Index stems from the fact that as the latest measure amongst the de jure measures, it has attempted to address the several weaknesses of the previous de jure measures. The ratio of FDI to GDP is used as it is usually considered one of the major sources of capital inflows to developing countries. Moreover, unlike other measures that have been used in the literature such as portfolio flows, FDI is applicable to the case of SADC which is a region that an underdeveloped capital market. Moreover, because FDI is stickier than the other measure it is mostly relevant in studying the relationship with growth as other measures are more volatile and can therefore best be used in studying growth volatility.
Data Sources
The study uses annual secondary data from 1985 to 2015. The data was collected from World Bank’s world development indicators and Chin-Ito index. The measure of financial integration is sourced from the Chin and Ito database.
Panel Unit Root Rests
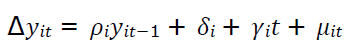
To avoid spurious results the study begins by assessing the unit root properties of the data. To undertake this task, the Im, Pesaran and Shin (2003) (IPS) and the Maddala and Wu (1999) Augmented Dickey Fuller –Fischer (ADF-F) panel unit root tests are carried out to test for the presence of unit root in the dataset. The IPS unit root test as the following univariate process;
 (2)
(2)
Where δi is the country specific fixed effect, t is the time trend, �� is the white noise error terms while ρi ρi is the autoregressive coefficient. It should be noted that when ρi = 1 then yit has a unit root. The IPS test assumes different ρi for every cross section. The ADF-F type test is also used due to its ability to handle unbalanced panels; the test also outperforms the IPS test (Knust 2011). To account for the heterogeneity in the dataset the study utilises the Fixed Effect (FE) estimator. The distinguishing feature of the Fixed Effect (FE) estimator is that it first, assumes a similar slope coefficient for countries in a panel. Second, its error term is made up of three factors namely, the unobserved individual effect, unobserved time effect and the stochastic term. Third, it allows for a country specific intercept which is time-invariant, hence the name fixed effect.
Analysis of Resutls
The study begins by undertaking a casual inspection of the data. Table 3 reports the measures of central tendency of the data and reveals that growth in the SADC has averaged 3.69 percent with the highest growth rate reported as 26.8 percent, which was recorded by Mozambique.
| Table 3 Measures of Central Tendency of all the Variables | |||||
| Variable | Obs. | Mean | Std. Dev. | Min | Max |
| GR | 230 | 3.69 | 5.53 | -16.99 | 26.84 |
| FI1 | 227 | -0.58 | 1.19 | -1.90 | 2.37 |
| FI2 | 230 | 2.30 | 3.10 | -6.89 | 17.02 |
| OPEN | 230 | 79.97 | 39.40 | 14.32 | 187.39 |
| INFL | 227 | 283.61 | 2276.44 | -1.22 | 24411.03 |
| GOV | 230 | 17.38 | 8.05 | 2.05 | 47.19 |
| INV | 228 | 18.44 | 7.30 | 2.00 | 41.48 |
| PSC | 219 | 27.22 | 32.98 | 0.49 | 160.12 |
Seychelles has recorded the highest ratio of foreign direct investment to GDP at 17.02 percent in 2007 which is above the regional average of 2.30 percent. Government expenditure is found to average 17.38 percent of GDP, with the country that has had the lowest government expenditure ratio being the DRC in 2000 at 2.05 percent.
Results of Panel Unit Root Tests
The first step before carrying out unit root tests is to determine the type of test equation to be used. To help in making this decision the study begins by carrying out a visual inspection of the data, thereafter an appropriate test equation is decided upon and used. The results of the panel unit root tests are reported in Table 4. The table shows that both unit root tests reveal that the variables are stationary as such all variables used in this study are in levels.
| Table 4 Panel Unit Root Test Results | |||
| IPS | ADF-F | Decision | |
| GR | -4.01* | 15.55* | I(0) |
| [0.00] | [0.00] | ||
| FI1 | -2.04** | 50.24* | I(0) |
| [0.02] | [0.00] | ||
| FI2 | -2.97* | 80.00* | I(0) |
| [0.00] | [0.00] | ||
| OPEN | -2.46* | 70.21* | I(0) |
| [0.00] | [0.00] | ||
| INFL | -1.94** | 55.60* | I(0) |
| [0.01] | [0.00] | ||
| GOV | -2.36* | 81.72* | I(0) |
| [0.00] | [0.00] | ||
| INV | -2.59* | 38.31* | I(0) |
| [0.00] | [0.00] | ||
| PSC | -1.98*** | 49.09* | I(0) |
| [0.07] | [0.00] | ||
Diagnostic Tests Results
The starting point before carrying out the three-panel data econometric techniques outlined in the preceding chapter is to assess whether they are appropriate for the study’s dataset. Consequently, the study began by undertaking the F-test for parameter homogeneity. As aforementioned the fixed effect estimator allows for a country specific intercept, thereby assuming parameter heterogeneity, hence the need to first assess whether the condition of parameter heterogeneity is satisfied in this case. The null hypothesis of the F-test is that there are no individual effects as such all parameters are homogeneous. From Table 5 indicates that for both models estimated under the fixed effect estimator the F-statistic is equal to 3.32 and 3.29. Since both statistics are greater than 0.05, the null hypothesis is rejected and therefore there is existence of heterogeneity as the intercepts are different from zero. The fixed effect estimator is therefore appropriate in this case.
| Table 5 Dynamic Fixed Effect Estimator Results | ||
| FE | Model 1 | Model 2 |
| FI1 | 0.64 (1.36) |
|
| FI2 | 0.36** (2.33) | |
| GR(-1) | 0.18*** | 0.16** |
| (2.66) | (2.30) | |
| OPEN | 0.03* | 0.01 |
| (1.66) | (0.39) | |
| INFL | -0.00 | -0.00 |
| (-0.98) | (-0.96) | |
| GOV | -0.35*** | -0.30*** |
| (-3.42) | (-2.96) | |
| INV | 0.05 | 0.01 |
| (0.20) | (0.08) | |
| PSC | -0.05* | -0.04 |
| (-1.75) | (-1.60) | |
| F-test | F(9,199) = 3.32 Prob > 0.00 |
F(9,199) = 3.29 Prob > 0.00 |
Having carried out the system GMM technique, the study then tests for the over-identification of restrictions using the Sargan tests for both models estimated using the system GMM, the tests are carried out under the null hypothesis that the over-identifying restrictions are valid. From Table 6 the p-values for both models are 1.00, which is greater than 0.05. As a result, the study fails to reject the null hypothesis and therefore concludes that the instruments are valid.
| Table 6 Dynamic System GMM Results | ||
| Model 1 | Model 2 | |
| FI1 | 1.20** (2.78) | |
| FI2 | 0.37** (2.53) | |
| GR(-1) | 0.11** (2.11) |
0.09* (1.65) |
| OPEN | 0.03* (1.77) | 0.01 (0.71) |
| INFL | -0.00 (0.04) |
-0.00 (0.17) |
| GOV | -0.25*** (-3.30) | -0.24*** (-3.09) |
| INV | 0.08 (1.24) |
0.08 (1.20) |
| PSC | -0.14*** (-4.35) | -0.11*** (-3.64) |
| Sargan test AR(2) | P-value = 1.00 P-value = 0.26 |
P-value = 1.00 p-value = 0.27 |
To test for autocorrelation the study uses the autocorrelation test of order two. The null hypothesis of the test is that there is no autocorrelation. The results of the tests reported in Table 6 shows that the study rejects the null hypothesis and concludes that there is no second order serial correlation.
Effects of Financial Integration on Economic Growth
The results of the System GMM and the fixed effect estimation technique are reported in Table 5 and 6.
The results reveal that financial integration as measured by the Chin-Ito index has a positive effect on economic growth, the effect is however found to be statistically insignificant in the fixed effect results but statistically significant in the system GMM model result.
Tables 7 and 8 takes the analysis further by depicting the financial integration and economic growth nexus for different countries in the SADC region. Table 7 reveals that the Chin-Ito index has a positive effect on economic growth in all countries except the Democratic Republic of Congo, Madagascar, and Seychelles, where the relationship between financial integration and economic growth is found to be negative. It is evident from the table 8 that financial integration exerts a positive effect on economic growth in most of the countries except for Madagascar, Malawi, South Africa, and Swaziland where the effect is found to be negative by using the ratio of FDI to GDP. The negative effect of financial integration in some of the SADC countries might suggests that financial integration acts as a conduit that transmits negative shocks that then result in financial crises and a decline in economic growth. The positive relationship of financial integration and economic growth in some countries suggest that for those countries financial integration provides the means with which additional funds are brought to those countries to finance investment expenditure and thus lead to economic growth.
| Table 7 Seemingly Unrelated Regression Results Using the Chin-Ito Index | ||||||
| FI1 | OPEN | INFL | GOV | INV | PSC | |
| Botswana | 0,91 (1.10) |
0,16** (2.31) | 0,20 (0.87) |
-0,44** (-2.49) | 0,26 (1.25) |
-0,45* (-1.91) |
| DRC | -32,87*** (-4.58) | 0,0** (2.26) | -0,00*** (-3.34) | -1.11*** (-6.65) | -0,26* (-2.10) | 2,25* (1.98) |
| Madagascar | -5,88 (-1.56) |
0,27** (2.36) | -0,21* (-2.10) | 0.02 (0.03) |
-0,19 (-0.62) |
-0,311 (-0.78) |
| Malawi | 4,76 (1.30) |
-0,25** (-2.16) | 0,15** (2.14) | -0,49* (-2.06) | 0,47* (1.98) | -0,59* (-1.86) |
| Mauritius | 1,29 (1.52) |
-0,04 (-0.84) |
-0,13 (-0.91) |
-0,72 (-1.37) |
0,20 (1.15) |
-0,13 (-1.66) |
| Mozambique | 2,36 (0.35) |
-0,18** (-2.15) | -0,00 (-0.03) |
-0,43 (-1.37) |
0,50 (1.56) |
-2,04** (-2.69) |
| Table 8 Seemingly Unrelated Regression Results Using The Ratio of FDI To GDP | ||||||
| FI2 | OPEN | INFL | GOV | INV | PSC | |
| Botswana | 0,06 (0.32) |
0,19** (2.39) | 0,01 (0.03) |
-0,48** (-2.81) | 0,48*** (3.04) | -0,28 (-1.45) |
| DRC | 0,50 (1.50) |
0,10 (1.55) |
-0,00 (-0.93) |
-0,77*** (-4.59) | 0,03 (0.27) |
2,92** (2.25) |
| Madagascar | -0,88 (1.23) |
0,24** (2.19) | -0,07 (-0.95) |
1,14 (1.24) |
-0,07 (-0.19) |
0,15 (0.58) |
| Malawi | -0,30 (-0.32) |
-0,37** (-2.60) | 0,25*** ((3.57) | -0,38 (-1.45) |
0,48* (1.79) | -0,56 (-1.27) |
| Mauritius | 0,92*** (3.60) | -0,02 (-0.57) |
-0,19 (-1.40) |
-0,20 (-0.39) |
0,01 (0.06) |
-0,07* (-1.98) |
| Mozambique | 0,32 (0.53) |
-0,10 (-1.28) |
-0,00 (0.06) |
-0,65** (-2.25) | 0,33 (1.32) |
-2,05*** (-4.40) |
| Seychelles | 0,70** (2.39) | 0,09* (1.75) | -0,86** (-2.41) | -0,60** (-2.46) | -0,22* (-1.76) | -0,60* (-1.83) |
| South Africa | -0,14 (-0.89) |
0,17*** (3.68) | -0,22** (-2.14) | 0,64 (1.41) |
0,01 (0.07) |
-0,00 (-0.38) |
| Swaziland | -0,0.4 (-0.18) |
0,24*** (3.19) | 0,41** (2.41) | -0,56 (-1.72) |
-1,42*** (-4.70) | 0,32 (1.13) |
| Zimbabwe | 1,68** (2.18) | -0,24** (-2.71) | -0,00 (-1.56) |
-0,27 (-1.18) |
0,25* (1.77) | -0,12** (-2.54) |
| Breusch-Pagan LM test | X2(45) = 75,46 Prob = 0,00 |
|||||
Effects of Control Variable on Economic Growth
The lagged values of economic growth are found to exert a positive and significant effect on economic growth in all the models estimated. This is in line with expectations and suggests that previous level of economic growth influences current growth rates. The results of trade openness are in line with expectations and confirm the notion that as countries export, they stimulate the inflow of funds in the domestic economy particularly foreign exchange. Moreover, in some countries to produce the products to be exported there is need for raw materials which are imported from other countries. The results also in line with Allen and Ndikumana (2000) that found there is positive relationship between trade openness and economic growth. Inflation retains a negative relationship with economic growth however, the relationship is statistically insignificant and negligible under both the system GMM and fixed effect estimation. It is worth noting that these results are different from those of Seleteng (2012), who found inflation to have a statistically significant relationship with economic growth.
The results show that there is a negative and statistically significant relationship between government consumption and economic growth, in all the models estimated. The results seem to suggest that government consumption in the SADC has crowded out private investment. Moreover, it could be that majority of government consumption in the SADC region is skewed towards recurrent expenditure and not capital expenditure. Investment has a positive relationship with economic growth though the relationship is statistically insignificant. These results imply that the lack or slow economic growth in the SADC cannot be blamed on lack of domestic investment. Contrary to expectations, private sector credit is found to have a negative relationship with economic growth in all the models estimated. The negative relationship is found to be statistically significant in the system GMM results only. These surprising results are in line with those of Allen & Ndikumana (2000).
Conclusion
The study investigated the relationship between financial integration and economic growth in the SADC region. Three panel data econometrics techniques were then used namely the fixed effect estimator, the system generalised method of moments and the seemingly unrelated regression. The study has found out that financial integration is positively related to economic growth, the results were found to be mostly significant statistically when measuring financial integration by the ratio of FDI to GDP. Based on these results the study then concludes that financial integration is positively related to economic growth in the SADC. Investigating the relationship for individual countries result in mixed findings as the relationship is negative in some countries while it is positive in some.
References
- Agénor, P.R. (2001). Benefits and costs of international financial integration: theory and facts, The World Economy,
- 26(8).
- Ahmed, A.D. (2011). International financial integration, investment and economic performance in Sub-Saharan African countries, Global Economy Journal 11(4).
- Allen, D.S. & Ndikumana, L. (2000). Financial intermediation and economic growth in Southern Africa, Journal of African Economics, 9(2).
- Aziakpono, M.J. (2013). Financial integration and economic growth: Theory and a survey of evidence. Studies in Economics and Econometrics, 37(3), 61-86.
- Central Bank of Lesotho (2014). Integrated paper on recent developments in SADC, paper prepared for the committee of Central Bank Governors in SADC.
- Edison, H. Levine, R. Ricci, L. and Slok, T. (2002) “International financial integration and economic growth” Journal of International Monetary and Finance, 21(6): 749-776.
- Im, K.S., Pesaran, M.H., & Shin, Y. (2003). Testing for unit roots in heterogeneous panels. Journal of econometrics, 115(1), 53-74.
- International Monetary Fund (2014) “Democratic Republic of the Congo” IMF Country Report No. 14/301.
- Kargbo S.M. (2017), Foreign direct investment and economic growth in Africa, PhD Thesis, University of Cape Town. Kose, M.A. Prasad, E.S. and Taylor, A.D. (2011) “Thresholds in the process of international financial integration”
- Journal of International Money and Finance 30(2011): 147-179.
- Maddala, G.S. and Wu, S. (1999), A comparative study of unit root tests with panel data and a new simple test, Oxford Bulletin of Economics and Statistics, special issue: 631-665.
- Mosikari, T.J. Senosi, M.C. & Eita, J.H. (2016). Manufactured exports and economic growth in Southern African Development Community (SADC) region: A panel cointegration approach, Acta Universitatis Danubius: Oeconomica 12(5): 266-278
- Obstfeld, M. (1994). Risk-taking, global diversification, and growth, The American Economic Review, 84(5): 1310- 1329.
- Prasad, E. Rogoff, K. Wei, S. & Kose, M.A. (2003). Effects of financial globalization on developing countries: some empirical evidence, International Monetary Fund, Occasional paper 220.
- Prasad E.S. Rogoff K. Wei, S. & Kose, M.A. (2007). Financial Globalization, Growth, and Volatility in Developing Countries, In Harrison A (eds.), Globalization and Poverty, University of Chicago press
- Quinn, D. (1997). The correlates of change in international financial regulation, American Political Science Review, 91(3): 531-551.
- Schmukler S.L. (2004) “Financial globalisation: gain and pain for developing countries” Federal Reserve Bank of Atlanta, Economic Review.
- Seleteng, M. (2012). Inflation and economic growth nexus in the Southern African Development Community: a panel data investigation” PhD Thesis, University of Pretoria.
- Solow, R.M. (1956) “A contribution to the theory of Economic Growth” The Quarterly Journal of Economics, 70(1): 65-94.
- Yang X (2012). Essays on financial integration, financial development and economic growth, PhD Thesis, Vanderbilt University.