Research Article: 2021 Vol: 22 Issue: 2
Financial literacy and portfolio diversification:The role of moderators
Mehdi Malekpour, University of Tabriz
Alireza Fazlzadeh, University of Tabriz
Younis Jabarzadeh, University of Tabriz
Abstract
In this paper, we have focused on financial literacy as the primary predictor of portfolio diversification in investors. In contrast to other similar studies which use socio-demographic variables as control, we used socio-demographic variables as moderating variables. We have used multiple regressions to analyze the model. Results show that although financial literacy is an acceptable predictor of portfolio diversification (R Squared = 0.122; p < .01), importing moderating variables improves the model significantly (R Squared = 0.868; p < .01). Financial education of investors according to their group differences is the main suggestion we have proposed in this paper. Between group differences, such as differences in gender and age groups, suggest that focusing on investors' financial educations must be different according to their groups. In the end, as a separate part in appendix, we have collected a comprehensive review of financial literacy definitions and measurement methods, introduced by different researchers which were necessary in this field.
Keywords
Financial Literacy, Stock Market, Diversification.
JEL-code
C88; G11; G12; I31
Introduction
Current economic conditions raise serious concerns about the economic security of people, particularly for those who lack the necessary skills and resources to deal with disadvantages and to benefit from advantages of financial markets. Governments have shifted the responsibility of financial decisions to people. Nowadays, people are the primary decision makers of their investment behaviors, but researchers show that people do not have the required levels of financial literacy to make good decisions. For instance, making a decision about retirement planning is one of the most important financial decisions which people have got. As financial decisions of people get more complicated, troubles about decision-making in these areas increase (Mandell & Klein, 2007). Financial problems of people in recent years show that they make financial decisions without having the right tools in hand (Consumer Federation of America, 1991). One difficulty in poor financial decision making is that its outcomes are hidden in the short term and get revealed only over longer periods of time. Researchers suggest that poor financial decisions are going to become a pandemic problem; therefore, policymakers are faced with a new problem: poor financial decisions made by individual investors (Danes & Hira, 1987). However, this is not the end of the story. Several studies in the US and many other countries have shown that the financial literacy level of young people is considerably low (Jumpstart Coalition, 1997; 2000). For countries which have more young population, the importance of financial literacy will become more evident. When a country has large percentages of the young population, due to their future retirements and because of the shifted responsibility for decision-making about financial issues, the financial crisis in the future of that country will be more probable. All of the above mentioned reasons show that financial knowledge is necessary; especially for those who are responsible for complex financial decisions.
Financial literacy is essential for the appropriate functioning of financial markets. Poor financial literacy of people will lead to participation problems in financial markets (Morton, 2005; Greenspan, 2003; 2005). Recent studies show that poor financial literacy is the foundation of all of the abovementioned financial problems (Hilgert et al., 2003; Braunstein & Welch, 2002). It seems that as people are less literate financially, they make more inappropriate financial decisions and are more likely to face financial problems in future. Lusardi and Mitchell (2007a; 2007b) Note that financial decisions are complex in nature and cannot be considered as easy decisions. People have to gather and process data related to issues such as simple and compound interest rates, inflation, risk diversification, and so forth. To handle their financial decisions, people need to acquire knowledge about this essential financial information as well as some financial tools to avoid financial mistakes (Ferguson, 2002).
Given the importance of investors’ financial literacy, the main question of the current study is the following: Is there any relationship between an investor’s financial literacy and his or her portfolio diversification? And if there is, how important variables like demographic ones affect this relationship? In this paper, we show that financial literacy is an important factor that can explain these behaviors. One could raise the concern that previous studies have documented this phenomenon but we want to emphasize that the contribution of our paper is the new model we propose. All previous models have used some control variables, but in this study, we suggest new roles for variables such as age and gender to develop a more robust model.
Another contribution of this paper to research society is its target population. None of the previous researches about financial literacy and portfolio diversification have chosen a special market population to examine. In this paper, we have focused on stock market investors to make our conclusions narrower and also more accurate, specified for that special population.
This paper consists of six sections. The first section is a comprehensive introduction to the backgrounds and aims of the paper. We have done a thorough literature review in the second section of the article. What we have tried to do in this part was a comprehensive study of related literature and examining main variables from different perspectives of other researchers. In the third section, we have covered the methodology of the paper: how we have gathered the sample, the descriptive statistics of gathered data and some extra investigations about them. Choosing the sample size using Cochran's formula, assessing the reliability factor of the questionnaire using Cronbach's alpha and some simple statistical assessments are considered in this section, as well. The fourth section is pursuing the main goal of the paper: assessing our hypothesis about the relationship between financial literacy and portfolio diversification after importing moderators. According to previous literature review, increasing financial literacy is a reason to increase portfolio diversification (Mouna & Jarboui, 2015). What we have done new in this article is that we have considered some variables as moderators of the relationship between financial literacy and portfolio diversification. Our statistical results show that the supposed relationships are statistically significant in the 0.01 significance level. Changing the diversification index from number of stocks to the Herfindahl index is another step we have taken in this section. Finding a robust factor for future investigations is our main goal in this substitution. In the last part of the fourth section, we have compared our ten item questionnaire with Lusardi's three item questionnaire to find if the number of different question can lead us to better information about the relationship or not. In the last section, we have commented about the results of our survey and made some suggestions about them to complete the results.
Literature Review
What is Financial Literacy?
Literacy is the ability to read and to write (Zarcadoolas et al., 2009), but by using this definition, we cannot conclude that financial literacy is the ability to read and to write financial texts. It is obvious that literacy is something more than just reading and writing. This definition lacks components like comprehension. Merriam-Webster dictionary adds knowledge to reading and writing abilities and improves the definition (Merriam-Webster's Collegiate Dictionary, 1999). There are lots of definitions for financial literacy in the literature, most of them begin with simple descriptions like financial knowledge (Hilgert et al., 2003) or more sophisticated ones like financial intelligence (Kamil et al., 2014). However, almost all of them are trying to define a universal concept: Financial Literacy. After assessing different interpretations presented in various studies, primary components of all definitions are derived and described in Table 1. To see some definitions about financial literacy, one can see works done by Kim (2001); Fox et al. (2005); Lusardi and Tufano (2009); Fernandes et al., (2014); Lusardi et al., (2014).
| Table 1 Principal Components of Financial Literacy and Their Frequency Used by Different Researchers in Literature | |
| Components considered | Number of Researchers |
| Financial Knowledge | 24 Researchers |
| Personal Finance | 2 Researchers |
| Financial Decision-Making | 12 Researchers |
| Financial Skill | 3 Researchers |
| Access to Financial Markets | 1 Researcher |
| Focusing on Financial Debt | 2 Researchers |
| Financial Well-Being | 11 Researchers |
| Credit Knowledge | 1 Researcher |
In Table B-1 in Appendix B, we have listed different definitions of financial literacy used by different researchers. We think that this table and Table B-2 are the most thorough literature review of financial literacy definitions and measurements that has been done till now.
How to Measure Financial Literacy?
The diversity of financial literacy definitions indicates that there will be various methods to measure financial literacy; but as one can see from Table 1, despite different definitions described in several studies, there are some common components among them: financial terms. As a result, one can expect to see financial questions in most of the financial literacy questionnaires. There are a few ways to classify financial literacy questionnaires, of which, the most common way is to classify them according to the method of assessment used. From a broader point of view, Hung et al. (2009) state that there are two ways to assess one's financial literacy: self-assessment and performance assessment. In a self-assessment process, the researcher asks the respondent whether he or she knows about a financial term and the respondent answers the question with yes or no. As one can see, in this method the actual knowledge of a person is not under assessment, rather it is his or her self-believed knowledge which gets assessed. For example, when we ask one if he/she knows what the meaning of inflation is, he/she may state that yes he/she knows. This knowledge is his/her belief and he/she can be wrong in reality. In the performance assessment method, the researcher gives an examlike question to the respondent and asks him/her to choose the correct answer; so this cannot be his self-understanding but will show his/her real knowledge about the issue. Most researchers have shown that in the self-assessment method, people tend to exaggerate about their actual ability or knowledge. Alba and Hutchinson (2000), in their most cited research, state that ‘consumers are overconfident’ and there is a real gap between their understanding of their believed knowledge and their actual knowledge; a situation which Alba and Hutchinson call ‘a bad calibration of knowledge’.
In Table 2, the frequencies of different questions are presented to show that there is some unanimity among researchers about the primary structure of financial literacy. Additionally, from Table 3 it is evident that among 41 different questionnaires designed for financial literacy assessments and we had access to them, 28 are performance assessment, 12 are a mixture of performance assessment and self-assessment (to compare the differences and correlations), and only one of them is a sole self-assessment. It is evident that most of the researchers agreed upon the deficiencies of self-assessment surveys and did not use them in their studies. To see some questionnaires used by different researchers, see works done by Volpe et al. (1996); Moore (2003); Allgood and Walstad (2013).
| Table 2 Different Components Considered in Different Financial Literacy Questionnaires | |
| Measured Component | Researcher/Questionnaire |
| Financial Knowledge Questions | 36 Researchers/Questionnaires |
| Financial Behavior Questions | 5 Researchers/Questionnaires |
| Financial Situations Questions | 6 Researchers/Questionnaires |
| Financial Intelligence Question | 1 Researcher/Questionnaire |
| Financial Experience Questions | 4 Researchers/Questionnaires |
| Consumer Questions | 2 Researchers/Questionnaires |
| Investment Knowledge Questions | 1 Researcher/Questionnaire |
| Retirement Knowledge Questions | 2 Researchers/Questionnaires |
| Financial Well-Being Questions | 1 Researcher/Questionnaire |
| Financial Attitude Questions | 3 Researchers/Questionnaires |
| Financial Dispute Questions | 1 Researcher/Questionnaire |
| Credit Knowledge Questions | 1 Researcher/Questionnaire |
| Table 3 Assessment Methods Used by Different Researchers | ||
| Performance assessment | Self-Assessment | Hybrid method |
| 28 Questionnaires | 1 Questionnaire | 12 Questionnaires |
Financial Literacy in Literature
Financial literacy is an important topic for researchers and didn’t lost its importance in almost all countries (Wachira & Kihiu, 2012; Bay et al., 2014) have categorized studies about financial literacy into three main groups: the first group only tries to measure financial literacy in a population, the second group measures the effect of financial literacy on financial decisionmaking, and the third assesses the effect of financial education on financial behavior of that group. Using this categorization, we can claim that our research is a mixture of both financial literacy assessment and financial literacy impact analysis (first and second groups).
Calcagno and Monticone (2015) also assessed the correlation between financial literacy and financial advice and concluded that as one's financial literacy increases, his or her tendency to accept information about financial issues increase too. They also found that those who have low levels of financial literacy tend to invest in high-risk assets and consequently there is a higher probability that they will lose their wealth.
The recent research about financial literacy and its effect on market participation is the research that has been done by Hsiao and Tsai (2018). These two researchers have noted that there is a lack of research about the relationship between financial literacy and market participation. By using a sample of 2523 individuals, higher than 20 years old, Hsiao & Tsai have concluded that gender; household wealth, residential location and diversity of information have effects on participation rates. They also concluded that after taking into account the accessibility of measurement errors, the positive effect of financial literacy on market participation remains constant, so by this way, they prove the existence of such a relationship.
Mitchell and Lusardi (2015) presumed that financial literacy level in most countries, including developed countries such as the United States, is low. In their study, they used a simple questionnaire to measure financial literacy of people and concluded that financial literacy is positively correlated with education. They also verified a gender gap in financial literacy level. Those who lack financial literacy are likely victims of troubles like debt, saving and credit management (Miller et al., 2009; Beck et al., 2007) also emphasized that the familiarity, or in other words being financially literate, is the necessity of using financial products. The domain of studies about the impact of financial literacy on different variables or the effect of some variables on financial literacy contains different issues. In most studies, financial literacy is one of the main dependent or independent variables (Huston, 2010). Also, some studies only tried to measure financial literacy in a population and keep deduction for others. Besides financial literacy, other variables including saving, investment behavior, and debt behavior as well as variables from other subjects are used to study the different phenomena.
Portfolio Diversification
Markowitz (1968) was the first one to relate the variance and covariance of different stocks to the portfolio optimization problem and achieved the best diversification point. Also, researchers agree as diversification of a portfolio increases to some extent, the risk of that portfolio decreases (Robb & Sharpe 2009); Woerheide and Persson (1993) presumed that a welldiversified portfolio is one that consists of all of the stocks in the market. Building such a portfolio is not possible in practice, so there must be a criterion Jones (2013), argued that the simplest way of assessing the diversification level of a portfolio is by counting the number of different stocks in it. As a result, in some studies, the number of stocks in the respondent's portfolio was the index of diversification (Mouna & Jarboui, 2015); Upson et al. (1975) have given a minimum cutting point of 16 stocks for diversification.
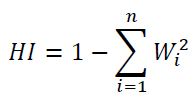
Herfindahl index is another way of assessing diversification level of a portfolio (Woerheide & Persson, 1993) which is widely used in portfolio diversification researches. Herfindahl Index is a simple, weight-based diversification index defined with the following formula:
 (1)
(1)
Where, the Wi is the weight for each one of the assets (n). This measure does not take into account interdependencies between assets and risk characteristics (Kirchner & Zunckel, 2011). Herfindahl Index is a number between zero and one. When the number of stocks in the portfolio is one, it means that there is no portfolio diversification and the index will be zero. By increasing the number of stocks in the portfolio, the index will increase rapidly, and when the number of stocks in the portfolio reaches to an infinite level, the index will be one. The Herfindahl index has a rapid change from zero to 0.5, so the cutting point of this index for diversification will be around 0.9. Most researchers suggest the minimum cutting point of 0.85 for Herfindahl index because of its high tendency to reach its highest point even with a low number of stocks. Another characteristic of Herfindahl index is its small band. This limited range tends to have good correlation coefficients with financial literacy because both have minimum and maximum limits. This unique feature of Herfindahl index against the stock number, which doesn’t have a particular upper band, will be further investigated in the data analysis section.
Low diversification of portfolios is one of the major problems that cause people to lose money. Some Studies examined the causes of low diversification and pointed their finger toward high costs of research and transaction (Perraudin & Sorensen, 2000; Van Nieuwerburgh & Veldkamp, 2010; Ruffino, 2014). Behavioral biases like familiarity with a specific stock and loyalty to a particular company or industry are also among the suspects of low diversification (Huberman, 2001; Benartzi et al., 2007; Barberis & Huang, 2007); Campbell (2006); NBER (2009) presumed that various levels of risk adversity, wealth, income and transaction costs are not the only elements causing people to have low diversification levels in their portfolios, but there must be some other variables affecting this tendency. Overall, it is clear that the literature has suspected other variables playing a role in this context.
Chu et al. (2017) also presumed that low levels of financial literacy will result in bad portfolio choices and lower financial wellbeing. Chu et al have conducted a research on a sample of 3906 people from the Chinese society. They used demographic variables as control ones and concluded that without taking into account the control variables, there is a positive relationship between financial literacy and market participation and taking those variables into account doesn’t change the significance of this relationship. They also found that as the financial literacy of a person increases, people change their attitude from direct investment on individual stocks to investment on mutual funds and diversify their portfolio by delegating at least part of their portfolio to experts and investing in mutual fund.
Links between Financial Literacy and Portfolio Diversification
Guiso and Jappelli (2008) were the first ones who directed the suspicion arrow of low diversification toward financial literacy. After studying a sample of 1686 people and controlling for demographic variables, they concluded that there is a positive relationship between financial literacy and portfolio diversification. In a different study, Goetzmann and Kumar (2008) have shown that there is considerable heterogeneity in the diversification choices of individual investors and older, wealthier, more experienced, and financially sophisticated investors. These researchers have shown that those who diversify their portfolios with assets other than domestic stocks also hold relatively better diversified portfolios. This study shows that the U.S. individual investors' portfolios suffer from under-diversification and its intensity is greater among younger, low-income, less-educated, and less-sophisticated investors. They also have shown that there is a significant correlation between under-diversification and investment. Moreover, those investors who try to overweight stocks with higher volatility and higher skewness, diversify their portfolio with lower degrees; however, they have found no evidence to correlate portfolio size with transaction costs as a constrainer of diversification; which is in contrast with the findings of Guiso and Jappelli (2008).
Abreu and Mendes (2010) also studied the financial literacy and its impact on portfolio diversification. They used a survey of individual investors disclosed by the Portuguese Securities Commission (CMVM) to examine the impact of investors’ level of financial literacy on portfolio diversification, controlling for socioeconomic and behavioral differences among individual groups of investors. These researchers used three aspects to build a financial literacy score. The first aspect is financial knowledge of investor, which is questions related to financial issues and financial terms can measure. The second part was education level of investor which is a proxy for investor's ability in gathering and interpreting information and the third section is sources of information utilized by the investor. This approach to financial literacy is unique. It has been done before by no one. They concluded that there is a general problem of low information level among individual Portuguese investors. Also, these researchers have shown that portfolios of Portuguese investors are under-diversified and most of them hold less than three stocks. They presume that higher levels of financial literacy lead to higher levels of market participation and also higher levels of diversification. In the end, they have provided evidence that financial literacy matters as far as diversification behavior is concerned. The third study in this newly emerged field is one which has been conducted by Mouna and Jarboui (2015). In an original research in Tunisia, the impact of financial literacy on portfolio diversification has been investigated using multivariate analysis and by controlling for socio-demographic variables. Results show that investors’ experience, financial literacy level, age, their use of the availability heuristic, familiarity bias, and portfolio size have a significant effect on the diversity of assets included in the portfolio. The main weakness of their work is the small size of their sample which included just 256 investors. The regression table for this study shows that the impact of overconfidence is not significant. Also, the effect of experience was weak and statistically significant only in a 0.1 level. Another important feature of this study was the significance level of financial literacy, which was less than some variables like age and income.
Methodology
Research Strategy
This research is an explanatory study. The population of this study includes all investors in the Tehran Stock Exchange (TSE), so we do not use the entire nation as our population, and also we just accept stock market investments because we pursue the supposed effect in the stock market. Iranian people don’t invest for retirement planning (like what people do in the United States), but they do just for wealth accumulation intentions. We only assess investors who buy, keep and sell shares of companies in their portfolios. The reason why we have chosen TSE is that there has been done nothing related to the financial literacy and diversification in this population; so it is a virgin population to study. It is also helpful to mention that stock market participation is religiously allowed in the Iranian society, so religion doesn’t have any disincentive role in this study.
TSE opened in February 1967. During its first year of activity, only six companies were listed in TSE. Then Government bonds and certain State-baked certificate were traded in the market.
TSE has come a long way. Today, TSE has evolved into an exciting and growing marketplace where individual and institutional investor trade securities of over 325 listed companies, 38 Industries, 11 ETFs, 175 mutual funds, 105 brokerage firms, 9 investment banks, 12 portfolio managers, 14 investment advisories.
Sampling
The population of investors in the TSE is about 5,500,000 people, according to what has been reported by TSE Institute. This population is only active in TSE because of their inaccessibility to financial markets. Using this population size, we can calculate the minimum number of samples for building a reliable model. The sample volume has been determined using Cochran's formula. According to this formula, for a population (N) of 5500000 people and significance level of 0.05, the minimum sample size will be:
 (2)
(2)
Where, Z=1.96 (95% confidence), p and q are 50% (respondents’ gender) and d=5% (desired Error) (Hejase & Hejase, 2013).
The sampling technique was simple random sampling. The sample size was 385 people, according to the Cochran's formula. The process of sampling has been done in a whole week, in different days and different hours to eliminate any probable biases related to time. At the end of the week, sampling has been stopped and the number of respondents was 587 people. After preliminary analysis of the data, 573 questionnaires have been determined to be valuable for further analysis and 14 questionnaires have been dropped from further assessments. Therefore, a response rate of 97.62% considered an excellent ratio for this research.
The raw sample gathered from investors includes 587 individuals. Sampling has been done with a random process, and the questionnaire has been designed using Google-Form. Its link has been distributed among investors in forums created by brokers and investors, in the fan clubs of brokers and also in groups of applications like Telegram which is the favorable medium
for Iranian investors to communicate with each other. Investors who were eager to contribute to this research used the link to access the questionnaire page and answer the questions. Because the contribution was entirely free hearted, the missing data percentage for almost all of the variables except Herfindahl index was in an acceptable range. The missing portion of Herfindahl index was a little more because some respondents assumed it a personal question and showed a conservative behavior.
Questionnaire Design
The questionnaire used in this research consists of five sections. Section one contains questions about socio-demographic characteristics and the experience of the respondent. Section two is financial literacy questions. This section contains ten questions about the interest rate, interest-inflation relation, bond-interest relation, the stock market, shares and bonds, the return of different securities, risk distribution, and diversification. The whole body of this questionnaire is similar to the questionnaire used by Al-Tamimi and Bin Kalli (2009), with some minor revisions necessary to adapt the questionnaire to the financial market of Iran. For example, there are no securities with the name of bonds in Iran and instead, they use participation notes which are Islamic kind of bonds with some differences.
Section three of the questionnaire gives us the diversification index. Although diversification means assessing variance and covariance of different stocks in a portfolio, we do not want to differentiate between proper and improper diversifications. What we want to evaluate in this part is to know whether the investor has tried to diversify or not. The criteria we have used to assess the diversification level of a portfolio are both the stock number and the Herfindahl index. These two indices are used to differentiate between their potential in the model building phase.
Section four is a question about the regional bias of respondent. If the respondent pays attention to the geographical location of the company which he or she buys its share, the answer for this question will be yes and otherwise no.
Section five is the last part of the questionnaire and asks the respondent about the consulting sources which he or she may use in investment process. The Questionnaire used in this study is available in the Appendix A.
Variables
Demographic Variables: Demographic variables chosen to study as moderators are gender, age, income, education level, major, and marital status. Variables Gender and Marital Status are nominal. Major is a dichotomous variable and has two groups, a value of one for those who have educations related to economic fields and zero for those who do not. Variables Age, Income, and Education are categorical and have five, four and five categories, respectively. To include regional bias of an investor in buying stocks, we have defined a variable which is dichotomous and has two values of 1 for those who buy stocks near their geographical zone and 0 for those who do not consider the geographical place of the company of which they buy its share
The number of sources for financial consult is another variable with nine categories. We have used this variable as a moderator for the relationship between financial literacy and portfolio diversification besides demographic variables. The last one among moderating variables is the respondent’s experience. Experience is also a categorical variable with five categories to categorize investors with different levels of experience. Table 4 shows variables used in this research along with their role in the assumed model. In Table 4, one can see all variables and their features, respectively.
| Table 4 List of Variables | |||
| Variable Name | Variable Description | Variable Type | Variable Role |
| FLS | Financial Literacy Score | Continuous | Independent |
| HFI | Herfindahl Index | Continuous | Dependent |
| STN | Number of stocks | Continuous | Dependent |
| LFLS | Lusardi's Financial Literacy Score | Continuous | Independent |
| AGE | Age | Categorical | Moderator |
| SEX | Gender | Nominal | Moderator |
| INC | Income | Categorical | Moderator |
| EDU | Education | Categorical | Moderator |
| MAJ | Major | Dichotomous | Moderator |
| MLS | Marital Status | Dichotomous | Moderator |
| EXP | Experience | Categorical | Moderator |
| RGB | Regional Bias | Dichotomous | Moderator |
| NCR | Number of Consulting Sources | Categorical | Moderator |
Data Analysis and Results
Reliability Testing
Financial literacy score is the summation of ten exam-type questions with values 1 for correct and 0 for incorrect or empty answers. Table 5 shows the Cronbach’s α for reliability test of financial literacy score. The Internal Reliability of the 10-item scale is assessed using the Cronbach’s Alpha technique. Table 5 shows that the 10-item scale produced a Cronbach’s Alpha = 0.780, in addition that Cronbach’s alpha if items deleted all fall in the range 0.75 to 0.90 matching the range labeled “Very Good” (Hejase & Hejase, 2013). This indicates a very good strength of association and proves that the selection of the questions is suitable for the questionnaire purpose (Chehimi et al., 2019). Therefore, the result is desirable.
| Table 5 Cronbach's α for Reliability test of Financial Literacy Score | ||
| Cronbach's Alpha | Cronbach's Alpha Based on Standardized Items | Number of Items |
| 0.73 | 0.78 | 10 |
Descriptive Results
In Table B-3 (Appendix B), descriptive data for all non-continuous variables is presented. In Table 6, one can see the descriptive results for variables financial literacy score, Herfindahl index, and the number of stocks. Also in Table 7, one can see correlations among continuous variables. Correlations are significant at p< .01.
| Table 6 Results for three Continuous Variables | ||||
| Variable | Number | Mean | Minimum | Maximum |
| Financial literacy score (FLS) | 573 | 8.31 | 0 | 10 |
| Number of Stocks (STN) | 519 | 5.56 | 0 | 18 |
| Herfindahl Index (HFI) | 417 | 0.64672 | 0.00 | 1.00 |
| Table 7 Results for Correlations Among Continuous Variables | |||
| FLS | STN | HFI | |
| FLS | 1 | 0.204** | 0.349** |
| STN | 0.204** | 1 | 0.589** |
| HFI | 0.349** | 0.589** | 1 |
Data show that most of the investors have an age between 31 and 40. Also, 80 percent of investors are under 40. About gender differences, one can see that most investors are male. Marital status of investors has a higher percentage of married investors, and education level of them is more significant for undergraduate degrees. Moreover, most investors do not have studies related to financial fields.
The most interesting part of gathered data is (investment) income level of investors. 40.6 percent of investors have an income level of lower that 15000000 Rials (something around 420 US dollars considering exchange rate at the time of survey). It shows that investors of TSE do not gain an acceptable amount of return. There is a hidden issue in here which needs to be scrutinized. As will be seen in next pages, the financial literacy of investors is not the cause of this lower income level because the average financial literacy level of investors in our sample was high enough. One can suppose an arrow from lower diversification to lower income, or vice versa. Both models should be assessed in future studies to see if there is a distinct relationship or not.
The lower experience of investors is evident from this data, too. A significant portion of investors has an experience of lower than two years which is in parallel with the age distribution of the sample. It can be because of lower return of this market which causes investors to enter in and out very quickly.
In the next section, it can be seen that more than 90 percent of investors do not care about the geographical location of the company when they buy its share. It is a healthy financial behavior, in parallel with higher levels of financial literacy of investors.
In the end, results show that a quarter of investors have just one and most of them have less than four consulting sources.
Tables 6 & 7 show detailed results for the three continuous variables. According to this information, it is evident that the financial literacy level of investors is quite high. Also, the average number of stocks is more than five which is more than the mean number of similar studies. The important number in this table is Herfindahl index which shows that diversification level of investors is lower than the proposed cut point in literature. The average number of 0.64 is too low. The smaller number of cases in the HFI question is because of the particular characteristic of it. To answer this question, the respondent has to calculate proportions of his/her stocks in his/her portfolio which needs some extra time. To avoid incorrect answers, we did not make the answer to this question obligatory. HFI is the only variable with a high amount of missing data. All other variables have a good percentage of response.
HFI: An index between zero and 1, which diversification level of a portfolio.
Discussion
The first point to discuss is the average of financial literacy score in our sample. The average of 8.31 shows that investors in TSE are financially literate. The diversification averages of 5.56 and 0.646 for the number of stocks and Herfindahl index respectively tell us that financial literacy was not the biggest problem and despite high financial literacy scores, the diversification level was low. These results are not comparable with previous studies because the population of this study is just investors on the TSE who buy and sell shares while the population of previous studies was all people who invest in different assets and securities. This difference in population justifies the high level of financial literacy in our population because they are a group of individuals who focus on a particular part of the market and this emphasis can be with previous knowledge.
Because Herfindahl index, the number of stocks and also financial literacy score are continuous, to analyze the proposed model, ordinary least squares (OLS) regression was selected. Enter is the chosen method to enter the variables into the model, with two blocks to assess the variation of the model after introducing moderators. To satisfy prerequisites of multiple regression, Stevens (2012) suggests 15 cases for every predictor variable in the regression analysis. By this criterion, in our supposed model, we have one primary predictor and nine moderators, so our model needs at least 150 cases to run the multiple regression analysis. Another rule for the volume of sample in a multiple regression analysis is what is proposed by Tabachnick and Fidell (2013). They suggest at least 50+8m cases for running multiple regression, in which m is the number of predictors in the model. By this second criterion, we need 130 cases, at least. With a total sample size of 587 cases and 487 useful cases after diagnosing for regression prerequisites, we can claim that we have a reliable sample size to run our model. According to Tabachnick and Fidell's prescriptions and to satisfy requirements for residuals, normality, linearity and homoscedasticity, we have taken all preliminary actions.
The Role of Moderators
To compute moderating effects, we have used the method presented by Tabachnick and Fidel. To do this, we need to center independent variables and change their mean to zero, to avoid the multi-collinearity problem (Aiken & West, 1991). In regression blocks, we have entered financial literacy as the only predictor of diversification in the first block. Then, we added moderators in the second block to assess the improvement of the model. In model one, the relation between financial literacy and diversification verified significant, although they have lower amount of R square and It is consistent with our preliminary investigations (Table 8). Case wise diagnoses have been made up to the point that we have both the best coefficient of determination and the best condition for residuals. Remaining cases satisfied the minimum number of cases to run multiple regression. Model 2 also verifies that our socio-demographic variables, experience, regional bias and number of consulting sources moderate the relationship between financial literacy and portfolio diversification. Adding the moderating effects to the model improves its coefficient of determination, R square number, significantly. The main point of these results is the connection between financial literacy and portfolio diversification. According to these results, as the financial literacy of a person increases, the tendency toward putting more stocks in the portfolio increases, too. This correlation means that people tend to be more risk-averse by increasing their financial literacy, but our model shows that the relationship between financial literacy and portfolio diversification isn’t a pure relationship and moderating variables change the model fit significantly.
| Table 8 Regression Results for Proposed Models | |||||
| Model | R | R Square | R Square Change | F | Sig. F Change |
| 1 | 0.349 | 0.122 | 0.122 | 42.383 | 0 |
| 2 | 0.934 | 0.868 | 0.75 | 198.385 | 0 |
Model 1. Dependent: Herfindahl Index; Predictors: (Constant), Financial literacy score Model 2. Dependent: Herfindahl Index; Predictors: (Constant), Financial literacy score, Moderating Effects of Age, Gender, Education, Major, Income, Experience, Marital Status, Regional Bias and Number of consulting sources. Results for regression coefficients are shown in Table B-4. According to Tables 8 and B-4, models we have built and their coefficients are statistically significant and field data don’t reject the model. Table 8 indicates that adding moderators to the model improves its coefficient of determination impressively. All moderators are statistically significant at P< 0.01 which means that all selected variables moderate the relation between financial literacy and portfolio diversification. In the study of Mouna and Jarboui (2015), age, gender, income, and experience were control variables besides financial literacy. The coefficient of determination of model with those variables was 60, but our model shows that adding moderators to the relationship between financial literacy and portfolio diversification is a better option to assess the supposed relationship.
Changing Diversification Index
To compare the difference between two diversification indices, Herfindahl and Number of stocks, we have repeated the analysis by changing the dependent variable to the number of stocks. All other conditions are the same for both analyses. Case wise diagnoses have been made up to the point that the best conditions become achievable beside the best coefficient of determination. The results of the model and its coefficients are shown in Table 9 and B-5 respectively.
| Table 9 Regression Results for Proposed Models After Changing Dependent Variable | |||||
| Model | R | R Square | R Square Change | F | Sig. F Change |
| 1 | 0.194 | 0.038 | 0.038 | 13.776 | 0 |
| 2 | 0.27 | 0.073 | 0.035 | 2.367 | 0.04 |
Model 1. Dependent: Number of stocks; Predictors: (Constant), Financial literacy score Model 2. Dependent: Number of stocks; Predictors: (Constant), Financial literacy score, Moderating Effects of Age, Gender, Education, Major, Income, Experience, Marital Status, Regional Bias and Number of consulting sources.
The results show that although the main relationship still exists, the moderating effects are somehow unacceptable and the model rejects most of them. Those moderators which are not rejected, have a lower significance level, and the model is weak compared to that with Herfindahl Index. The main reason for this weak model is the wider band of the number of
stocks. Although Herfindahl Index is a number fixed between zero and one, the number of stocks is a number between zero and a number which can be as big as the number of all companies presented in the stock market. We know from statistics that an unlimited band will tend to build a weak correlation with a limited one. Doing some arithmetic on the number of stocks, like limiting its range by taking second or third root can solve some of these problems and improve its correlation with financial literacy.
But why do these changes happen? To answer this, we must consider that financial literacy is a variable limited between zero and ten. Every respondent will get a number between these two. The number of stocks is a number not limited by the questionnaire, so the respondent can enter any number he or she wants. Although we have eliminated some big numbers like fifty as outliers, we have not limited the number of stocks in a small range like what we have done in the financial literacy score. Herfindahl index is another variable which is finely limited between zero and one. So any respondent can't have a value of Herfindahl index more than one. The value of one will be unattainable because of the essence of the formula. Because of those reasons, and also because the correlation coefficient between two equivalently limited variables is more robust, we see better results of model building after using Herfindahl index.
Does Lusardi's questionnaire have the same value level of the coefficient of determination?
Lusardi and Mitchell (2006) used only three questions in their questionnaire to assess financial literacy of respondents. These questions are about simple interest, compound interest, and diversification. These three questions are the same with questions number 1, 2 and 9 in our questionnaire, so we have built a new financial literacy score with these three questions and used it to rebuild our model. Other conditions are the same. The dependent variable we have employed in these steps is Herfindahl index because of its high coefficient of determination proved in the previous section. Again, multiple regression is used to monitor the model changes. Table 10 lists the results of the model fit. Table B-6 shows the coefficients for regression done with Lusardi's scale. It is important to note that after changing the independent variable, computing moderating effects and interactions with new dependent variable (LFLS) is obligatory.
| Table 10 Regression Results for Proposed Models Using Lusardi's Scale for Financial Literacy | |||||
| Model | R | R Square | R Square Change | F | Sig. F Change |
| 1 | 0.384 | 0.148 | 0.148 | 18.96 | 0 |
| 2 | 0.711 | 0.505 | 0.358 | 42726 | 0 |
As one can see in Table 10, model fit for a new model based on Lusardi's financial literacy score is also acceptable, but less desirable than that built with our ten-item questionnaire. Using these results, we can conclude that adding extra questions related to different aspects of financial knowledge reveals more information about respondents. The number of questions in a questionnaire is something like the number of stocks in a portfolio, the degree of its determination increases with increasing the number of questions, but after a special point, the extra questions will make less difference.
Model 1. Dependent: Herfindahl Index; Predictors: (Constant), Lusardi's financial literacy score (LFLS).
Model 2. Dependent: Herfindahl Index; Predictors: (Constant), Lusardi's financial literacy score (LFLS), Moderating Effects of Age, Gender, Education, Major, Income, Experience, Marital Status, Regional Bias and Number of consulting sources.
Table B-6 shows regression coefficients for the new model. The coefficients for Major and Experience are not significant in the new model, and their moderating effects are rejected. The moderating effect of Marital Status and Number of consulting sources, although not rejected, their significance decreased from p< .01 to p< .05. So again we can see that besides model fit, we have some losses in powers using Lusardi's financial literacy score.
Conclusion
The results presented in the current paper show that financial literacy is a significant determinant of portfolio diversification and has a significant effect on it. In this study, we focused on financial literacy level of investors of the TSE to see whether the lack of financial literacy leads to under-diversification. Based on regression analysis of 573 investors, we posit that a positive relationship exists, but the coefficient of determination for a single relationship between these two variables is- also acceptable- low. Adding moderators in further steps causes significant improvements in coefficients. We verified that variables such as age, gender, income, education, major, regional bias, marital status, experience and the number of sources for consulting moderate the relationship between financial literacy and portfolio diversification. Previous studies on financial literacy and diversification used abovementioned variables as controls.
Comparing portfolio diversification indices indicate that Herfindahl index acts better than the number of stocks in our models, probably because of its narrower and confined band in comparison to the number of stocks. The last phase of our study was a comparison between our questionnaire and Lusardi's three-item questionnaire. The results in this section show that although Lusardi's three-item questionnaire has a good model fit, adding extra questions reveals more details about the survey and improves model fit significantly.
The final conclusion about this study is investors' tendency toward small portfolios. By saying small portfolios, we mean the number of stocks in a portfolio; because we have not assessed the value of portfolios, but just the number of different stocks an investor put in his or her portfolio. Our data shows that although investors who invest in the TSE have high levels of financial literacy, they tend to build small portfolios in comparison to portfolio sizes recommended by investment literatures. Their short-term interests can rationalize this odd behavior. A possible explanation for this behavior is that those who are investing in the TSE do not have long-term attitudes and only try to benefit from short-term jumps in prices, which causes most of them to buy and sell quickly and not to hold stocks for long periods. This behavior can have psychological reasons rooted in the society or can be because of the market's deficiency in making long term profits which need further studies.
The results obtained in this paper can be used by stock market regulators and policy makers to conduct educational programs for investors. As seen in this paper, increasing the financial literacy level of investors causes a good increase in their diversification level which decreases portfolio risk. Results show that financial education leads people to learn and obey financial laws like diversification, so policy makers can address financially bad behaviors by conducting financial educations in the target community. But the results also recommend to conduct these programs with respect to different demographic variables. For example, the results show that gender makes difference and any program according to increasing financial literacy of investors should take these differences into account.
Future Research Perspectives
1. Some people in markets like stock market are scalpers. These people don’t make portfolios and have a short term view in their investments, although they may have a good level of financial literacy. Differentiating these people in future researches can increase the reliability of the research.
2. Future researches can use our moderating variable as other variables like control ones, to see the differences.
3. Future researches can add extra variables to this model. These extra variables can include job, family size and etc.
4. Future researches can extend this model to cover markets other than stock market.
5. Future researches can add self-assessment criteria to our questionnaire and include behavioral parameters in the research.
Compliance with Ethical Standards
Ethical approval
All procedures performed in studies involving human participants were in accordance with the ethical standards of the institutional and/or national research committee and with the 1964 Helsinki declaration and its later amendments or comparable ethical standards. This article does not contain any studies with animals performed by any of the authors.
Conflict of Interest
The authors declare that they have no conflict of interest.
Informed Consent
Informed consent was obtained from all individual participants included in the study.
Appendix A. Questionnaire
Section One: Demographic Questions
| How much experience in stock market? |
Your marital status | Your income (Investment) level? | Your university major | Your education level? | What is your gender? | How old are you? (Years) |
| Less than 2☐ | Single☐ | Less than 15☐ | Finance | High School☐ | Female☐ | Less than 20 ☐ |
| 2-4☐ 4-6☐ 6-8☐ 8+☐ |
Married☐ | 15-30☐ 30-45☐ 45-60☐ 60+☐ |
related☐ Other majors☐ None☐ |
Associate's and Bachelor's☐ Master's☐ PhD☐ |
Male☐ | 20 - 30☐ 31-40☐ 41-50☐ 51-60☐ |
| (Years) | (million Rials) | 60+☐ |
Section Two: Financial Literacy Questions
1-1 Suppose you had 100 D in a savings account and the interest rate was 2 percent per year. After five years, how
much do you think you would have in the account if you left the money to grow?
| (1) More than 102 D | (2) Less than 102 D | (3) exactly 102 D | (4) Do not know. |
1-2 Imagine that the interest rate on your savings account was 1 percent per year and inflation was 2 % per annum.
After one year, how much would you be able to buy with the money in this account?
| (1) More than today | (2) The same | (3) Less than today | (4) Do not know. |
1-3 Supposing the economy of Iran, interest rates rise, what will typically happen to bond prices?
| (1) They will rise | (2) they will fall | (3) Do not know | (4) Do not know. |
1-4 Which of the following statements describes the primary function of the stock market?
| (1) The stock market helps to predict stock earnings | (2) The stock market results in an increase in the price of stocks |
(3) The stock market brings people who want to buy stocks together with those who want to sell stocks |
(4) Do not know. |
1-5 Which of the following statements is correct? If somebody buys the stock of firm B in the stock market:
| (1) He owns a part of firm B | (2) He has lent money to firm B | (3) He is liable for firm B’s debts | (4) Do not know. |
1-6 Which of the following statements is correct? If somebody buys a bond of firm B:
| (1) He owns a part of firm B | (2) He has lent money to firm B | (3) He is liable for firm B’s debts | (4) Do not know. |
1-7 Considering the economy of Iran and an extended period (for example 10 or 20 years), which asset typically
gives the highest return?
| (1) Savings accounts | (2) Bonds | (3) Stocks | (4) Do not know. |
1-8 Considering the economy of Iran, which asset usually displays the highest fluctuations over time?
| (1) Savings accounts | (2) Stocks | (3) Bonds | (4) Do not know |
1-9 When an investor spreads his money among different assets, the risk of losing money will:
| (1) Increase | (2) Decrease | (3) Stay the same time | (4) Do not know |
1-10 Stocks are usually riskier than bonds. True or false?
| (1) True | (2) False | (3) Do not know | - |
Section Three: Diversification
At the moment, how many companies' stock do you have in your portfolio?
| Please enter the number of companies: | ........ |
Herfindahl Index: Please determine the proportion of each stock in your portfolio. For example, if you had 100 D
and divided that money equally among five stocks, the ratio of each one in your portfolio is 0.2.
| Stock | proportion | Stock | proportion | Stock | proportion |
| 1 | …….. | 6 | …….. | …….. | |
| 2 | …….. | … | …….. | …….. | |
| 3 | …….. | …….. | …….. | ||
| 4 | …….. | …….. | …….. | ||
| 5 | …….. | …….. | …….. |
Section Four: Regional Bias
Which one of the following is true about you?
1. I buy the stock of companies whose locations are in my geographical proximity.
2. I do not pay attention to the geographic location of companies when purchasing a stock.
Section Five: Financial Consulting Sources
Which source or sources do you use to consult before buying a specific company's stock?
| (1) Parents, friends, or acquaintances | (2) Information from the newspapers | (3) Financial magazines, guides, books |
| (4) Brochures from my bank or mortgage adviser | (5) Advertisements on TV, in papers, or other media | (6) Professional financial advisers |
| (7) Financial information on the Internet | (8) Other sources | (9) I do not Consult. |
Appendix B. Tables
| Table B-1 Conceptual Definitions of Financial Literacy in Literature | |
| Researcher(s) | Definition |
| Garman & Forgue, 2000 | Financial literacy is Knowing the facts and vocabularies necessary to manage one’s personal finances successfully. |
| Kim, 2001 | Financial literacy is the necessary knowledge that people need to survive in modern society. |
| Greenspan, 2001 | Financial literacy is an essential skill, increasingly seen vital to the long- term well-being of individuals and communities. |
| American Institute of Certified Public Accountants, 2003 | The ability to effectively evaluate and manage one’s finances to make frugal decisions, (or “intending to”) reaching life goals and achieve financial well-being. |
| Hilgert, Hogarth, & Beverly, 2003 | Financial knowledge. |
| FINRA, 2003 | The understanding of investor about the market and its tools and rules. |
| Moore, 2003 | People who can present the application of financial knowledge are financially literate. |
| National Council for Economic Education, 2005 |
Financial literacy means being familiar with fundamental economic basis, having knowledge about economics and understanding economic terms. |
| Organization for Economic Co- operation and Development, 2005 | Financial literacy means a mixture of investor/consumer's understanding of financial products and conceptions, their ability and confidence to recognize and to face with financial risks and opportunities and also their ability to make just decisions and to select right resources for financial consulting and to have financial well-being. |
| Fox, Bartholomae, & Lee, 2005 | Financial Literacy shows a person's understanding and knowledge of financial concepts, and it is critical for effective financial decision making of a consumer. |
| Vitt, 2005 | Personal financial literacy means the ability to read, analyze, manage and write about personal financial situations which have an effect on material well-being. These capabilities include discussing financial issues, planning for future and having effective responses to the economic events. |
| Mandell, 2006 | Financial literacy is what people must know to make important financial decisions in their best interest. |
| Mandell & Klein, 2007; Mandell, 2008 |
Financial literacy means the ability to assess new and complex financial tools and to have impartial judge about those tools and their applicability. |
| Lyons, Rachlis & Scherpf, 2007 | Credit Knowledge. |
| U.S. Financial Literacy and Education Commission, 2007 |
Financial literacy is the ability to use knowledge and skills to manage financial resources effectively for a lifetime of financial well-being. |
| Lusardi, 2007 a & b | Financial literacy means being familiar with basic economic terms to use them in decision-making about saving and investment. |
| Danes & Haberman, 2007 | Financial literacy is one's ability to interpret, to communicate, to compute, to judge independently and to take action to survive in the complex financial world of today. |
| Johnson & Sherraden, 2007 | Financial ability (financial literacy) includes financial education and access to financial institutes and services. |
| ANZ Bank, 2008 | Financial literacy is the capacity to have informed judges and tough decisions about money management and money use. |
| Lusardi & Tufano, 2009 | Financial literacy means focusing on financial debt. |
| Robb & Sharpe, 2009 | Financial literacy means financial knowledge in the form of one's understanding from important concepts of personal financial issues. |
| Gutter, Garrison & Copur, 2010 | Financial socialization (a substitute for financial literacy) has various aspects like dealing with money, earning, spending, saving, borrowing, and sharing. |
| Huston, 2010 | Financial literacy has two aspects of understanding and using personal finance. |
| Remund, 2010 | Financial literacy is an indicator of one's understanding of the main financial terms, one's ability and self-confidence in managing personal issues with application of sound and short term financial decisions and also to have long term planning for variable economic situations. |
| Gale & Levine, 2011 | Financial literacy means the ability to adopt sound and informed decisions about using money and wealth. |
| Carlin & Robinson, 2012 | Financial literacy is one's ability to utilize financial decisions for one's short term and long term benefits. |
| Hastings, Madrian & Skimmyhorn, 2012 | Financial literacy has different meanings in the literature. Financial literacy is knowledge of financial products, financial concepts, and arithmetic skills to decide about financial issues and deal with financial planning. |
| Lusardi, Mitchell & Curto, 2014 | Financial literacy is the ability of people to process economic information and adopt informed decisions about financial planning, gathering wealth, and dealing with debts and pensions. |
| Fernandes, Lynch Jr & Netemeyer, 2014 |
According to previous works, financial literacy is an index of one's ability and understanding toward personal short and long term decision making. |
| Frączek & Klimontowicz, 2015 | From the conceptual preview, financial literacy includes some solid definitions like knowledge of financial concepts, ability to communicate financial information, ability to manage personal finance, having the skill in making sound financial decisions and having self-confidence in effective planning for future financial needs. |
| Table B-2 Different Methods of Financial Literacy Measurement, Used by Various Researchers | ||
| Researcher(s) | Questions | Method |
| Volpe, Chen, & Pavlicko, 1996 |
Ten multiple choice financial knowledge questions | Performance Assessment |
| Chen & Volpe, 1998 | 36 multiple choice financial knowledge questions | Performance Assessment |
| Danes, Huddleston-Casas & Boyce, 1999 | Eight multiple choice financial behavior questions, three multiple choice financial knowledge questions, two self-assessment questions |
Performance Assessment Self-Assessment |
| Tennyson & Nguyen, 2001 | The test contains 31 multiple choice questions regarding terminology, facts, and decisions related to personal financial management. The survey also |
Performance Assessment |
| includes additional questions regarding students’ family background, financial experience, aspirations and demographic characteristics. |
||
| Volpe, Kotel & Chen, 2002 | Ten multiple choice financial knowledge questions | Performance Assessment |
| Hilgert, Hogarth & Beverly, 2003 |
28 financial IQ True/False questions | Performance Assessment |
| FINRA, 2003 | Ten financial knowledge True/False questions | Performance Assessment Self-Assessment |
| Moore, 2003 | 12 financial knowledge questions 12 financial experience questions 15 financial behavior questions |
Performance Assessment Self-Assessment |
| Agnew & Szykman, 2005 | Ten financial knowledge True/False questions plus one self-assessment question against others | Performance Assessment Self-Assessment |
| National Council for Economic Education (NCEE), 2005 |
24 multiple choice financial knowledge questions | Performance Assessment |
| Hira & Loibl, 2005 | Five self-assessment questions on a five-scale Likert spectrum |
Self-Assessment |
| Varcoe, Martin, Devitto & Go, 2005 |
19 financial knowledge True/False questions in a pre- and post-exam survey |
Performance Assessment |
| Zhan, Anderson & Scott, 2006 |
24 multiple choice and True/False financial knowledge questions in a pre- and post-exam survey |
Performance Assessment |
| Lusardi & Mitchell, 2006 | Three financial knowledge True/False questions | Performance Assessment |
| Lyons, Rachlis & Scherpf, 2007 | 23 questions of which 14 are multiple choice credit report questions, four multiple choice credit score questions, four open ended dispute resolution process questions. |
Performance Assessment Self-Assessment |
| Lusardi and Mitchell, 2007 a |
Three arithmetic financial knowledge True/False questions |
Performance Assessment |
| Lusardi and Mitchell, 2007 b | Five multiple choice basic financial knowledge questions, eight multiple choice advanced financial knowledge questions, one self-assessment question on a seven-scale Likert spectrum |
Performance Assessment Self-Assessment |
| Danes & Haberman, 2007 | Five multiple choice financial knowledge questions and one self-assessment question |
Performance Assessment Self-Assessment |
| Borden, Lee, Serido & Collins, 2008 |
Seven True/False questions in a pre- and post-exam survey |
Performance Assessment Self-Assessment |
| Mandell & Klein, 2007 | A questionnaire consisting of 49 questions, partitioned into three sections. First, 31 financial knowledge questions. Second, questions about the students’ financial behavior and attitude toward risk. Third, demographic questions such as educational attainment. |
Performance Assessment Self-Assessment |
| Peng, Bartholomae, Fox & Cravener, 2007 |
Ten questions about investment knowledge | Performance Assessment |
| ANZ Bank, 2008 | 26 financial knowledge questions | Performance Assessment Self-Assessment |
| Mandell, 2008 | 56 questions, of which 31 are the core financial literacy questions. All questions use a multiple choice format; others are classification questions. |
Performance Assessment |
| Hassan Al-Tamimi & Anood Bin Kalli, 2009 |
11 multiple choice financial knowledge questions | Performance Assessment |
| Monticone, 2010 | Six multiple choice financial knowledge questions | Performance Assessment |
| Walstad, Rebeck & MacDonald, 2010 |
43 multiple choice financial knowledge questions | Performance Assessment |
| Collins & O’ROURKE, 2010 |
Five multiple choice financial knowledge questions | Performance Assessment |
| Van Rooij, Lusardi & Alessie, 2011 | Five multiple choice basic financial knowledge questions, 16 multiple choice advanced financial knowledge questions |
Performance Assessment |
| Sabri, 2011 | 25 True/False financial knowledge questions | Performance Assessment |
| Carlin & Robinson, 2012 | A simulated exam in a financial park in a pre- and post-exam survey |
Performance Assessment |
| Gustman, Steinmeier and Tabatabai, 2012 |
Three Arithmetic financial knowledge questions | Performance Assessment |
| Behrman, Mitchell, Soo & Bravo, 2012 |
Three financial knowledge questions plus nine questions about retirement system of Chile |
Performance Assessment |
| Allgood and Walstad, 2013 | Five financial knowledge questions | Performance Assessment |
| Jappelli & Padula, 2013 | Four financial knowledge questions | Performance Assessment |
| Klapper Lusardi and Panos, 2013 | Four financial knowledge questions | Performance Assessment |
| Asarta, Hill & Meszaros, 2014 | 50 multiple choice questions about financial well- being, investment, learning, spending and monetary skills |
Performance Assessment Self-Assessment |
| Fernandes, Lynch & Netemeyer, 2014 |
50 multiple choice financial knowledge questions | Performance Assessment |
| OECD, 2015 | 40 questions about financial knowledge, financial experience, and financial attitude |
Performance Assessment Self-Assessment |
| Brown, Farrell & Weisbenner, 2015 |
Two questions about financial knowledge | Performance Assessment |
| Gathergood & Weber, 2015 |
Four questions about financial knowledge (mainly about mortgage) |
Performance Assessment |
| Chu, Z., Wang, Z., Xiao, J. J., & Zhang, W. (2017) |
12 Financial knowledge questions in two basic and advanced levels |
Performance Assessment |
| Table B-3 Descriptive Statistics | ||
| Variable | Valid Percent | Cumulative Percent |
| Age | ||
| Lower than 20 | 1.3 | 1.3 |
| Between 21 and 30 | 38.3 | 39.5 |
| Between 31 and 40 | 40.4 | 80 |
| Between 41 and 50 | 14.5 | 94.5 |
| More than 50 | 5.5 | 100 |
| Gender | ||
| Female | 16.3 | 16.3 |
| Male | 83.7 | 100 |
| Marital Status | ||
| Married | 58.6 | 58.6 |
| Single | 41.4 | 100 |
| Education | ||
| Diploma and lower | 8.9 | 8.9 |
| Associate and Bachelor | 49.3 | 58.2 |
| Master | 37.5 | 95.7 |
| PhD | 4.3 | 100 |
| Major | ||
| Related to Finance | 31.4 | 31.4 |
| Non-related | 68.6 | 100 |
| Income (Million Rials) | ||
| Lower than 15 | 40.6 | 40.6 |
| Between 15 and 30 | 35 | 75.6 |
| Between 30 and 45 | 14.4 | 89.9 |
| Between 45 and 60 | 4.5 | 94.4 |
| More than 60 | 5.6 | 100 |
| Experience (Year) | ||
| Less than two years | 48.2 | 48.2 |
| Between 2 and 4 | 28.9 | 77.1 |
| Between 4 and 6 | 9.1 | 86.2 |
| Between 6 and 8 | 3.6 | 89.8 |
| More than 8 | 10.2 | 100 |
| Regional Bias | ||
| Yes | 9.3 | 9.3 |
| No | 90.7 | 100 |
| Number of Consulting sources |
||
| Zero | 12.8 | 12.8 |
| 1 | 25.6 | 38.3 |
| 2 | 19.1 | 57.4 |
| 3 | 20.4 | 77.9 |
| 4 | 14.4 | 92 |
| 6 | 4.6 | 96.6 |
| 7 | 2 | 98.6 |
| 8 | 0.5 | 99.1 |
| More than 8 | 0.9 | 100 |
| Table B-4 Regression Coefficients for Main Model | ||||||
| Models | Unstandardized Coefficients | Standardized Coefficients | t | Sig. | ||
| B | Std. Error | Beta | ||||
| 1 | (Constant) | 0.519 | 0.032 | 16.097 | 0.000 | |
| Financial Literacy Score | 0.025 | 0.004 | 0.349 | 6.616 | 0.000 | |
| 2 | (Constant) | 0.359 | 0.016 | 22.326 | 0.000 | |
| Financial Literacy Score | 0.045 | 0.002 | 0.630 | 24.342 | 0.000 | |
| Moderating effect of Age | -0.182 | 0.005 | -1.255 | -35.498 | 0.000 | |
| Moderating effect of Gender | 0.040 | 0.004 | 0.252 | 9.824 | 0.000 | |
| Moderating effect of Education | -0.071 | 0.004 | -0.432 | -16.212 | 0.000 | |
| Moderating effect of Major | 0.022 | 0.004 | 0.122 | 5.065 | 0.000 | |
| Moderating effect of Income | 0.118 | 0.005 | 0.625 | 22.344 | 0.000 | |
| Moderating effect of Experience | 0.051 | 0.005 | 0.279 | 10.717 | 0.000 | |
| Moderating effect of Marital Status | 0.046 | 0.005 | 0.252 | 9.875 | 0.000 | |
| Moderating effect of Regional Bias | 0.122 | 0.004 | 0.844 | 31.448 | 0.000 | |
| Moderating effect of Number of consulting sources |
-0.012 | 0.003 | -0.101 | -3.644 | 0.000 | |
| Table B-5 Regression Coefficients for Assessed Models with Changed Dependent Variable | ||||||
| Models | Unstandardized Coefficients |
Standardized Coefficients |
t | Sig. | ||
| B | Std. Error | Beta | ||||
| 1 | (Constant) | 2.697 | 0.621 | 4.341 | .000 | |
| Financial Literacy Score | .316 | 0.073 | 0.194 | 4.323 | .000 | |
| 2 | (Constant) | 2.235 | 0.751 | 2.975 | .003 | |
| Financial Literacy Score | 0.371 | 0.087 | 0.228 | 4.278 | .000 | |
| Moderating effect of Age | -0.168 | 0.174 | -0.052 | -.961 | .337 | |
| Moderating effect of Gender | 0.038 | 0.179 | 0.010 | .213 | .831 | |
| Moderating effect of Education | -0.144 | 0.200 | -0.039 | -.722 | .470 | |
| Moderating effect of Major | 0.369 | 0.190 | 0.099 | 1.940 | 0.053 | |
| Moderating effect of Income | 0.401 | 0.223 | 0.096 | 1.794 | 0.073 | |
| Moderating effect of Experience | -0.188 | .224 | -0.046 | -0.838 | .403 | |
| Moderating effect of Marital Status | -0.020 | 0.194 | -0.005 | -0.102 | 0.919 | |
| Moderating effect of Regional Bias | 0.271 | 0.123 | 0.115 | 2.202 | 0.028 | |
| Moderating effect of Number of consulting sources | 0.338 | 0.157 | 0.119 | 2.149 | 0.032 | |
| Table B-6 Regression Coefficients for Assessed Models with Lusardi's Questionnaire | ||||||
| Models | Unstandardized Coefficients |
Standardized Coefficients |
t | Sig. | ||
| B | Std. Error |
Beta | ||||
| 1 | (Constant) | 0.489 | 0.030 | 16.444 | 0.000 | |
| Lusardi's Financial Literacy Score | 0.083 | 0.011 | 0.384 | 7.831 | 0.000 | |
| 2 | (Constant) | 0.543 | 0.028 | 19.587 | 0.000 | |
| Lusardi's Financial Literacy Score (LFLS) | 0.063 | 0.010 | 0.294 | 6.522 | 0.000 | |
| Moderating effect of Age | -0.085 | 0.009 | -0.522 | -9.844 | 0.000 | |
| Moderating effect of Gender | 0.050 | 0.008 | 0.334 | 6.344 | 0.000 | |
| Moderating effect of Education | -0.056 | 0.008 | -0.336 | -7.481 | 0.000 | |
| Moderating effect of Major | -0.002 | 0.008 | -0.014 | -.292 | 0.770 | |
| Moderating effect of Income | 0.052 | 0.010 | 0.261 | 5.211 | 0.000 | |
| Moderating effect of Experience | 0.009 | 0.010 | 0.041 | 0.944 | 0.346 | |
| Moderating effect of Marital Status | 0.019 | 0.008 | 0.104 | 2.275 | 0.024 | |
| Moderating effect of Regional Bias | 0.077 | 0.007 | 0.640 | 11.790 | 0.000 | |
| Moderating effect of Number of consulting sources |
-0.015 | 0.006 | -0.112 | -2.477 | 0.014 | |
References
- Agnew, J.R., & Szykman, L.R. (2005). Asset allocation and information overload: The influence of information display, asset choice, and investor experience. The Journal of Behavioral Finance, 6(2), 57-70.
- Aiken, L.S., & West, S.G. (1991). Multiple regression: Testing and interpreting interactions. Newbury Park, CA: Sage.
- Alba, J.W., & Hutchinson, J.W. (2000). Knowledge Calibration: What consumers know and what they think they know. Journal of Consumer Research, 27(2), 123-156.
- Allgood, S., & Walstad, W. (2013). Financial literacy and credit card behaviors: A cross-sectional analysis by age. Numeracy, 6(2), 3.
- Allgood, S., & Walstad, W. (2013). Financial literacy and credit card behaviors: A cross-sectional analysis by age. Numeracy, 6(2), 3.
- Al-Tamimi, H.A., & Bin Kalli, A. (2009). Financial literacy and investment decisions of UAE investors. Journal of Risk Finance, 10(5), 500-516.
- American Institute of Certified Public Accountants (AICPA) (2003). Financial literacy background. Retrieved from http://www.aicpa.org/pubs/jofa/breit.html.
- ANZ Bank (2008). ANZ survey of adult financial literacy in Australia. Retrieved from at:http://www.anz.com/Documents/AU/Aboutanz/AN_5654_Adult_Fin_Lit_Report_08_Web_Reportfull.pdf
- Asarta, C.J., Hill, A.T., & Meszaros, B.T. (2014). The features and effectiveness of the Keys to Financial Success curriculum. International Review of Economics Education, 16, 39-50.
- Barberis, N., & Huang, M. (2008). Stocks as lotteries: The implications of probability weighting for security prices. American Economic Review, 98(5), 2066-100.
- Beck, T., Demirguc-Kunt, A., & Peria, M.S.M. (2007). Reaching out: Access to and use of banking services across countries. Journal of Financial Economics, 85(1), 234-266.
- Behrman, J.R., Mitchell, O.S., Soo, C.K., & Bravo, D. (2012). How financial literacy affects household wealth accumulation. The American economic review, 102(3), 300.
- Benartzi, Shlomo, & Richard, H.T. (2007). Heuristics and biases in retirement savings behavior. Journal of Economic Perspectives, 21(3), 81-104.
- Borden, L.M., Lee, S.A., Serido, J., & Collins, D. (2008). Changing college students’ financial knowledge, attitudes, and behavior through seminar participation. Journal of Family and Economic Issues, 29(1), 23-40.
- Braunstein, S., & Welch, C. (2002). Financial literacy: an overview of practice, research, and policy. Federal Reserve Bulletin, 88, 445-457.
- Brown, J.R., Farrell, A.M., & Weisbenner, S.J. (2015). Decision-Making Approaches and the Propensity to Default: Evidence and Implications (No. w20949). National Bureau of Economic Research.
- Calcagno, R., & Monticone, C. (2015). Financial literacy and the demand for financial advice. Journal of Banking and Finance, 50, 363-380.
- Campbell, J.Y. (2006). Household finance. Journal of Finance, 61(4), 1553-1604.
- Carlin, B.I., & Robinson, D.T. (2012). What does financial literacy training teach us? The Journal of Economic Education, 43(3), 235-247.
- Chen, H., & Volpe, R.P. (1998). An analysis of personal financial literacy among college students. Financial services review, 7(2), 107-128.
- Chu, Z., Wang, Z., Xiao, J.J., & Zhang, W. (2017). Financial literacy, portfolio choice and financial well-being. Social Indicators Research, 132(2), 799-820.
- Collins, J.M., & Orourke, C.M. (2010). Financial education and counseling-Still holding promise. Journal of Consumer Affairs, 44(3), 483-498.
- Consumer Federation of America/American Express (1991). Report of Findings, High School Competency Test, Consumer Federation of America. Consumer Interests Annual, 47, 1-3.
- Curcuru, S., Heaton, J., Lucas, D., & Moore, D. (2010). Heterogeneity and portfolio choice: Theory and evidence. Handbook of financial econometrics, 337-382.
- Danes, S.M., & Haberman, H. (2007). Teen financial knowledge, self-efficacy, and behavior: A gendered view. Journal of Financial Counseling and Planning, 18(2).
- Danes, S.M., & Hira, T.K. (1987). Money management knowledge of college students. Journal of Student Financial Aid, 17(1), 4-16.
- Danes, S.M., Huddleston-Casas, C., & Boyce, L. (1999). Financial planning curriculum for teens: Impact evaluation. Journal of Financial Counseling and Planning, 10(1), 26.
- Ferguson, R.W. (2002). Reflection on financial literacy. Remarks by vice chairman Roger W. Ferguson, Jr. before the National Council on Economic Education, Washington, D.C. Accessed.
- Fernandes, D., Lynch J.G., & Netemeyer, R.G. (2014). Financial literacy, financial education, and downstream financial behaviors. Management Science, 60(8), 1861-1883.
- Fernandes, D., Lynch, J.G., & Netemeyer, R.G. (2014). Financial literacy, financial education, and downstream financial behaviors. Management Science, 60(8), 1861-83.
- FINRA (2003). NASD Investor literacy research: Executive summary.
- Fox, J., Bartholomae, S., & Lee, J. (2005). Building the case for financial education. Journal of consumer affairs, 39(1), 195-214.
- Fox, J., Bartholomae, S., & Lee, J. (2005). Building the case for financial education. Journal of consumer affairs, 39(1), 195-214.
- Gale, W.G., & Levine, R. (2011). Financial Literacy: What Works? How Could It Be More Effective? How could it be more effective?
- Garman, E.T., & Forgue, R. (2000). Personal finances (6th ed.) Boston: Houghton Mifflin
- Gathergood, J., & Weber, J. (2015). Financial Literacy, Present Bias, and Alternative Mortgage Products. Present Bias and Alternative Mortgage Products (June 5, 2015).
- Goetzmann, W.N., & Kumar, A. (2008). Equity portfolio diversification. Review of Finance, 12(3), 433-463.
- Greenspan, A. (2001). Remarks by Chairman Alan Greenspan: The importance of financial literacy. Speech presented at the Community Affairs Research Conference of the Federal Reserve System.
- Greenspan, A. (2003). The importance of financial and economic education and literacy. Social Education, 67, 70- 72.
- Greenspan, A. (2005). The importance of financial education. Social Education, 69, 64-66.
- Guiso, L., & Jappelli, T. (2008). Financial literacy and portfolio diversification.
- Gustman, A.L., Steinmeier, T.L., & Tabatabai, N. (2012). Financial knowledge and financial literacy at the household level. The American Economic Review, 102(3), 309-313.
- Gutter, M.S., Garrison, S., & Copur, Z. (2010). Social learning opportunities and the financial behaviors of college students. Family and Consumer Sciences Research Journal, 38(4), 387-404.
- Hastings, J.S., Madrian, B.C., & Skimmyhorn, W.L. (2012). Financial literacy, financial education, and economic outcomes (No. w18412). National Bureau of Economic Research.
- Hilgert, M.A., Hogarth, J.M., & Beverly, S.G. (2003). Household financial management: The connection between knowledge and behavior. Fed. Res. Bull., 89, 309.
- Hira, T.K., & Loibl, C. (2005). Understanding the impact of employer?provided financial education on workplace satisfaction. Journal of Consumer Affairs, 39(1), 173-194.
- Hsiao, Y.J., & Tsai, W.C. (2018). Financial literacy and participation in the derivatives markets. Journal of Banking & Finance, 88, 15-29.
- Huberman, G. (2001). Familiarity breeds investment. Review of Financial Studies, 14(3), 659-680.
- Hung, A., Parker, A.M., & Yoong, J. (2009). Working paper. Defining and measuring financial literacy.
- Huston, S.J. (2010). Measuring financial literacy. Journal of Consumer Affairs, 44(2), 296-316.
- Jappelli, T., & Padula, M. (2013). Investment in financial literacy and saving decisions. Journal of Banking and Finance, 37(8), 2779-792.
- Johnson, E., & Sherraden, M.S. (2007). From Financial Literacy to Financial Capability among Youth. J. Soc. and Soc. Welfare, 34, 119.
- Jones C, P. (2013). Investments: Principles and Concepts. New York: John Wiley & Sons. Jumpstart Coalition (1997). High School Seniors Lack Financial Smarts Survey Shows.
- Jumpstart Coalition (2000). Financial Literacy declining among 12th Graders: Coalition Urges States to Include Personal Finance in Curriculum Standards.
- Kamil, N.S.S.N., Musa, R., & Sahak, S.Z. (2014). Examining the Role of Financial Intelligence Quotient (FiQ) in Explaining Credit Card Usage Behavior: A Conceptual Framework. Procedia-Social and Behavioral Sciences, 130, 568-576.
- Kim, J.H. (2001). Financial knowledge, subjective and objective financial well-being.
- Kim, J.H. (2001). Financial knowledge and subjective and objective financial well-being. Consumer Interests Annual, 47, 1-3.
- Kirchner, U., & Zunkel, C. (2011). Measuring Portfolio Diversification.
- Klapper, L., Lusardi, A., & Panos, G.A. (2013). Financial literacy and its consequences: Evidence from Russia during the financial crisis. Journal of Banking & Finance, 37(10), 3904-923.
- Lusardi, A., & Mitchell, O.S. (2006). Baby boomer retirement security: The roles of planning, financial literacy, and housing wealth (No. w12585). National Bureau of Economic Research.
- Lusardi, A., & Mitchell, O.S. (2007a). Baby boomer retirement security: The roles of Planning, financial literacy, and housing wealth. Journal of Monetary Economics, 54, 205-224.
- Lusardi, A., & Mitchell, O.S. (2007b,). Financial literacy and retirement Planning: New Evidence from the RAND American Life Panel.
- Lusardi, A., & Tufano, P. (2009). Debt literacy, financial experiences, and overindebtedness (No. w14808). National Bureau of Economic Research.
- Lusardi, A., & Tufano, P. (2009). Debt literacy, financial experiences, and over indebtedness (No. w14808). National Bureau of Economic Research.
- Lusardi, A., Mitchell, O.S., & Curto, V. (2014). Financial literacy and financial sophistication in the older population. Journal of Pension Economics and Finance, 13(04), 347-366.
- Lyons, A.C., Rachlis, M., & Scherpf, E. (2007). What’s in a score? Differences in consumers’ credit knowledge using OLS and quantile regressions. Journal of Consumer Affairs, 41(2), 223-249.
- Mandell, L. (2006). Financial Literacy: If it is so Important, Why isn't It Improving? Networks Financial Institute Policy Brief, (2006-PB), 08.
- Mandell, L. (2008). Financial literacy of high school students. In Handbook of consumer finance research, 163-183.
- Mandell, L. (2008). The financial literacy of young American adults. The Jumpstart Coalition for Personal Financial Literacy.
- Mandell, L., & Klein, L.S. (2007). Motivation and financial literacy. Financial services review, 16(2), p105.
- Markowitz, H.M. (1968). Portfolio selection: efficient diversification of investments. Yale University Press.
- Meacham, L.R. (2005). Bankruptcy Basics Applicable to Cases Filed on or After October 17, 2005.
- Miller, M., Godfrey, N., Levesque, B., & Stark, E. (2009). The case for financial literacy in developing countries: promoting access to finance by empowering consumers.
- Mitchell, O.S., & Lusardi, A. (2015). Financial Literacy and Economic Outcomes: Evidence and Policy Implications.
- Monticone, C. (2010). How much does wealth matter in the acquisition of financial literacy? Journal of Consumer Affairs, 44(2), 403-422.
- Moore, D.L. (2003). Survey of financial literacy in Washington State: Knowledge, behavior, attitudes, and experiences. Washington State Department of Financial Institutions.
- Moore, D.L. (2003). Survey of financial literacy in Washington State: Knowledge, behavior, attitudes, and experiences. Washington State Department of Financial Institutions.
- Morton, J.S, (2005). The interdependence of economic and personal finance education. Social Education, 69, 66-70.
- Mouna, A., & Jarboui, A. (2015). Financial literacy and portfolio diversification: an observation from the Tunisian stock market. International Journal of Bank Marketing, 33(6), 808-822.
- OECD (2005). Improving Financial Literacy: Analysis of Issues and Policies. Paris: OECD Publishing.
- Peng, T.C.M., Bartholomae, S., Fox, J.J., & Cravener, G. (2007). The impact of personal finance education delivered in high school and college courses. Journal of Family and Economic Issues, 28(2), 265-284.
- Perraudin, W. R., & Sørensen, B. E. (2000). The demand for risky assets: Sample selection and household portfolios. Journal of Econometrics, 97(1), 117-144.
- Remund, D.L. (2010). Financial literacy explicated: The case for a clearer definition in an increasingly complex economy. Journal of Consumer Affairs, 44(2), 276-295.
- Robb, C.A., & Sharpe, D.L. (2009). Effect of personal financial knowledge on college students’ credit card behavior. Journal of Financial Counseling and Planning, 20(1).
- Ruffino, D. (2014). Resuscitating businessman risk: A rationale for familiarity-based portfolios. Review of Economic Dynamics, 17(1), 107-130.
- Sabri & Mohamad, F.F. (2011). Pathways to financial success: Determinants of financial literacy and financial wellbeing among young adults" Graduate Theses and Dissertations, P11205.
- Stevens, J.P. (2012). Applied multiple statistics for the social sciences. Routledge.
- Tabachnick, B.G., & Fidell, L.S. (2013). Using multiple statistics. Boston: Pearson Education.
- Tennyson, S., & Nguyen, C. (2001). State curriculum mandates and student knowledge of personal finance. Journal of Consumer Affairs, 35(2), 241-262.
- U.S. Financial Literacy and Education Commission (2007). Taking ownership of the future: The national strategy for financial literacy. Retrieved from http://205.168.45.52/sites/default/files/downloads/ownership.pdf
- Upson, R.B., Jessup, P.F., & Matsumoto, K. (1975). Portfolio diversification strategies. Financial Analysts Journal, 31(3), 86-88.
- Van Nieuwerburgh, S., & Veldkamp, L. (2010). Information acquisition and under-diversification. The Review of Economic Studies, 77(2), 779-805.
- Van Rooij, M., Lusardi, A., & Alessie, R. (2011). Financial literacy and stock market participation. Journal of Financial Economics, 101(2), 449-472.
- Varcoe, K.P., Martin, A., Devitto, Z., & Go, C. (2005). Using a financial education curriculum for teens. Journal of Financial Counseling and Planning, 16(1).
- Vitt, L.A. (2005). Goodbye to complacency: Financial literacy education in the US 2000-2005. AARP.
- Volpe, R.P., Chen, H., & Pavlicko, J.J. (1996). Personal investment literacy among college students: A survey. Financial Practice and Education, 6(2), 86-94.
- Volpe, R.P., Chen, H., & Pavlicko, J.J. (1996). Personal investment literacy among college students: A survey. Financial Practice and Education, 6(2), 86-94.
- Volpe, R.P., Kotel, J.E., & Chen, H. (2002). A survey of investment literacy among online investors. Journal of Financial Counseling and Planning, 13(1), 1.
- Wachira, M.I., & Kihiu, E.N. (2012). Impact of financial literacy on access to financial services in Kenya. International Journal of Business and Social Science, 3(19).
- Walstad, W.B., Rebeck, K., & MacDonald, R.A. (2010). The effects of financial education on the financial knowledge of high school students. Journal of Consumer Affairs, 44(2), 336-357.
- Woerheide, W., & Persson, D. (1993). An index of portfolio diversification. Financial services review, 2(2), 73-85.
- Zarcadoolas, C., Pleasant, A., & Greer, D.S. (2009). Advancing health literacy: A framework for understanding and action, 45.
- Zhan, M., Anderson, S.G., & Scott, J. (2006). Financial knowledge of the low-income population: Effects of a financial education program. J. Soc. and Soc.
- Welfare, 33, 53.Abreu, M., & Mendes, V. (2010). Financial literacy and portfolio diversification. Quantitative Finance, 10(5), 515-528.