Research Article: 2022 Vol: 26 Issue: 1S
Foreign Direct Investment (Fdi) In India and Its Impact on Economic Development an Empirical Assessment
Sameer Shekhar, Indian Institute of Foreign Trade (IIFT)
N. Jena, Head-EXIM & Logistics, Jindal Stainless Limited
Nitin Seth, Indian Institute of Foreign Trade (IIFT)
Citation Information: Shekhar, S., Jena, N., & Seth, N. (2022). Foreign direct investment (fdi) in India and its impact on economic development an empirical assessment. Academy of Marketing Studies Journal, 26(S1), 1-8.
Abstract
The concept of FDI in modern days of business acquires enormous significance across the world economy, as it enables and strengthens an economy with greater productive capacity and act as vital economic device through which the economy attains big leap amidst tough and extremely competitive environment. In the aura of globalization FDI has great value across the world. In 1991, when the new economic policy was introduced with special provisions of liberalization, privatization and globalization, various countries started to invest in our economy. It is also a fact that, no economy stays isolated and unaffected from anything that happens around the world these days. Considering the same it is an effort to investigate the impact of foreign direct capital investment pattern on export and economic growth for the period of 20 years from 2000-01 to 2019-20. The present study is concerned with the assessment of trend in foreign direct equity capital investment as explanatory variable, and gross export and gross domestic product value as response variable. Linear regression model using NCSS 2020, and SPSS has been applied to reach the inferences regarding degree of influence of the dependent variable on independent variable. The study also provides an overview of the growth trend in FDI inflow, FII inflow for the 20 years in which financial crisis 2008-09 has been assumed as a landmark to compare the change in the trends of investment before and after the crisis.
Keywords
FDI, Inflow, Investment, Economic Growth, Association, Impact.
Introduction
The concept of FDI gathered momentum in Indian context much frequently after 1991 under the effect of new economic policy. The year proved as a breakthrough by adopting more pragmatic and scientific patterns and policies of economic development that almost revolutionized the economic scenario of the country by opening up its door to the world market. Our country has been holding the identity of agriculture-based economy which contributed almost more than half of the GDP fifty years back. With the passes of time, the contribution of primary sector, industrial sector and service sector changed, and now the service sector has become the largest contributor. Our economy has abundant of natural, commercial and human resources, but there is need of proper planning, execution, management and capital to exploit them along excellence and skill that productivity could be maximized, and economic prosperity could be further extended. FDI meant to all such requirements. In 2008, when U.S. economy was exposed to the financial crisis, the impact of the economic downturn crossed all border due to withdrawal of caps from different economies by different nation. Although, the experts urged that the Indian economy would not be affected much severely, even then the FDI inflow was affected by remarkably. Undoubtedly, Indian economy, industries, infrastructural development, service sectors, education, health, and tourism sectors etc. were badly affected by the financial crisis.
Literature Survey and Methodology Development
There are many studies conducted to examine the impact of FDI on export and economic growth (GDP as the growth indicator) of India However, the attention of researchers has gained momentum after long to access the impact of foreign equity investment on economic development. The comprehensive understanding about assessment of the relationship between FDI and Export, and FDI and GDP and impact of FDI have been reflected in various researches in Indian context (Chadee & Schlichting, 1997; Sharma, 2000; Chakraborty & Basu, 2002; Chakrabory & Nunnenkamp, 2008; Prasanna, 2010; Anitha, 2012; Singh et al. 2012; Barua, 2013; Chandrachud & Gajalakshmi, 2013; Sultan, 2013; Saleena, 2013; Dwivedi & Badge, 2013; Malhotra, 2014; Singh & Tandon, 2015; Sengupta & Puri, 2020). This study helps to develop and adopt the model for association assessment and impact analysis. Two equations have been therefore developed along the rationale provided by the studies conducted earlier and have been adopted to reach the inferences.
The study is causal in nature aims at exploring the impact of foreign capital equity investment completely based on secondary data collected from Economic Survey of India, 2019-20 as well as national and global database i.e., World bank data bank, UNCTAD data portal and Indiastat. Literatures to draw the best suited model on requisite result and nature of data have been consulted from the studies which have been carried in Indian context only. For the purpose of this study, data on all the set of variables i.e., FDI data, export data and GDP data have been taken into account for the last 20 years period ranging from FY 2000-01 to FY 2019-20. To meet the stated objectives of examining the trend overview, simple statistical calculations have been made and depicted through tables, graphical representations, and pie charts. To measure the impact of FDI on Economic growth indicator i.e., Gross Domestic Product (GDP) and on export performance, simple linear regression model has been used.
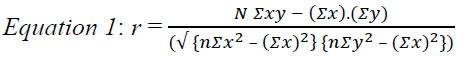
Association among the Variable Considered for Assessment: To trace the association between the data set of FDI, Export and GDP, Karl Pearson’s correlation statistics has been used where, the correlation co-efficient is denoted by ‘r’ which has been computed along following formula:
Impact of FDI on Economic Growth: To examine the impact of Foreign Direct Investment on Economic Growth (i.e., indicator of the economic development – GDP) a model is considered as in equation 2 along function of Y i.e., Y = f (FDI):
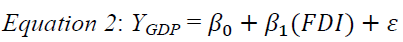
Where, Y is response variable representing Economic Growth β0, is total factor intercept β1, represents foreign direct investment, which is explanatory variable, and ε is error term.
Both the equations (1 & 2) have been implied to examine the degree of correlation and degree of impact on the given set of data for the period from 2000-01 to 2019-2020.
Data: The data on FDI shows that till 2008-09, equity capital and total FDI kept on increasing gradually, but after the year which had repercussions of U.S. financial crisis across the global investment and economy there was abrupt fall in the annual investments, however cannot be concluded the fall in the trend was only due to financial crunch as during the period from 2010 to 2020, the fall was also experienced during 2012-13, and in the period later to that have been found increasing up to 2010-20. Foreign Institutional Investment (FDI) have been found continuously fluctuating. The export has also been found decreased during 2008- 09 and 2012-13. Of course, the earlier one was as result of financial slump and the later one was due to demand driven slowdown in the economy. Table 1 presents the values and trends in growth total FDI comprises of equity capital inflow, reinvested earnings inflow into unincorporated bodies and other capitals. An additional column reflecting foreign institutional investment has also been presented Figures 1 & 2.
| Table 1 Equity Capital FDI Inflow in India During the Last 20 Financial Years | ||||||||
| Financial Years | Equity Capital FDI Inflow | Total FDI Inflow | Total FII Inflow | GDP | Export | |||
| Values | % Growth | Values | % Growth | Values | % Growth | Values | Value | |
| 2000-01 | 2463 | - | 4029 | - | 1847 | - | 21774130 | 44076 |
| 2001-02 | 4065 | (+) 65 % | 6130 | (+) 52 % | 1505 | (-) 19 % | 23558450 | 43827 |
| 2002-03 | 2705 | (-) 33 % | 5035 | (-) 18 % | 377 | (-) 75 % | 25363270 | 52719 |
| 2003-04 | 2188 | (-) 19 % | 4322 | (-) 14 % | 10918 | (+) 2796% | 28415030 | 63843 |
| 2004-05 | 3219 | (+) 47 % | 6051 | (+) 40 % | 8686 | (-) 20 % | 32422090 | 83536 |
| 2005-06 | 5540 | (+) 72 % | 8961 | (+) 48 % | 9926 | (+) 14 % | 36933690 | 103091 |
| 2006-07 | 12492 | (+) 125 % | 22826 | (+) 155 % | 3225 | (-) 68 % | 42947060 | 126414 |
| 2007-08 | 24575 | (+) 97 % | 34843 | (+) 53 % | 20328 | (+) 530 % | 49870900 | 163132 |
| 2008-09 | 31396 | (+) 28 % | 41873 | (+) 20 % | 15017 | (-) 174 % | 56300630 | 185295 |
| 2009-10 | 25834 | (-) 18 % | 37745 | (-) 10 % | 29048 | (-) 293 % | 64778270 | 178751 |
| 2010-11 | 21383 | (-) 17 % | 34847 | (-) 08 % | 29422 | (+) 1 % | 77841150 | 249816 |
| 2011-12 | 35121 | (+) 64 % | 46556 | (+) 34 % | 16812 | (-) 43 % | 90097220 | 305964 |
| 2012-13 | 22423 | (-) 36 % | 34298 | (-) 26% | 27582 | (+) 64 % | 99440130 | 300401 |
| 2013-14 | 24299 | (+) 8% | 36046 | (+) 5% | 5009 | (-) 82 % | 112335220 | 314405 |
| 2014-15 | 29737 | (+) 22% | 45148 | (+) 25% | 40923 | (+) 717 % | 124679690 | 310338 |
| 2015-16 | 40001 | (+) 35% | 55559 | (+) 23% | 4016 | (-) 110 % | 137718740 | 262291 |
| 2016-17 | 43478 | (+) 9% | 60220 | (+) 8% | 7735 | (-) 293 % | 153916690 | 275852 |
| 2017-18 | 44857 | (+) 3% | 60974 | (+) 1% | 22165 | (+) 187 % | 170983040 | 303526 |
| 2018-19 | 44366 | (-) 1% | 62001 | (+) 2% | 2225 | (-) 110 % | 189712370 | 330078 |
| 2019-20 | 49977 | (+) 13% | 74390 | (+) 20% | 552 | (-) 125 % | 203398490 | 313361 |
| Cumulative Total FDI | 470119 | 681854 | 214802 | 1742486260 | 4010716 | |||

Figure 1 Trendlines of Equity Capital Investment, Total FDI, and FII

Figure 2 Linear Regression Plot (Export)
(Values in US$ million).
Considering the data presented in Table 1, data on FDI, GDP and export have been used in this study.
Results and Discussion
To reach the inference regarding strength association between FDI, Export and GDP mutually correlation analysis has been done. Table 2 demonstrates the Pearson correlation coefficient result and degree of significance among the three variables. The correlation coefficient result reflects that the association between FDI and export is significant (strong correlation with coefficient of 0.892) at 99 percent confidence level.
| Table 2 Correlations | ||||
| FDI | EXPORT | GDP | ||
| FDI | Pearson Correlation | 1 | 0.892** | 0.927** |
| Sig. (2-tailed) | - | 0.000 | 0.000 | |
| EXPORT | Pearson Correlation | 0.892** | 1 | 0.877** |
| Sig. (2-tailed) | 0.000 | - | 0.000 | |
| GDP | Pearson Correlation | 0.927** | 0.877** | 1 |
| Sig. (2-tailed) | 0.000 | 0.000 | - | |
| **Correlation is significant at the 0.01 level (2-tailed). | ||||
The correlation between FDI and GDP is very strong at 99 percent confidence level with coefficient of 0.927, and that between export and GDP has also been found very strong at the same confidence level with coefficient of 0.877.
The Model Summary of the regression result in Table 3 reveals R = 0.927 explaining the degree of association between the predictors FDI and dependent variable i.e., GDP. Further, the value of R-Square which is also called coefficient of determination has been found 0.851 reveals that 85.1 percent of variance in GDP is explained by the predictors and is an overall measure of strength of association. Significance value of ANOVA table i.e., 0.000 being less than the table value at 95% level of confidence reveals that the data set is perfect for running regression.
| Table 3 Values Extracted from Model Summary & ANOVA Tables | ||||||
| Model Summary | ANOVA | |||||
| R | R Square | Adjusted R Square | Df Total | F | Sig. | |
| FDI Explaining GDP | 0.927 | 0.859 | 0.851 | 19 | 109.655 | 0.000 |
| FDI Explaining Export | 0.892 | 0.796 | 0.784 | 19 | 70.033 | 0.000 |
Table 4 reveals that the beta coefficient of FDI is 4.258 stating that 1 unit of change in FDI has been found bringing change in export by 4.258 units indicating significant influence over export.
| Table 4 Regression Coefficient | |||||
| Model | Unstandardized Coefficients | Standardized Coefficients | t | Sig. | |
| B | Std. Error | Beta | |||
| (Constant) | 55362.732 | 20616.397 | 2.685 | .015 | |
| FDI | 4.258 | .509 | .892 | 8.369 | .000 |
| a. Dependent Variable: Export | |||||
The equation of the straight-line relating Export and FDI is estimated as: Export=(0.0000)+(5.4079) FDI using the 20 observations in this dataset. The y-intercept, the estimated value of Export when FDI is zero, is 0.0000 with a standard error of NA. The slope, the estimated change in Export per unit change in FDI, is 5.4079 with a standard error of 0.3167. The value of R-Squared, the proportion of the variation in Export that can be accounted for by variation in FDI, is 0.9388. The correlation between Export and FDI is 0.0000. A significance test that the slope is zero resulted in a t-value of 17.0750. The significance level of this t-test is 0.0000. Since 0.0000<0.0500, the hypothesis that the slope is zero is rejected. The estimated slope is 5.4079. The lower limit of the 95% confidence interval for the slope is 4.7450 and the upper limit is 6.0708. The estimated intercept is 0.0000 Figures 3 & 4.

Figure 3 Distributional Plot (FDI & Export)

Figure 4 Linear Regression Plot (GDP)
The equation of the straight-line relating GDP and FDI is estimated as: GDP=(0.0000) + (2520.8196) FDI using the 20 observations in this dataset. The y-intercept, the estimated value of GDP when FDI is zero, is 0.0000 with a standard error of NA. The slope, the estimated change in GDP per unit change in FDI, is 2520.8196 with a standard error of 123.0093. The value of R-Squared, the proportion of the variation in GDP that can be accounted for by variation in FDI, is 0.9567 Figure 5. The correlation between GDP and FDI is 0.0000.

Figure 5 Distributional Plot (FDI & GDP)
A significance test that the slope is zero resulted in a t-value of 20.4929. The significance level of this t-test is 0.0000. Since 0.0000 < 0.0500, the hypothesis that the slope is zero is rejected. The estimated slope is 2520.8196. The lower limit of the 95% confidence interval for the slope is 2263.3582 and the upper limit is 2778.2811, and the estimated intercept is 0.0000.
Table 5 reveals that the beta coefficient of FDI is 2436.693 stating that 1 unit of change in FDI has been found bringing change in GDP by 2436.69 units indicating huge influence over economic growth of the country.
| Table 5 Regression Coefficient | |||||
| Model | Unstandardized Coefficients | Standardized Coefficients | T | Sig. | |
| B | Std. Error | Beta | |||
| (Constant) | 4050857.574 | 9428124.260 | 0.430 | 0.673 | |
| FDI | 2436.693 | 232.695 | 0.927 | 10.472 | 0.000 |
| a. Dependent Variable: GDP | |||||
Conclusion
The study reveals that FDI plays vital role in India’s export and economic growth and is having strong association mutually. For the purpose of investigating structural changes in the economy caused by foreign direct investment, a basic regression model was developed having done the review of concerned literature. The coefficient validated the greater influence in growth indicator i.e., GDP caused by a unit change in FDI as compared to the influence of FDI on export of India. This clearly conclusive evidence that foreign investment act as driver for other economic activities economy and not just export. Thus, more FDI inflow will lead to more developmental activities and thus growth of the economy.
References
Anitha, R. (2012). Foreign Direct Investment and Economic Growth in India. International Journal of Marketing, Financial Services & Management Research, 1(8), 108-125.
Sharma, K. (2000). Export Growth in India, Has FDI Played a Role? Economic Growth Centre: Yale University. Centre Discussion Paper No. 0816. Retrieved from http://ageconsearch.umn.edu/bitstream/28372/1/dp000816.pdf
Singh, A.B., & Tandon, P. (2015). Causality between FDI inflows and export with reference to India: an analysis. IUP Journal of Applied Economics, 14(3), 59.
Singh, J., Chadha, S., & Sharma, A. (2012). Foreign Direct Investment in India: An Analytical Study. International Journal of Engineering and Science, 1(5), 34-42.