Research Article: 2026 Vol: 30 Issue: 2
From Enthusiasm to Skepticism: Market Learning and Corporate Net-Zero Commitments in an Emerging Economy
Dhanush M N, National Forensic Science University, Gandhinagar, Gujarat
Shivakashi Sharma, IIBS, Bengaluru, Karnataka
Haresh Barot, National Forensic Science University, Gandhinagar, Gujarat
Citation Information: M.N., D, Sharma., S & Barot., H. (2026). From enthusiasm to skepticism: market learning and corporate net-zero commitments in an emerging economy. Academy of Marketing Studies Journal, 30(S3), 1-8.
Abstract
The current research examines the stock market's reaction to 30 corporate Net Zero commitment announcements in India from 2020 to 2025. While the aggregate short-term abnormal return is statistically insignificant 11-day CAAR = -0.08, p = 0.940, this neutrality masks a powerful underlying dynamic: market learning. The research document a stark time-varying reaction. Early announcements 2020–2021 were met with significant market enthusiasm Mean CAR = +3.03, a period characterized by high return variance. This reaction reversed dramatically in subsequent years 2022–2023: Mean CAR = -2.85, as the market converged on a new, skeptical consensus. This finding suggests investors initially rewarded the signaling value of climate commitments but, with experience, became more discerning, focusing on implementation costs and greenwashing risks. We find significant cross-sectional heterogeneity, with the Energy sector facing the most severe penalties Mean CAR = -3.38. While statistically insignificant due to low power, the research documents a large economic long-term negative drift, with 12-month Buy-and-Hold Abnormal Returns BHAR of -5.98. This study provides the first large-sample evidence from India, demonstrating that market reactions to ESG commitments are not static and that investors in emerging markets are actively learning and re-evaluating the credibility of corporate climate pledges.
Keywords
Event Study, Net-Zero, Esg, Corporate Social Responsibility, Market Learning, Climate Finance, Emerging Markets, India, Abnormal Returns.
Introduction
The proliferation of corporate commitments to achieve "Net-Zero" greenhouse gas emissions represents one of the most significant trends in corporate strategy and finance over the past decade. Driven by institutional investor pressure, shifting consumer preferences, evolving regulatory landscapes (such as the Securities and Exchange Board of India's Business Responsibility and Sustainability Reporting (BRSR) mandates), and a global surge in publications and investor focus on climate risk (Nicolas et al., 2024), particularly post-Paris Agreement (Alessi et al., 2021), this trend has accelerated. This contrasts with prior decades where such commitments were often viewed as unproductive costs (Lins et al., 2017). However, a critical question for financial economics remains: are these announcements credible signals of future value, or are they a form of "greenwashing" (e.g., Bingler et al., 2022; Reboredo & Otero, 2021) representing uncosted agency problems?
This paper investigates this question in a novel and crucial context: India, one of the world's largest economies and greenhouse gas emitters. The Indian market provides a unique laboratory. Its government has set ambitious renewable energy targets, yet its economy remains heavily reliant on fossil fuels. This creates a high-tension environment where the transition risks and opportunities of Net-Zero pledges are magnified. Furthermore, the financial impact of ESG in emerging markets is a distinct field of study (Shin et al., 2023; Samitas et al., 2021), as stakeholder expectations and cultural contexts can differ significantly from those in developed economies, where most research is concentrated (e.g., 'Can these practices...' 2024).
However, this aggregate neutrality conceals the paper's primary contribution: a powerful time-varying market reaction consistent with a "market learning" hypothesis (Berman et al., 2019). This aligns with models of demand learning and time-varying reactions (Nakajima, 2011), where firms and investors update their beliefs in response to new information and changing market structures. The analysis, detailed in Figure 1, reveals a dramatic reversal in investor sentiment. Announcements made in the early period 2020–2021 were met with significant optimism, generating a positive Mean CAR of +3.03. This period was characterized by high return variance, suggesting investors were uncertain how to price these novel commitments Figure 1. In sharp contrast, announcements from 2022–2023 generated a negative Mean CAR of -2.85, with lower return variance, suggesting the market had converged on a new, skeptical consensus. This finding suggests that "early-mover" enthusiasm gave way to "late-mover" skepticism as investors became more sophisticated, more aware of implementation hurdles, and more cynical about corporate "cheap talk" (Lyon et al., 2013).
This paper contributes to the literature in three ways. First, we provide the first large-sample empirical evidence on market reactions to Net-Zero commitments in the crucial emerging market of India. While prior work has examined CSR and shareholder value in India e.g., Corporate social responsibility... 2022, this study is the first to focus specifically on the time-varying reaction to climate pledges. Second, we add to the literature on ESG signaling e.g., Flammer, 2013; Godfrey et al., 2009 by providing evidence of a dynamic, time-varying reaction, which we attribute to market learning. We show that the timing of an ESG commitment is a critical determinant of its valuation effect. Third, we offer a nuanced finding that challenges simple heuristics, showing that sectoral risk Figure 2 and firm-level idiosyncrasies Figure 3A dominate a simple high/low-carbon classification Figure 3B.
The paper proceeds as follows. Section 2 reviews the literature and develops our hypotheses. Section 3 describes the data and empirical methodology. Section 4 presents our empirical results. Section 5 discusses the implications of our findings and concludes. Section 7 provides our references, and Section 8 contains the Appendix.
Literature Review and Hypothesis Development
Methodology and CSR Announcements
The event study, as formalized by Fama, Fisher, Jensen, and Roll 1969 and reviewed by MacKinlay 1997, remains the dominant methodology for assessing the valuation impact of new information (Armitage, 1995; Kothari & Warner, 2007). The methodology's power lies in its ability to isolate the price effect of a specific event the "abnormal return" by netting out market-wide movements (Ball & Brown, 2013), a method refined by Brown & Warner 1985.
A vast literature has applied this method to Corporate Social Responsibility CSR and Environmental, Social, and Governance ESG announcements. This literature is bifurcated. One stream, aligned with signaling theory, finds positive market reactions. For instance, Flammer 2013 finds that US firms announcing eco-friendly initiatives experience positive abnormal returns, suggesting investors value these pro-social actions. This positive view is often linked to risk-management hypotheses (Godfrey et al., 2009), or the value of social capital and trust (Lins et al., 2017; Servaes & Tamayo, 2015). Another stream, grounded in agency theory, finds negative reactions e.g., Fisher-Vanden & Thorburn, 2011; Jacobs et al., 2010, or, in many cases, a neutral reaction (Krüger, 2015), positing that ESG commitments are a form of managerial "pet project" or "greenwashing" (Aouadi & Ma, 2023) that diverts resources without creating shareholder value. This is particularly true for announcements of stricter ESG regulations (Nicolas et al., 2024), which can lead to short-term negative market reactions as investors price in compliance costs.
Hypothesis Development
Our study enters this debate in the specific context of Net-Zero pledges in an emerging market.
• H1: Aggregate Market Reaction. If investors in India perceive Net-Zero pledges as credible signals of reduced climate risk, improved efficiency, or access to "green capital," we would expect a positive aggregate reaction (Signaling Theory). Conversely, if investors view them as costly, unfunded mandates or as non-committal "greenwashing" (Agency Theory), we would expect a negative or neutral reaction. Given the high costs and implementation uncertainty in an emerging economy, we hypothesize a skeptical baseline.
º H1: The aggregate cumulative abnormal return (CAAR) surrounding Net-Zero announcements by Indian firms is non-positive.
• H2: Market Learning and Time-Varying Reactions. The context of Net-Zero pledges has evolved rapidly. What was a novel, differentiating signal in 2020 may have become "table stakes" or even a "red flag" for costly implementation by 2023. As investors observe the first wave of pledges and the (lack of) subsequent action or high costs, they "learn” and update their priors, a concept explored in finance through time-varying parameter models (Nakajima, 2011). We hypothesize that initial enthusiasm will give way to skepticism.
º H2: The market reaction to Net-Zero announcements will become significantly more negative over time, with earlier announcements outperforming later ones.
• H3: Cross-Sectional Heterogeneity (Transition Risk). The costs and benefits of a Net-Zero pledge are not uniformly distributed. For a software company (e.g., Infosys), the pledge is low-cost and credible. For a fossil-fuel-based utility (e.g., NTPC) or refiner (e.g., Reliance), the pledge represents an existential and colossally expensive business model transformation. We hypothesize that the market will penalize firms with higher "transition risk," often proxied by carbon intensity (In et al., 2019; Chava, 2014).
º H3: The market reaction will be significantly more negative for firms in high-transition-risk sectors (e.g., Energy) and those with higher carbon intensity.
• H4: Long-Term Performance. If Net-Zero pledges are value-destructive—either because they are genuinely costly to implement or because they are a managerial distraction ("greenwashing") this should be reflected in long-term underperformance. A neutral short-term reaction (H1) followed by negative long-term performance would suggest the market initially failed to price the long-term costs.
º H4: Firms announcing Net-Zero commitments will experience negative long-term buy-and-hold abnormal returns (BHAR) in the year following the announcement.
Data and Empirical Design
Sample Collection
We manually collected a sample of 30 distinct, first-time Net-Zero commitment announcements from firms listed on the NIFTY 200 index. The sample spans from 2020 to 2025. The full list of 30 firms is provided in the Appendix Table A1. For each firm, we identified the event date t = 0 as the first public announcement of the pledge. The sample is diverse, covering 7 sectors, including Technology 6 firms, Energy 6 firms, and Heavy Industry 4 firms.
Event Study Methodology
We follow the standard event study procedure (MacKinlay, 1997; Brown & Warner, 1985)
Market Model Estimation
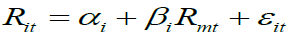
We calculate abnormal returns using the market model, which is superior to a simple market-adjusted model as it accounts for firm-specific risk beta. For each firm i, we estimate the market model parameters alpha i and beta i via OLS regression:
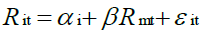
where Ri,t is the log return of firm i on day t, and Rm,t is the log return of the NIFTY 500 index our market proxy. As confirmed by Table 1, the estimation window is 190 days, from t = -200 to t = -11. We use heteroskedasticity-consistent HC1 standard errors to ensure robustness. Our model estimation produced an average beta of 1.01 and an average R squared of 30, which is considered a good fit for the Indian market.
| Table 1 Aggregate Abnormal Returns and Robustness Checks | ||||||
| Event Window | N | CAAR (%) | t-test (p-val) | Patell test (p-val) | Sign test (p-val) | Wilcoxotest (p-val) |
| Short (3-day) [-1, +1] | 30 | +0.052 | 0.935 | 0.482* | 0.465* | 0.428* |
| Main (11-day) [-5, +5] | 30 | -0.076 | 0.940 | 0.482 | 0.465 | 0.428 |
| Long (21-day) [-10, +10] | 30 | +1.957 | 0.218 | 0.482* | 0.465* | 0.428* |
Abnormal and Cumulative Returns
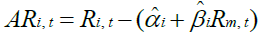
The Abnormal Return AR for firm i on event day t is the residual from the estimated model:
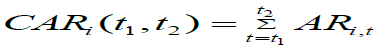
The Cumulative Abnormal Return CAR for firm i over the event window t1 to t2 is the sum of these abnormal returns:
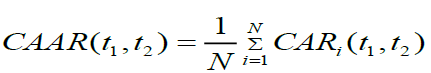
We calculate the Cumulative Average Abnormal Return CAAR by averaging the CARs across all N firms in the sample:
Our primary event window is the 11-day period [-5, +5]. We conduct robustness checks using a 3-day window [-1, +1] and a 21-day window [-10, +10]. This short-term window is standard for capturing immediate investor reactions, following prior CSR event studies (Flammer, 2013; Krüger, 2015).
Statistical Tests
To test the null hypothesis that CAAR = 0, we employ a battery of four robust statistical tests:
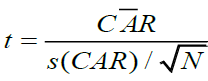
1. Standard Cross-Sectional t-test: A parametric test on the cross-sectional distribution of CARs.
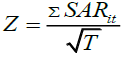
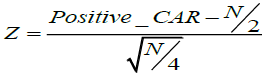
2. Patell 1976 Z-test: A parametric test that uses standardized abnormal returns SAR to account for event-induced variance increases.
3. Sign Test: A non-parametric test on the ratio of positive to negative CARs, robust to outliers.
4. Wilcoxon Signed-Rank Test: A non-parametric test that ranks the magnitudes of CARs, also robust to non-normality.
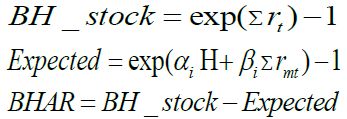
Long-Term Performance (BHAR)
To test H4, we measure long-term performance using Buy-and-Hold Abnormal Returns (BHAR) (Barber & Lyon, 1997; Sorescu et al., 2017). BHAR measures the return from a strategy of buying the announcing firm at the end of the event window and holding it for T months, compared to holding a benchmark portfolio. We calculate the 3-month, 6-month, and 12-month BHARs. While BHAR is a common method for long-horizon studies (Lyon et al., 1999), we acknowledge its methodological challenges, most notably the "bad-model problem" identified by Fama 1998. These studies note that BHARs can compound estimation errors over long periods (Kothari & Warner, 2007). Alternative methods, such as calendar-time portfolios CTP (Fama, 1998); Improved calendar 2014, exist, but BHAR remains a standard approach for illustrating long-term drift. We therefore present our BHAR results with this statistical caveat in mind.
Algorithms
The below segment details about the algorithms implemented for the study.
Algorithm 1: Overall Workflow
BEGIN Enhanced_Event_Study
LOAD required libraries (pandas, numpy, statsmodels, scipy, matplotlib)
SET configuration parameters
• Estimation window: [-250, -31]
• Event windows: 3-day, 11-day, 21-day
• Long-term horizons: 3, 6, 12 months
• Output directories for tables and figures
PART 1: Load Firm Characteristics
1. Create list of NIFTY 50 + major Indian firms
2. Assign attributes:
Sector, Sector Group
º Event Date
º Net-Zero Target Year → Time Horizon
º High Carbon vs Low Carbon classification
º Keep window [-260, +260]
OUTPUT: Event-time merged dataset
PART 2: Download Stock Prices
For each firm:
• Retrieve adjusted daily price history (-400 to +400 days)
• Validate minimum data threshold
• Download market index (^NSEI or fallback)
OUTPUT: Clean price panel dataset
PART 3: Compute Returns
For each firm and market:
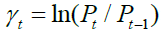
• Compute log returns:
OUTPUT: Stock return panel and market return series
PART 4: Build Event-Time Structure
For each firm:
• Align daily observations around event date
• Compute Event_Time = t − t_event
• Two-sample t-test
PART 5: Estimate Market Model (OLS)
For each firm:
• Use estimation window [-250, -31]
• Estimate:
• Store αi, βi, σi and diagnostics
Filter firms with insufficient estimation window
PART 6: Compute Abnormal Returns
For each observation:
• Expected_Return = αi + βiRmt
• AR = Rit − Expected_Return
• SAR = AR / σi
PART 7: Analyze Multiple Event Windows
For each window {3-day, 11-day, 21-day}:
• Compute firm-level CARi
• Compute CAAR
• Conduct statistical tests:
º t-test
º Patell Z-test
º Sign test
º Wilcoxon signed-rank test
PART 8: Sectoral & Carbon-Intensity Analysis
• Group CARs by sector
• Compute descriptive statistics
• Compare High vs Low Carbon firms
• Long-term BHAR plots
END Enhanced_Event_Study
PART 9: Temporal Evolution Analysis
Partition firms by:
• 2020–2021
• 2022–2023
• 2024–2025
Compute mean CAR and test differences
PART 10: Cross-Sectional Determinants
Define dependent variable:
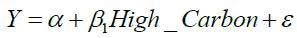
Estimate:
• Model 1: High_Carbon
• Model 2: High_Carbon + Size
• Model 3: High_Carbon + Time_Horizon
• Model 4: High_Carbon + Period Dummies
• Model 5: Full Model
PART 11: Long-Term Performance (BHAR)
For each horizon {3m, 6m, 12m}:
• Compute buy-and-hold stock return
• Compute expected return using αi and βi
• BHAR = Actual − Expected
• Conduct t-test and Wilcoxon test
PART 12: Generate Figures
• CAAR robustness
• Sectoral CAR distribution
• Time evolution
• Carbon intensity comparison
Algorithm 2: Statistical Testing Framework
For each event window:
INPUT: ARit, CARi, SARit
• t-test:
• Patell Z-test:
• Sign Test:
Wilcoxon Signed-Rank Test
OUTPUT: p-values and significance levels
Algorithm 3: Long-Term BHAR Calculation
For each firm and horizon H ∈ {63, 126, 252}:
Algorithm 4: Cross-Sectional Regression Models
Set:
• Model 1:
• Model 2:

• Model 3:

• Model 4:

• Model 5 (Full):

Empirical Results
Aggregate Market Reaction and Robustness (H1)
The research begins by testing H1, which posits a non-positive aggregate market reaction. Table 1 presents the results for our three event windows. This table presents the Cumulative Average Abnormal Returns (CAAR) for the full sample of 30 firms across three event windows. P-values are reported for four statistical tests.
The results in Table 1, Figure 4 are unambiguous. For the main 11-day window, the CAAR is -0.076, which is economically negligible and statistically indistinguishable from zero t-test p = 0.940. This result is robust across all four statistical tests. The 3-day window is similarly neutral. The 21-day window shows a positive but still insignificant CAAR p = 0.218. This longer window may be capturing other confounding positive news Figure 4.
Based on this evidence, we fail to reject the null hypothesis. The aggregate market reaction to Net-Zero announcements in India is neutral. This supports H1, suggesting that, on average, the market does not view these announcements as value-creating or value-destroying. However, as we show next, this aggregate neutrality is misleading.
The Dynamics of Market Perception: Market Learning (H2)
Next, the research tests H2 by partitioning our sample by time period. The "Key Story" is that the market's reaction evolved as investors learned. Figure 2 (Panels A and B) and Table 2 present these striking results.
| Table 2 Time Evolution of Market Reactions | ||
| Announcement Period | N | Mean CAR (%) |
| 2020–2021 | 11 | +3.026 |
| 2022–2023 | 11 | -2.851 |
| 2024–2025 | 8 | -0.527 |
This table presents the 11-day Mean CAR partitioned by announcement period.
The findings are stark. The market's reaction is entirely dependent on the timing of the announcement.
1. 2020–2021 Enthusiasm: Early adopters were rewarded with a positive mean CAR of +3.03. As seen in Figure 1B, this period was characterized by massive return variance from approx. -5 to +14. We interpret this as a period of low consensus, where investors were "price-discovering" these novel announcements and, on average, applied an "optimism" premium.
2. 2022–2023 Skepticism: The market reaction fully reversed. Announcements in this period were penalized with a negative mean CAR of -2.85. Figure 1B shows that the variance i.e., the boxplot for this period, while still wide, is centered firmly in negative territory. This suggests the market learned from the first wave, updated its beliefs, and converged on a new consensus: Net-Zero pledges are costly, and investors by 2022 became more skeptical of their credibility or more aware of their implementation costs.
This result is the core contribution of our paper. It strongly supports H2 and provides clear evidence of market learning in the context of ESG announcements. The aggregate "null result" is simply the average of these two offsetting, time-varying reactions.
Cross-Sectional Heterogeneity (H3)
Next test H3 by examining cross-sectional drivers of returns. Table 3 and Figures 2 and 4 present these findings.
| Table 3 Cross-Sectional Heterogeneity (11-Day Mean Car) | ||
| Sector Group | N | Mean CAR (%) |
| Energy | 6 | -3.378 |
| Financial | 3 | -1.494 |
| Transportation | 4 | -1.326 |
| Healthcare | 3 | +0.030 |
| Technology | 6 | +0.640 |
| Heavy Industry | 4 | +1.700 |
| Other | 4 | +4.260 |
| Carbon Intensity | N | Mean CAR (%) |
| High Carbon | 13 | -0.869 |
| Low Carbon | 17 | +0.530 |
This table presents the 11-day Mean CAR$ partitioned by Sector (Panel A) and Carbon Intensity (Panel B).
The results in Table 3 Panel A and Figure 2 strongly support H3. The market response is highly sector-dependent. The "Energy" sector, which faces the most profound, existential transition risk, is penalized most severely, with a Mean CAR of -3.38. This is intuitive and validates that investor are pricing transition risk.
Panel B, however, provides a more nuanced finding. While the direction supports H3 High Carbon firms -0.87 vs. Low Carbon firms +0.53, the difference is statistically insignificant p = 0.498. This finding, or lack thereof, contributes to a complex and mixed literature on the pricing of carbon intensity Ardia et al., 2023. Some studies find that higher carbon emissions led to negative abnormal returns or lower firm value (Matsumura et al., 2014), particularly for firms in non-ETS sectors (Mo et al., 2012). After extracting 2022, while others find no significant effect of carbon intensity on returns (Garvey et al., 2018; In et al., 2019). Our results suggest that investors may be blind to carbon risk Blind to 2020 in the aggregate, or that significant firm-level heterogeneity within carbon-intensive industries e.g., "green" vs. "brown" firms (Bauer et al., 2023). Brown Risk 2023 is more important than the industry-level label itself. Figure 3B explains why. This firm-level plot shows high within-group variance. For example, in the "High Carbon" red group, Adani Green Power a renewable energy firm has a positive CAR, while traditional fossil-fuel firms Reliance, NTPC are negative. Similarly, "Low Carbon" blue tech firms like LTIMindtree are positive, while HCL Technologies and Infosys are negative.
This is a key finding a simple "High/Low Carbon" heuristic is insufficient. The market appears to be using a more sophisticated, sector-level Figure 2 and firm-level Figure 3B analysis, rather than a coarse carbon label, to price these announcements.
Long-Term Performance (H4)
Finally, the research tests H4, the hypothesis of negative long-term performance, by examining BHAR.
The results in Table 4, Figure 5 & Figure 6 provide suggestive but not conclusive support for H4. As hypothesized, the BHAR turns increasingly negative over time, culminating in an economically large negative return of -5.98 over 12 months.
| Table 4 Long-Term Buy-and-Hold Abnormal Returns (BHAR) | |||
| Horizon | N Firms | Mean BHAR (%) | p-value |
| 3 Month | 29 | +0.165 | 0.958 |
| 6 Month | 27 | -2.180 | 0.689 |
| 12 Month | 27 | -5.981 | 0.569 |
However, as shown in 1, this result is not statistically significant p = 0.569. We attribute this to the low statistical power of our small sample n = 27 in a long-term, high-variance BHAR analysis. As discussed in our methodology, BHAR tests face significant econometric hurdles Fama, 1998; Kothari & Warner, 2005, and the high variance in our sample precludes a definitive statistical conclusion. While we cannot statistically reject the null, the economic magnitude is substantial and directionally consistent with our "market skepticism" H2 and "transition risk" H3 hypotheses. Figure 6 visualizes this "short-term neutrality, long-term negativity" puzzle, suggesting that the market's initial aggregate neutrality was misplaced.
Discussion and Conclusion
The analysis set out to determine the valuation effect of Net-Zero commitments in India. Our primary finding is not a simple "positive" or "negative" answer, but a more nuanced one: it depends on when you ask.
The research supplements the core finding with three additional analyses. First, it explores cross-sectional heterogeneity. The research finds that the market reaction is not uniform and is strongly moderated by sector. The Energy sector, facing the highest transition risk, experiences the most significant negative reaction, with a Mean CAR of -3.38. Second, investigate a simple "carbon intensity" heuristic. It finds that while high-carbon firms perform worse -0.87 than low-carbon firms +0.53, this difference is not statistically significant p = 0.498. Our firm-level analysis Figure 3B reveals this is due to high within-group variation, suggesting investors employ a more sophisticated lens than a simple carbon label. Third, it examines long-term performance using Buy-and-Hold Abnormal Returns BHAR. The current analysis finds that, on average, firms announcing Net-Zero pledges experience a pronounced negative drift over the subsequent year, culminating in a 12-month BHAR of -5.98. While our small sample n = 27 lacks the statistical power to deem this result significant p = 0.568, the economic magnitude is substantial. This finding is presented with the strong methodological critiques of BHAR in mind (Fama, 1998; Barber & Lyon, 1997). It suggests that the market's learned, short-term skepticism the -2.85 CAR was ultimately justified, as these pledges are, on average, associated with long-term value destruction or unfulfilled expectations Figure 6.
The aggregate neutrality of these announcements CAAR = -0.08, p = 0.940 is a statistical artifact of two opposing regimes. In 2020–2021, the market reacted with enthusiasm +3.03 CAR, treating these novel pledges as positive signals. By 2022–2023, this enthusiasm had curdled into skepticism -2.85 CAR, as investors learned to price in the immense implementation costs, execution risks, and potential for greenwashing (Reboredo & Otero, 2021). This reflects a growing investor skepticism globally, where ESG claims are met with increased scrutiny (Müller, 2024). This is, to our knowledge, the first paper to document such a stark, time-varying "learning" effect for ESG announcements in an emerging market.
It also finds that the market is sophisticated in its cross-sectional analysis. It heavily penalizes the Energy sector -3.38 CAR, Figure 2, which faces obvious transition risks. Yet, it does not rely on a simple "High/Low Carbon" heuristic p = 0.498, Figure 3A, recognizing that firm-level realities Figure 3B are more complex. The long-term BHAR analysis, while statistically underpowered p = 0.569, shows an economically significant negative drift -5.98, Figure 5, suggesting that the market's learned skepticism was well-founded.
This study is subject to limitations. Our sample size of 30 firms is well-suited for an exploratory study in an emerging market, but a larger sample would provide more statistical power, especially for the BHAR Table 4 and carbon intensity Table 3 analyses. Furthermore, our analysis does not control for the quality of the pledge, a key omitted variable. This limitation points to our primary recommendation for future research: distinguishing between announcements validated by third parties (like the Science-Based Targets initiative, SBTi) (Minnhagen & Stenberg, 2023) and non-validated "cheap talk" (Bingler et al., 2022). Research on SBTi-validated pledges is a nascent but critical field, as these commitments require firms to establish governance structures to oversee emission reduction targets. We hypothesize that the negative reactions we document are driven entirely by the non-validated pledges, and that credible, SBTi-validated commitments may still receive a positive reception. In conclusion, our study provides a novel, dynamic view of how markets price climate commitments. Investors are not static; they learn. For corporate managers and policymakers in India, the message is clear: the era of "easy wins" from "green-signaling" is over. The market has learned to be skeptical, and it is (justifiably) demanding substance over style.
References
Alessi, L., Ossola, E., & Panzica, R. (2021). What greenium matters in the stock market? The role of greenhouse gas emissions and environmental disclosures. Journal of Financial Stability, 54, 100869.
Indexed at, Google Scholar, Cross Ref
Aouadi, A., & Ma, L. (2023). (Dis) Entangling ESG Ratings: A Machine Learning Approach. Available at SSRN 4323662.
Ardia, D., Bluteau, K., Boudt, K., & Inghelbrecht, K. (2023). Climate change concerns and the performance of green vs. brown stocks. Management Science, 69(12), 7607-7632.
Indexed at, Google Scholar, Cross Ref
Armitage, S. (1995). Event study methods and evidence on their performance. Journal of economic surveys, 9(1), 25-52.
Indexed at, Google Scholar, Cross Ref
Ball, R., & Brown, P. (2013). An empirical evaluation of accounting income numbers. In Financial Accounting and Equity Markets (pp. 27-46). Routledge.
Barber, B. M., & Lyon, J. D. (1997). Detecting long-run abnormal stock returns: The empirical power and specification of test statistics. Journal of financial economics, 43(3), 341-372.
Indexed at, Google Scholar, Cross Ref
Bauer, M. D., Offner, E. A., & Rudebusch, G. D. (2023). The effect of US climate policy on financial markets: An event study of the Inflation Reduction Act (No. 10739). CESifo Working Paper.
Berman, N., Rebeyrol, V., & Vicard, V. (2019). Demand learning and firm dynamics: evidence from exporters. Review of Economics and Statistics, 101(1), 91-106.
Indexed at, Google Scholar, Cross Ref
Bingler, J. A., Kraus, M., Leippold, M., & Webersinke, N. (2022). Cheap talk in corporate climate commitments: The effectiveness of climate initiatives (No. 22-54). Swiss Finance Institute.
Indexed at, Google Scholar, Cross Ref
Brown, S. J., & Warner, J. B. (1985). Using daily stock returns: The case of event studies. Journal of financial economics, 14(1), 3-31.
Indexed at, Google Scholar, Cross Ref
Chava, S. (2014). Environmental externalities and cost of capital. Management science, 60(9), 2223-2247.
Indexed at, Google Scholar, Cross Ref
Fama, E. F. (1998). Market efficiency, long-term returns, and behavioral finance. Journal of financial economics, 49(3), 283-306.
Indexed at, Google Scholar, Cross Ref
Fama, E. F., Fisher, L., Jensen, M. C., & Roll, R. (1969). The adjustment of stock prices to new information. International economic review, 10(1), 1-21.
Indexed at, Google Scholar, Cross Ref
Fisher-Vanden, K., & Thorburn, K. S. (2011). Voluntary corporate environmental initiatives and shareholder wealth. Journal of Environmental Economics and management, 62(3), 430-445.
Indexed at, Google Scholar, Cross Ref
Godfrey, P. C., Merrill, C. B., & Hansen, J. M. (2009). The relationship between corporate social responsibility and shareholder value: An empirical test of the risk management hypothesis. Strategic management journal, 30(4), 425-445.
Indexed at, Google Scholar, Cross Ref
In, S. (2019). Is' being green'rewarded in the market?: An empirical investigation of decarbonization and stock returns. ERN: Other Microeconomics: General Equilibrium & Disequilibrium Models of Financial Markets (Topic).
Kothari, S. P., & Warner, J. B. (2007). Econometrics of event studies. In Handbook of empirical corporate finance (pp. 3-36). Elsevier.
Indexed at, Google Scholar, Cross Ref
Krüger, P. (2015). Corporate goodness and shareholder wealth. Journal of financial economics, 115(2), 304-329.
Indexed at, Google Scholar, Cross Ref
Lins, K. V., Servaes, H., & Tamayo, A. (2017). Social capital, trust, and firm performance: The value of corporate social responsibility during the financial crisis. the Journal of Finance, 72(4), 1785-1824.
Indexed at, Google Scholar, Cross Ref
MacKinlay, A. C. (1997). Event studies in economics and finance. Journal of economic literature, 35(1), 13-39.
Matsumura, E. M., Prakash, R., & Vera-Muñoz, S. C. (2014). Firm-value effects of carbon emissions and carbon disclosures. The accounting review, 89(2), 695-724.
Indexed at, Google Scholar, Cross Ref
Mo, J. L., Zhu, L., & Fan, Y. (2012). The impact of the EU ETS on the corporate value of European electricity corporations. Energy, 45(1), 3-11.
Indexed at, Google Scholar, Cross Ref
Nakajima, J. (2011). Time-varying parameter VAR model with stochastic volatility: An overview of methodology and empirical applications.
Nicolas, M. L., Desroziers, A., Caccioli, F., & Aste, T. (2024). ESG reputation risk matters: An event study based on social media data. Finance Research Letters, 59, 104712.
Indexed at, Google Scholar, Cross Ref
Patell, J. M. (1976). Corporate forecasts of earnings per share and stock price behavior: Empirical test. Journal of accounting research, 246-276.
Indexed at, Google Scholar, Cross Ref
Reboredo, J. C., & Otero, L. A. (2021). Are investors aware of climate-related transition risks? Evidence from mutual fund flows. Ecological Economics, 189, 107148.
Indexed at, Google Scholar, Cross Ref
Samitas, A., Papathanasiou, S., & Koutsokostas, D. (2021). The connectedness between Sukuk and conventional bond markets and the implications for investors. International Journal of Islamic and Middle Eastern Finance and Management, 14(5), 928-949.
Indexed at, Google Scholar, Cross Ref
Servaes, H., & Tamayo, A. (2015). Social Capital, Trust, and Firm Performance during the Financial Crisis (No. 10399). CEPR Discussion Papers.
Sorescu, A., Warren, N. L., & Ertekin, L. (2017). Event study methodology in the marketing literature: an overview. Journal of the Academy of Marketing Science, 45(2), 186-207.
Indexed at, Google Scholar, Cross Ref
Appendix
| Table A1 Sample of 30 Firms | ||||||
| Company Name | Ticker | Sector | Sector Group | Carbon Intensity | Event Date | Period |
| Infosys Limited | INFY.NS | IT Services | Technology | Low | 2020-10-28 | 2020-2021 |
| Tata Consultancy Services | TCS.NS | IT Services | Technology | Low | 2021-05-18 | 2020-2021 |
| Wipro Limited | WIPRO.NS | IT Services | Technology | Low | 2021-04-22 | 2020-2021 |
| UltraTech Cement | ULTRACEMCO.NS | Cement | Heavy Industry | High | 2021-11-09 | 2020-2021 |
| Larsen & Toubro | LT.NS | Construction | Heavy Industry | Low | 2021-10-20 | 2020-2021 |
| HDFC Bank | HDFCBANK.NS | Banking | Financial | Low | 2021-06-03 | 2020-2021 |
| Reliance Industries | RELIANCE.NS | Energy | Energy | High | 2023-08-28 | 2022-2023 |
| Adani Green Power | ADANIGREEN.NS | Renewable Energy | Energy | High | 2024-09-24 | 2024-2025 |
| IndianOil Corporation | IOC.NS | Oil & Gas | Energy | High | 2022-08-25 | 2022-2023 |
| NTPC Limited | NTPC.NS | Power | Energy | High | 2022-07-21 | 2022-2023 |
| Tech Mahindra | TECHM.NS | IT Services | Technology | Low | 2022-03-15 | 2022-2023 |
| JSW Steel | JSWSTEEL.NS | Steel | Heavy Industry | High | 2024-07-08 | 2024-2025 |
| Vedanta Limited | VEDL.NS | Mining | Energy | High | 2020-12-22 | 2020-2021 |
| Cipla | CIPLA.NS | Pharma | Healthcare | Low | 2021-01-27 | 2020-2021 |
| Maruti Suzuki | MARUTI.NS | Auto | Transportation | High | 2024-07-07 | 2024-2025 |
| HCL Technologies | HCLTECH.NS | IT Services | Technology | Low | 2022-05-19 | 2022-2023 |
| Axis Bank | AXISBANK.NS | Banking | Financial | Low | 2021-09-22 | 2020-2021 |
| ICICI Bank | ICICIBANK.NS | Banking | Financial | Low | 2024-08-21 | 2024-2025 |
| ITC Limited | ITC.NS | FMCG | Other | Low | 2025-07-26 | 2024-2025 |
| BPCL | BPCL.NS | Oil & Gas | Energy | High | 2022-08-29 | 2022-2023 |
| LTIMindtree | LTIM.NS | IT Services | Technology | Low | 2021-10-21 | 2020-2021 |
| Tata Motors | TATAMOTORS.NS | Auto | Transportation | High | 2022-12-15 | 2022-2023 |
| Sun Pharmaceutical | SUNPHARMA.NS | Pharma | Healthcare | Low | 2025-10-14 | 2024-2025 |
| Hindalco Industries | HINDALCO.NS | Metals | Heavy Industry | High | 2022-08-11 | 2022-2023 |
| Example Format | ||||||
This table lists the 30 firms included in the analysis, their sector, carbon intensity classification, and announcement period.
| Titan Company | TITAN.NS | Consumer | Other | Low | 2025-07-22 | 2024-2025 |
| Apollo Hospitals | APOLLOHOSP.NS | Healthcare | Healthcare | Low | 2024-06-24 | 2024-2025 |
| InterGlobe Aviation | INDIGO.NS | Aviation | Transportation | High | 2022-10-10 | 2022-2023 |
| Coal India | COALINDIA.NS | Coal | Energy | High | 2022-03-09 | 2022-2023 |
| Greaves Cotton | GREAVESCOT.NS | Engineering | Other | Low | 2021-06-05 | 2020-2021 |
| Mahindra & Mahindra | M&M.NS | Auto | Transportation | High | 2023-04-15 | 2022-2023 | (Source: Compiled from 1)
Works cited
1. Demand Learning and Firm Dynamics: Evidence from Exporters - ResearchGate, accessed November 4, 2025, https://www.researchgate.net/publication/323820655_Demand_Learning_and_Firm_Dynamics_Evidence_from_Exporters
2. Full article: Do shareholders support corporate social responsibility, or should companies 'stick to their knitting'?, accessed November 4, 2025, https://www.tandfonline.com/doi/full/10.1080/14735970.2025.2496028
3. Understanding how investors respond to different social responsibility communications: an empirical analysis of Japan | Journal of Asian Business and Economic Studies - Emerald, accessed November 4, 2025, https://www.emerald.com/jabes/article/31/2/137/1221848/Understanding-how-investors-respond-to-different
4. Corporate Social Responsibility and Shareholder Value: The Environmental Consciousness of Investors - ResearchGate, accessed November 4, 2025, https://www.researchgate.net/publication/228248838_Corporate_Social_Responsibility_and_Shareholder_Value_The_Environmental_Consciousness_of_Investors
5. Corporate Social Responsibility and Shareholder Reaction: The Environmental Awareness of Investors | Semantic Scholar, accessed November 4, 2025, https://www.semanticscholar.org/paper/Corporate-Social-Responsibility-and-Shareholder-The-Flammer/bf293394aae4d36c0361d0a0b58aa577189bc8e0
6. Corporate Social Responsibility and Shareholder Reaction: The Environmental Awareness of Investors - ResearchGate, accessed November 4, 2025, https://www.researchgate.net/publication/274424871_Corporate_Social_Responsibility_and_Shareholder_Reaction_The_Environmental_Awareness_of_Investors
7. Event Studies in Economics and Finance, accessed November 4, 2025, https://www.bu.edu/econ/files/2011/01/MacKinlay-1996-Event-Studies-in-Economics-and-Finance.pdf
8. Event Studies in Economics and Finance - IDEAS/RePEc, accessed November 4, 2025, https://ideas.repec.org/a/aea/jeclit/v35y1997i1p13-39.html
9. Finance journal rankings: a paper affiliation methodology - Emerald Publishing, accessed November 4, 2025, https://www.emerald.com/mf/article/48/5/760/290165/Finance-journal-rankings-a-paper-affiliation
10. Credible Engagements or Empty Promises? - Stockholm School of Economics, accessed November 4, 2025, http://arc.hhs.se/download.aspx?MediumId=5878
11. the Event Study Webpage - MIT, accessed November 4, 2025, https://web.mit.edu/doncram/www/eventstudy.html
12. John Y. Campbell, Andrew W. Lo and A. Craig MacKinlay, 1997, The Econometrics of Financial Markets. - Nuclear Regulatory Commission, accessed November 4, 2025, https://www.nrc.gov/docs/ml1208/ML12088A329.pdf
Received: 10-Dec-2025, Manuscript No. AMSJ-25-16852; Editor assigned: 11-Dec-2025, PreQC No. AMSJ-25-16852(PQ); Reviewed: 20-Dec-2025, QC No. AMSJ-25-16852; Revised: 29-Dec-2025, Manuscript No. AMSJ-25-16852(R); Published: 10-Jan-2026