Research Article: 2026 Vol: 30 Issue: 4
FUEL TYPE PREFERENCE IN CAR PURCHASES (WITH SPECIAL REFERENCE TO ELECTRIC CARS): A GENDER BASED CRITICAL STUDY
Archi Mathur, Department of Management Studies, National Law University, Jodhpur, India
Citation Information: Mathur, A., (2026). Fuel type preference in car purchases (with special reference to electric cars): a gender based critical study. Academy of Marketing Studies Journal, 30(S4), 1-16.
Abstract
With the changing climatic conditions across the world having a detrimental effect on the population at large and global warming becoming a major concern for the world, the electric vehicles are one of the sources of hope to counter this effect. Reduction of carbon emissions and a healthy lifestyle are the prime concerns of every citizen of the world. Electric cars seem to give some sort of relief from this onslaught of civilization. With India galloping fast on the road to development, modernization with environmental safe-guards is the most pragmatic way forward. In an attempt to counter the ill effects of modern- day lifestyle/living, electric cars seem to give some sort of relief. But whether the consumers are ready for the shift from fossil-fuel based cars to electric versions is something to ponder about. This study highlights upon two things: • Whether electric cars are more preferred than the hybrid or other fuel- based cars? • Does gender have an impact on purchase of an electric/hybrid/other fuel -based cars?
Keywords
Electric Cars, Hybrid Cars, Petrol Cars, Diesel Cars, CNG Cars, Gender, Environment.
Introduction
The rising prices of fuel, increasing pressure on resources and threatening environmental pollution is driving the need for alternative and clean sources of energy (Prakash et al, 2014). Noise pollution in India is very high now, especially in traffic areas and e-vehicles will help reduce that also (Adhikary, Jalan & Anute, 2022). The requirements for the present situation are fuel saving and no carbon di oxide emissions and adopting green, which result from adopting electric vehicles (Alia et al, 2022). The individual’s awareness and concerns about environmental issues leads to consumer acceptance of BEVs in Malaysia (Khazaei &Tareq, 2021).
No doubt, to enhance the quality of standard of living, greener cars in the form of electric cars is the best option available in the market. But, the presence of other alternative modes of cars in the market, also entice the consumers. Most prominent among them is the presence of hybrid cars in the market. Hybrids are the cross overs with both fossil fuel and battery operations available simultaneously, but reduce the emission considerably. In other words, they are referred to as hybrid vehicles because they combine a combustion engine and an electric motor as a power converter (Goel, Sharma& Rathore, 2021). The consumers of hybrid cars need not worry about the battery getting discharged while driving as this car can easily shift from the battery mode to the engine mode. So, the presence or absence of charging stations at regular intervals of distance will not form a great concern for the consumers. In developing countries like India, the hybrid electric vehicle has been a growing interest in recent days due to the significant improvement in the EVs (Goel, Sharma& Rathore, 2021). Moreover, with India still not electricity proficient even for its urban households and industrial belts, these hybrids offer more viable cost- effective options. So, the hybrid car is a strong competitor for electric cars in the Indian market. Almost 93% of the customers are even willing to pay a premium for a hybrid vehicle; thereby clearly showing that demand of fuel -efficient hybrid vehicle exists in the market (Prakash Nirupama et al, 2014). The Government of India has also launched two major policy initiatives: Faster Adoption and Manufacturing of Hybrid and Electric Vehicles FAME I and Faster Adoption and Manufacturing of Hybrid and Electric Vehicles FAME II to promote adoption of electric vehicles (Ali& Naushad, 2022).
Therefore, a survey was conducted to gauge the preferences of consumers across different fuel or energy type of cars. The study aims to identify the relationship between gender and car preferences based on fuel/energy type. As we are all aware that female consumers form a large chunk of active users in the car industry, therefore, their preference for the different fuel or energy- based cars is also very important along with their male counterparts.
Research Methodology
Literature Review
• The study conducted by (Shrivas Rahul &Vikram, 2025) stated that gender-based moderating effects on EV purchase intention were minimal; i.e. no significant differences between gender decisions in purchasing the electric car. The researcher will try to see whether there has been a shift in gender playing an important role in purchasing an electric car or not?
• The study conducted by Manadhar Raju Bhai (2021) showed that there was no impact of gender on pre-purchasing behaviour of customers of electric vehicles. The researcher will try to find whether gender- based purchase of electric cars is affected by certain factors or not?
• A study conducted by (Jaiswal Deepak, Kant Rishi &Mehta Babeeta, 2024) states that both men and women have developed positive sentiments when they perceive that infrastructure facilities are expanding and that there is increasing demand for battery electric cars in the near future. The researcher will try to study whether the above factor has an impact on the role of gender in purchase of an electric car?
Data Collection
The questionnaire was prepared and survey was conducted through BolDe app (a market research surveying application). The link was shared over wide audience using Whats App and E-mail (Mathur Archi& Panwar Deepak, 2024).
Sample Size
The survey’s sample size consists of 213 respondents. Of these 213 respondents, 101 were female and 112 were male. The sample unit consists of respondents from various categories like housewives, entrepreneurs, salaried individuals, practicing professional, retired people, and students (from the Universities as they are the future prospects). Demographic (age, gender, income and occupation) basis of segmentation is used for this survey (Mathur Archi& Panwar Deepak, 2024).
Tools/Techniques used for Data Analysis
Chi Square (χ2) Test will be used to test the hypothesis. The χ2test is based on χ2distribution which was first used by Karl Pearson in the year 1900 (Gupta &Gupta, 2005). It examines the relationship between the two categorical variables. The two categorical variables included in this study are gender (male and female) and the type of fuel or energy used by the different types of cars (CNG or diesel or petrol or hybrid or electric). Through this, the researcher tries to examine whether statistically significant difference exists or not between the observed values and the expected values between males and females for preference of cars (fuel or energy based).
The application of χ2 test has the null hypothesis as the starting point. According to this hypothesis, variable x does not depend on y and the correlation coefficient between the two variables does not differ significantly from zero (Dura& Drigă, 2017). The opposite of it is the alternate hypothesis. Null hypothesis is denoted as (H0) and the alternate hypothesis is denoted as (H1). Null hypothesis and alternate hypothesis are accordingly framed (Mathur Archi& Panwar Deepak, 2024).
Hypotheses
Set 1:
Null Hypothesis (H0): Electric cars will be more preferred than the hybrid or fuel- based cars.
Alternate Hypothesis (H1): Electric cars will be less preferred than the hybrid or fuel -based cars.
Set 2:
Null Hypothesis (H0): There is no relation between gender and the nature of car on the basis of type of fuel/energy
Alternate Hypothesis (H1): There is a relation between gender and the nature of car on the basis of type of fuel/energy
The significance level will be taken as 0.05 i.e. α = 0.05
This indicates that there is a 5% risk of concluding that there exists an association between the variables taken when there is actually no association (Mathur Archi& Panwar Deepak, 2024).
Once the hypothesis is framed, tabulation of the data will be done.
Data Tabulation and Analysis
Table of Observed Values:
Observed value is the actual number of observations in a sample that belongs to a category (Mathur Archi& Panwar Deepak, 2024). The observed value for each category of combinations is as follows:
From the above table 1, a bar graph is plotted so that the data so collected can be compared for the two categories, i.e., gender (female and male) and the car based on the type of fuel or energy (CNG, diesel, petrol, electric and hybrid).
| Table 1 Observed values | ||||||
| Female | 2 | 4 | 34 | 27 | 34 | 101 |
| Male | 6 | 9 | 35 | 46 | 16 | 112 |
| Grand Total | 8 | 13 | 69 | 73 | 50 | 213 |
The above graph 1clearly indicates that:
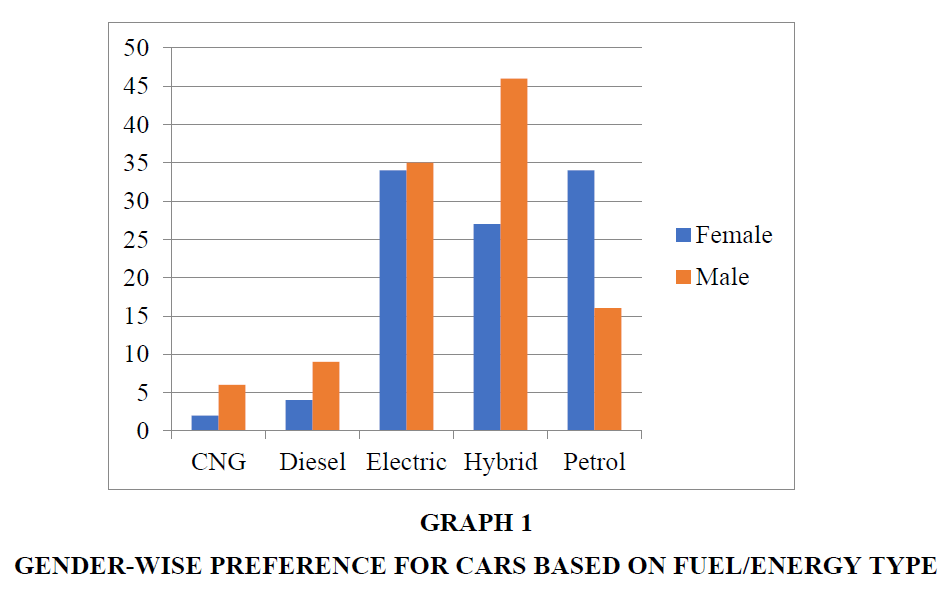
Graph 1 Gender-Wise Preference for Cars Based on Fuel/Energy Type
• The preference for CNG and diesel cars is very less in the case of both male and female consumers. Though it can be observed that in both the categories of cars, the male consumers prefer these cars more than the female consumers. The preference of CNG cars by the female consumers is even lesser as compared to their preference for diesel cars.
• There is not much difference in the preference for electric cars by both male and female consumers. Though males are, in tendency, more accepting of BEV’s (battery electric vehicles) (Wicki et al., 2023)
• A huge difference in preference can be seen in the hybrid car category. Males prefer hybrid cars more than their female counterparts. Firstly, highway driving or long- distance driving is mostly done by men in India. And as stated above, the consumers need not get worried about the discharge of battery mid -way while driving because the hybrid car can easily shift from the battery mode to the engine mode. This serves as a motivating factor to buy a hybrid car by the male consumers and they do not have to worry about the presence or absence of charging stations. Secondly, huge savings on costs by the consumers as there is a lesser reliance on petrol or diesel whose price is sky rocketing each day.
• With the world moving towards better, reliable and cost friendly technology, a contrasting observation is seen in the petrol segment cars. There is a huge difference between the preference for petrol cars by the male and the female consumers. It is observed that the female consumers prefer petrol cars much more than the male consumers. The most important reason behind this can be attributed to convenience. The female consumers find it more convenient to get petrol filled in the car as compared to the charging of the car. Secondly, a sense of insecurity creeps into the minds of the female consumers with respect to the availability of the charging stations. This phenomenon is termed as ‘range anxiety’. Range anxiety refers to the fear or uncertainty about running out of battery charge while driving, with limited access to charging infrastructure ((Raghvendra S et al, 2023). As per a study conducted, there is a significant association between charging infrastructure and electric vehicle adoption, i.e. a good charging infrastructure has a great role in electric vehicle adoption by consumers (Ali et al, 2022). Insufficient charging infrastructure diminishes the adaptability and convenience for users, thereby diminishing the appeal of operating electric vehicles (Pamidimukkala et al., 2023). The sparse distribution of charging infrastructure hampers the convenience and confidence of EV owners, as they may face difficulties finding charging points for their vehicles, especially during long-distance travel (Raghvendra S et al, 2023). Not only this, the time spent by them on these charging stations till the time the car gets charged and they can resume driving is also questionable. The lack of accessible charging stations and long charging times contribute to range anxiety and limit the practicality of EVs for everyday use (Yadav, Tripathi& Kushawah, 2024). Thirdly, the female consumers are more concerned about their safety or the safety of the family members sitting along with them during the ride. Issues related to fire due to overheating of the battery is a very important security concern for them. So, all these factors make them more inclined towards the petrol cars as compared to either a hybrid car or an electric car.
Table of Expected Values:
The expected value is the frequency that would be expected in a cell if the variables are independent (Mathur Archi& Panwar Deepak, 2024).
Expected Value: Row Total * Coloumn Total / Grand Total
The above graph 2 clearly indicates that:
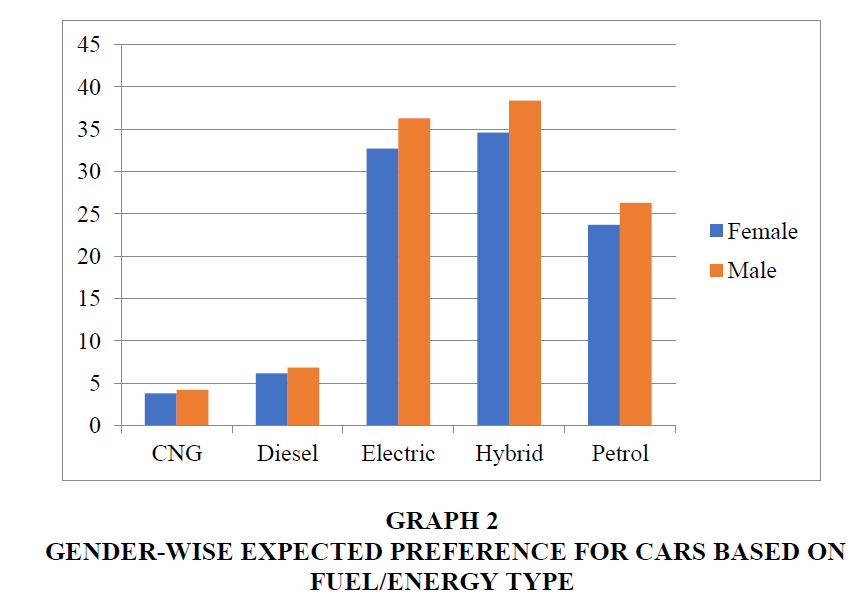
Graph 2 Gender-Wise Expected Preference for Cars Based on Fuel/Energy Type
• There is a marginal increase in the expected value for preference for CNG cars by the female category; however, it seems to be not so significant.
• There is a marginal increase in the expected value for preference for diesel cars by the female category and a marginal decrease in the preference of diesel cars by the male category of consumers; however, in both the cases, it seems to be not so significant.
• In the case of electric cars category, it is observed that the expected value for the preference in the male category has slightly decreased while the preference in the female category has slightly increased.
• In the case of hybrid cars category, it is observed that the expected value for the preference in the male category has slightly decreased while the preference in the female category has increased.
• In the case of petrol cars, the expected value for the preference in the female category has decreased but the preference in the male category has increased.
Calculation of χ2 Value:
A chi square test compares proportions actually observed in a study with the expected to establish if they are significantly different (Sharma Rakesh et al, 2016). The observed values from table 1 and the expected values from table 2 are placed in the chi square table. Observed value is denoted by O and the expected value is denoted by E. (O ˗ E) is the difference between the observed values and the expected values. It denotes the deviation of the observed value from the expected value. If there is less deviation of the observed value from that of the expected value, then it supports the null hypothesis, i.e, no statistically significant relationship exists between the categorical variables. On the other hand, if there is more deviation of the observed value from that of the expected value, then it supports the alternate hypothesis, ie, a statistically significant relationship exists between the categorical variables (Mathur Archi, 2025). As the deviation between the observed value and the expected value is more, it supports the alternate hypothesis (H1) ‘Electric cars will be less preferred than the hybrid or fuel -based cars’ or ‘There is a relation between gender and the nature of car on the basis of type of fuel/energy’. And it does not support the null hypothesis (H0) ‘Electric cars will be more preferred than the hybrid or fuel- based cars’ or ‘There is no relation between gender and the nature of car on the basis of type of fuel/energy’. The alternate hypothesis and the null hypothesis can further e verified by undertaking the chi square test (χ2).
| Table 2 Expected value | |||||
| Gender | Nature of Car on the basis of Type of Fuel/Energy | ||||
| CNG | Diesel | Electric | Hybrid | Petrol | |
| Female | 3.79 | 6.16 | 32.72 | 34.61 | 23.71 |
| Male | 4.21 | 6.83 | 36.29 | 38.38 | 26.29 |
(O-E)2 is the squared difference between the observed value and the expected value. The result of this squared difference will always be positive and will not be negative (Mathur Archi, 2025). The reason behind this is that for calculating the chi square (χ2) value, the magnitude of deviation is more important and not its direction.
The larger value of (O-E)2/E gives a clear indication that there is no match between the observed value and the expected value so calculated; thereby indicating that the null hypothesis (H0) may be rejected and the alternate hypothesis (H1) may be accepted. This can further be verified by comparing the chi square (χ2) calculated value with the chi square (χ2) tabular value by taking into consideration the significance value of 0.05 and the required degrees of freedom (Mathur Archi, 2025; Sovacool et al., 2019).
From table 3, it is clear that Chi Square Calculated Value is 14.8287
| Table 3 Calculation of χ2 Value | ||||
| Observed Value (O) | Expected Value (E) | (O-E) | (O-E)2 | (O-E)2 /E |
| 2 | 3.79 | -1.79 | 3.2041 | 0.8454 |
| 4 | 6.16 | -2.16 | 4.6656 | 0.7574 |
| 34 | 32.72 | 1.28 | 1.6384 | 0.0501 |
| 27 | 34.61 | -7.61 | 57.9121 | 1.6733 |
| 34 | 23.71 | 10.29 | 105.8841 | 4.4658 |
| 6 | 4.21 | 1.79 | 3.2041 | 0.7611 |
| 9 | 6.83 | 2.17 | 4.7089 | 0.6894 |
| 35 | 36.29 | -1.29 | 1.6641 | 0.0458 |
| 46 | 38.38 | 7.62 | 58.0644 | 1.5129 |
| 16 | 26.29 | -10.29 | 105.8841 | 4.0275 |
| Summation | χ2= 14.8287 | |||
| (O-E)2 /E | ||||
Then, the comparison of the Calculated χ2 value is done with the Tabulated value.
χ2 Tabulated Value:
For the χ2 Tabulated Value, the degrees of freedom have to be calculated. The number of degrees of freedom is described as the number of observations that are free to vary after certain restrictions have been imposed on the data (Gupta & Gupta, 2005). The formula for calculating the degrees of freedom is:
Degree of Freedom = (Coloumn -1) (Row-1)
f = (5-1) (2-1)
f = 4
Then χ2 Tabulated Value is calculated by using the chi square table for degrees of freedom 4 and significance value of 0.05.
The χ2 tabulated value will be 9.488
If the Chi Square Calculated Value is more than the Chi Square Tabulated Value or the critical value, then the Null Hypothesis (H0) is rejected and the Alternate Hypothesis (H1) is accepted (Mathur Archi et al, 2024). Accordingly, the Null Hypothesis (H0) ‘Electric cars will be more preferred than the hybrid or fuel -based cars’ is rejected and the Alternate Hypothesis (H1) ‘Electric cars will be less preferred than the hybrid or fuel- based cars’ is accepted.
As the calculated value is more than the critical value, we have sufficient evidence to say that there is an association between the type of gender and the nature of car preferred on the basis of type of fuel/energy. Hence the Null Hypothesis (H0) ‘There is no relation between gender and the nature of car on the basis of type of fuel/energy’ is rejected and the Alternate Hypothesis (H1) ‘There is a relation between gender and the nature of car on the basis of type of fuel/energy’ is accepted.
This further shows that the as the critical value is greater than the expected value, it cannot be attributed to chance and our sample supports the hypothesis of a difference.
Further confirmation can be done by calculating the p value.
Calculation of p value
The two tailed p value with a Chi Square Calculated Value of 14.8287 and degrees of freedom 4 equals 0.0051.
If the p value is smaller than or equal to 0.05, then the variables have a statistically significant association and the Null Hypothesis (H0) can be rejected.
Acceptance Criteria): If for a specified significance level, the value of χ2 is less than the tabulated value of χ2, the hypothesis considered holds good and it can be concluded that the attributes are independent (Sharma Rakesh et al, 2016; Manandhar,2021).
Rejection Criteria: If for a specified significance level, the value of χ2 is greater than the tabulated value of χ2, the hypothesis is rejected and it can be concluded that the attributes are related (Sharma Rakesh et al, 2016; Sovacool et al., 2018).
p≤α
or p≤0.05
0.0051≤0.05
If the p value is less than or equal to the significance level, the Null Hypothesis (H0) is rejected and concluded that there is a statistically significant association between the variables (Mathur Archi et al, 2024). And by conventional criteria, the difference is considered to be very statistically significant. Therefore, the Null Hypothesis (H0) ‘Electric cars will be more preferred than the hybrid or fuel- based cars’ can be rejected and the Alternate Hypothesis (H1) ‘Electric cars will be less preferred than the hybrid or fuel- based cars’ can be accepted. Similarly, the Null Hypothesis (H0) ‘There is no relation between gender and the nature of car on the basis of type of fuel/energy’ is rejected and the Alternate Hypothesis (H1) ‘There is a relation between gender and the nature of car on the basis of type of fuel/energy’ is accepted.
Further Calculations and Analysis:
From the above table 4, following inference/observations can be made:
| Table 4 Further Calculations and Analysis | ||||||||
| Gender | Values | Nature of Car on the basis of Type of Fuel/Energy | Total | % | ||||
| CNG | Diesel | Electric | Hybrid | Petrol | ||||
| Female | Observed Value | 2 | 4 | 34 | 27 | 34 | 101 | 47.42 |
| Expected Value | 3.79 | 6.16 | 32.72 | 34.61 | 23.71 | |||
| Male | Observed Value | 6 | 9 | 35 | 46 | 16 | 112 | 52.58 |
| Expected Value | 4.21 | 6.83 | 36.29 | 38.38 | 26.29 | |||
| Total | 8 | 13 | 69 | 73 | 50 | 213 | ||
| % | 3.76 | 6.10 | 32.4 | 34.27 | 23.47 | 100 | ||
• The observed value for the CNG car in the category of female and male population is 2 and 6 respectively; therefore, amounting to 1.98% females and 5.36% males preferring to purchase CNG car. There is also not much difference in the expected value of the CNG car which stands at 3.79 and 4.21 respectively for female and male population.
• For the Indian population which used to drive diesel and petrol cars mostly, very striking revelation has emerged in the diesel cars category. Just like the fate of CNG, the observed value for diesel cars in the category of female and male population is 4 and 9 respectively; thereby amounting to 3.96% females and 8.03% males preferring diesel cars out of the total population. There is also not much difference in the expected value of the diesel car which stands at 6.16 and 6.83 respectively for female and male population (Sanguesa et al., 2021).
Now on comparing the electric, hybrid and petrol cars, it was found out that:
• The observed value for the electric car in the category of female and male population is 34 and 35 respectively; therefore, amounting to 33.66% females and 31.25% males preferring to purchase an electric car. The expected value of the electric car stands at 32.72 and 36.29 respectively for female and male population. This means that the expected value of male population preferring electric cars was higher than the female population; though by only a small margin.
• The observed value for the hybrid car in the category of female and male population is 27 and 46 respectively; therefore, amounting to 26.73% females and 41.07% males preferring to purchase a hybrid car. Therefore, from the data collected, it can be seen that the hybrid cars are more preferred by the male population as compared to the female population. Furthermore, the expected value of the hybrid car stands at 34.61 and 38.38 respectively for female and male population. This means that the expected value of the female population preferring hybrid cars is also more when compared with its observed value (Mortimore, Ratnasiri& Iftekhar,2024).
• The observed value for the petrol car in the category of female and male population is 34 and 16 respectively; therefore, amounting to 33.66% females and 14.28% males preferring to purchase a petrol car. This indicates that females prefer petrol cars more than their male counterparts. The expected value of the petrol car stands at 23.71 and 26.29 respectively for female and male population. This means that the expected value of male population preferring petrol cars is much higher when compared to its observed value. On the other hand, the expected value of female population preferring petrol cars is much lower than its observed value.
• While comparing observed and expected cell counts, it was found out that in the category of female respondents, the observed value for hybrid cars was 27 while the expected value was 34.61. Similarly, the observed value for petrol cars was 34 while the expected value was 23.71. This means that these are the cells which have more or less observations than would be expected if H0were true. It can also be seen for the male population also. The observed value for hybrid cars is 46 as compared to the expected value of 38.38. Similarly, for petrol cars, the observed value is 16 as compared to its expected value of 26.29.
• If the two variables are associated, then the distribution of observations for one variable will defer depending on the category of the second variable.
• If two variables are independent, then the distribution of observations for one variable will be similar for all categories of the second variable.
Keeping this into consideration, we can say that in case of the female respondents and hybrid cars, the observed value was 27 and the expected value is 34.61. The expected value is much more than the observed value than if the variables were independent. This shows that the two variables (females and hybrid car) are associated. Similarly, in the case of female population and petrol cars, the observed value is 34 and the expected value is 23.71. Here the observed count seems to be much larger than would be expected if the variables were independent (Kumar & Sharma, 2016).
Furthermore, we can say that in case of the male respondents and hybrid cars, the observed value is 46 and the expected value is 38.38. Here the observed count seems to be much larger than would be expected if the variables were independent. This shows that the two variables (males and hybrid car) are associated.
And in the case of male population and petrol cars, the observed value is 16 and the expected value is 26.29. Here the expected value is much more than the observed value than if the variables were independent. This shows that the two variables (males and petrol car) are associated (Liao, Molin & Van Wee, 2017; Ragavendran & Kumar,2023).
• The cells which contribute the most to the value of χ2 are the female respondents & petrol car category (4.4658) and male respondents and petrol car category (4.0275). The smallest contributions come from female respondents & electric car category (0.0501) and male respondents & electric car category (0.0458).
The reasons for female category and male category of respondents not preferring electric cars can be depicted in the following table 5:
| Table 5 Reasons For Not Preferring Electric Cars | |||||
| Gender | Reasons For Not Preferring Electric Cars | Total | |||
| Not Good For Highway Driving | Indian Roads Unsuitable For Electric Cars | Lesser Power And Speed | Dearth Of Options/Choices In This Segment | ||
| Females | 29 | 20 | 25 | 27 | 101 |
| Males | 21 | 31 | 27 | 33 | 112 |
Both the female respondents and the male respondents have given top priority to the above identified reasons only and have not considered the other reasons like availability of lesser charging stations within a particular specified distance, safety criterion, long charging hours to recharge the battery of electric cars, irregular power supply, lack of availability of spare parts and doubts about the after sales service of the electric cars. The researcher, however, feels that all these factors will come into force only when the reasons so identified by the respondents have been taken care of.
A pie chart is plotted to explain the different reasons for female category of respondents not preferring electric cars more in comparison to the petrol cars Graph 3.
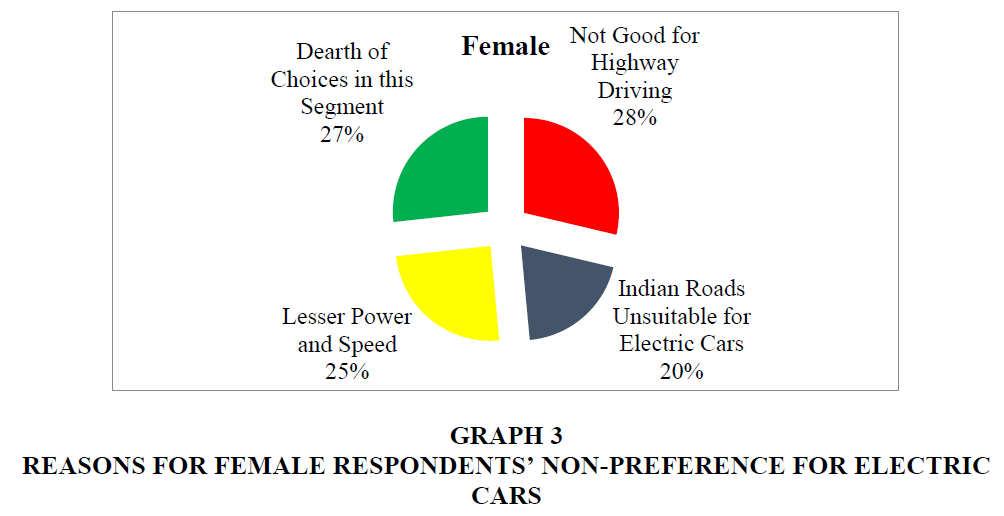
Graph 3 Reasons for Female Respondents’ Non-Preference for Electric Cars
• 28% of the female respondents feel that electric cars are not good for highway driving. Higher travel demand – mostly measured by the annual kilometers/miles travelled by car - also appears to harm battery electric vehicle’s acceptance (Wicki et al., 2023). Females have more inhibition to drive electric cars for long distances. Firstly, they feel that the battery might not be enough to complete their journey. A relatively short driving range is considered to be one of the biggest barriers to the widespread adoption of EV (Liam Fanchao, 2017). Secondly, the charging stations are not equally distributed throughout the highways. Therefore, in case of the electric car running out of power, they will be left stranded on the road. The density of charging stations also positively affects the utility of EV, which demonstrates the importance of charging infrastructure development in promoting EV (Liam Fanchao, 2017). Thirdly, the female respondents find electric cars less reliable for highway driving in term of safety.
• 27% of these female respondents feel that there is a dearth of options or choices in the electric car segment of the automobile sector. This dearth of options can be related to safety features in a low- priced electric car, aesthetics, colour, etc.
• 25% of the female respondents feel that electric cars have lesser power and speed. Firstly, more power and speed is associated with the sturdiness of the vehicle. The female respondents feel that the sturdier the car, more will it be safe to drive. Secondly, the safer to drive a vehicle, easier will it be to drive across rigorous terrains. Thirdly, the safety of the family is not compromised in the case of sturdier and powerful cars. The female respondents feel that an electric car will not be able to meet these criteria as it has lesser power and speed in comparison to other fuel type preference of cars.
• 20% of the female respondents feel that Indian roads are unsuitable for electric cars. Firstly, excessive high temperatures in summer lead to higher temperatures on road. As most of the Indian roads are being made of coal tar, there is a high heating effect on the roads, which might have an overheating impact on the battery of the car. This may affect the safety of the consumers sitting in that car. Even the presence of a cooling system in the electric car will consume more battery. Secondly, the female respondents feel that electric cars are very delicate in nature and the presence of potholes on the roads would require a higher level of maintenance of these cars.
A pie chart is plotted to explain the different reasons for male category of respondents not preferring electric cars more in comparison to the hybrid cars Graph 4.
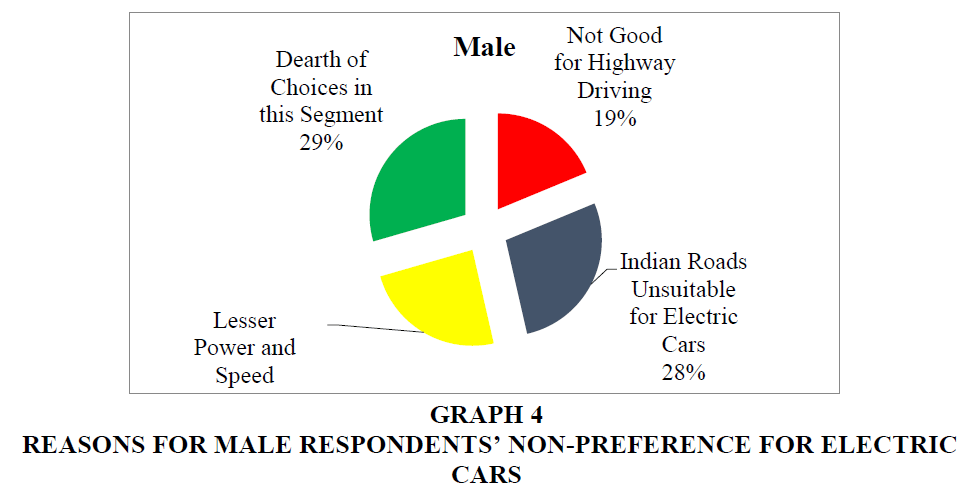
Graph 4 Reasons for Male Respondents’ Non-Preference for Electric Cars
• 29% of male respondents feel that there is a dearth of options or choices in the electric car category. This may include non - availability of different models of electric cars in the market like hatchback, sedan, sports utility vehicles, crossovers, mini cars, etc.
• 28% of the male respondents feel that Indian roads are not suitable for electric cars. There are lots of cracks on the road, pot holes are omnipresent, and during rainy season, it becomes difficult to drive on such roads filled with water. As the condition of the Indian roads is not good, driving an electric car which is battery operated and considered to be quite delicate as compared to its other fuel or hybrid type counterparts is a risky proposition.
• 24% of the male respondents feel that an electric car has lesser power and speed as compared to hybrid or petrol cars. Hence, it is not a suitable option for highway driving where there is a certain amount of speed which one has to maintain while driving. The experience of driving a powerful vehicle is also not felt by them.
• 19% of the male respondents feel that electric cars are not good for highway driving. A poor highway infrastructure restricts the male consumers to buy electric cars. Lack of regular availability of charging stations on the highways is another factor which inhibits the purchase of electric cars for highway driving. Availability of fewer service stations across the highways also is a hindrance for people driving electric cars on the highways.
Keeping into consideration the above responses of both male and female category of respondents, a comparative analysis of both female category of respondents and male category of respondents not preferring electric cars is depicted below through the table 6 and is further substantiated through the bar graph 5:
| Table 6 Reasons for not Preferring Electric Cars | |||||||
| Gender | Value | Reasons for not Preferring Electric Cars | Total | % | |||
| Not Good for Highway Driving | Indian Roads Unsuitable for Electric Cars | Lesser Power and Speed | Dearth of Options or Choices in this Segment | ||||
| Female | Observed Value | 29 | 20 | 25 | 27 | 101 | 47.66 |
| Expected Value | 23.83 | 24.78 | 24.78 | 28.6 | |||
| Male | Observed Value | 21 | 31 | 27 | 33 | 112 | 52.34 |
| Expected Value | 26.17 | 27.21 | 27.21 | 31.4 | |||
| Total | 50 | 51 | 52 | 60 | 213 | ||
| % | 23.47 | 23.94 | 24.42 | 28.17 | |||
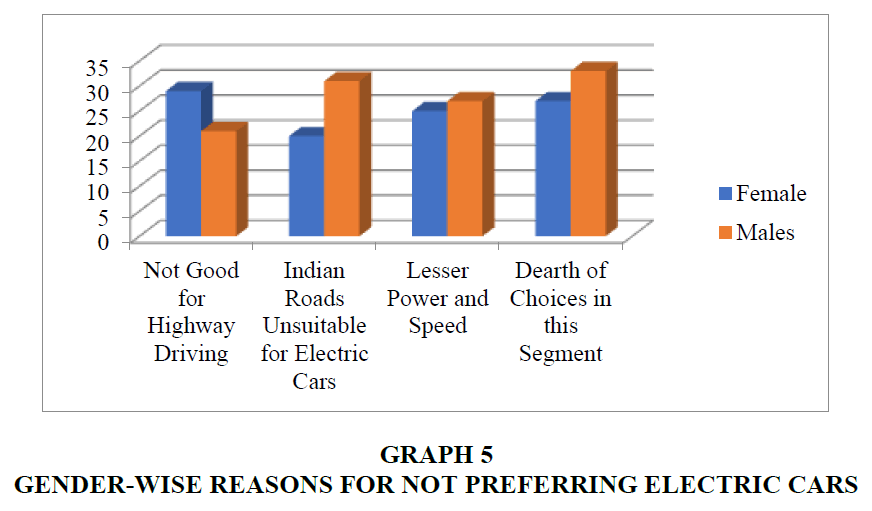
Graph 5 Gender-Wise Reasons for Not Preferring Electric Cars
From the above table and the graph, the following observations can be made:
• The percentage of respondents not preferring electric cars because it is not good for highway driving is more in the case of females (58%) as compared to males (42%). Females have more inhibition to drive electric cars for long distances. Firstly, they feel that the battery might not be enough to complete their journey. Secondly, the charging stations are not equally distributed throughout the highways. Therefore, in case of the electric car running out of power, they will be left stranded on the road. Thirdly, the female respondents find electric cars less reliable for highway driving in term of safety. On the other hand, the reason for males categorizing electric cars as not good for highway driving can be attributed to lesser power and speed; because of which it is difficult to maintain the speed required for highway driving.
• The percentage of respondents not preferring electric cars because the Indian roads are not suitable for electric cars is more in the case of males (60.78%) as compared to females (39.22%). In the Indian context, firstly, males drive cars much more than the female population; though the percentage of females driving cars is increasing day by day. Secondly, highway driving is also mostly done by male population. The percentage of females opting for highway driving is marginal in comparison to their male counterparts. The above two reasons are the prime reasons for women to not consider the quality of roads for the purpose of driving. Men are more concerned about the technical aspects of the car as compared to the females. They feel that the poor road conditions like potholes and uneven roads might not be good for navigating electric cars through such roads. Electric cars may be considered to be much more delicate than the fuel- based cars as these are battery operated cars. Hence, the male respondents might feel that they are not suited for any type of rugged terrains.
• There is however, not much of a difference in the male category (51.92%) and female (48.08%) category of respondents regarding lesser power and speed as a criterion for not preferring electric cars. Technological barriers have a significantly negative influence on consumer’s willingness to adopt EVs (Pamidimukkala et al., 2023).
• Similarly, the percentage of respondents not preferring electric cars due to dearth of options or choices in this segment is more in the case of males (55% as compared to the females (45%). This is because most of the automobile manufacturers are in the early stages of their change from traditional fuel sources to battery operated sources. So, they have not come out with more models of electric cars in the market and therefore, the consumers have very less options to choose from. This acts as a big hindrance in the purchase of an electric car. Consumers need more awareness regarding the various models of the electric cars (Patodia & Roy, 2023).
Therefore, we can say that:
• Females prefer petrol cars more than the electric cars because firstly, there are lesser availability of charging stations within the cities as well as on the highways. The infrastructure demands, including those for charging stations on highways, homes, and rental properties, could be met by well-designed policies that govern their quantity, distribution, placement, parking charges and accessibility (Pamidimukkala et al., 2023). In other words, there is a need for a rapid expansion of the charging network, particularly in urban areas and along major highways (Raghvendra S et al, 2023). Secondly, the familiarity with electric cars has not reached a comfortable and a secure point as it is a battery- operated car and not a fuel operated car. Thirdly, as the electric cars are considered to be more delicate in comparison to petrol cars, women are concerned about the safety of their family at the time of purchase which acts as an inhibiting force. The batteries should also meet the testing standards that are subject to conditions like overcharge, temperature, short circuit, fire collision, vibration, humidity and water immersion (Goel Sharma & Rathore, 2021).
• Males prefer hybrid cars more than the electric cars because firstly, they are considered to be both eco- friendly as well as performance oriented. Eco-friendly because they also work on the battery- operated technology along with the fuel operated technology. This results into saving costs on the fuel when the car is on the battery- operated mode. Secondly, as it also works on the fuel- based technology model, therefore, there is no compromise on the power and speed of the car. This can be further substantiated by the study conducted which states that environmental concern is a partial predictor of behavioural intention in consumers’ adoption of electric vehicles but significantly affects the attitude of the consumer (Khurana, Kumar& Sidhpuria, 2019). Thirdly, even if the charging infrastructure is not fully developed, at the need of time, they can easily shift to the fuel- based technology. Therefore, they are better suited for long distance driving as compared to the electric cars. Fourthly, engine and battery- operated technologies are present together in a hybrid car, which makes it a more viable option of purchase for the male consumers.
Conclusion
From this study, it can be concluded that the preference for hybrid cars is much more than cars in any other category. It is hugely preferred by the males but female preferences of petrol cars is substantial enough to not to be ignored by the car manufacturers. The most striking feature of this study is the petrol car category which will be facing the consequences of the presence of electric and hybrid cars in the market. Though the females will be preferring more of electric and petrol cars; but the fact that the knowledge about the functionality of the cars and the decision making regarding the same lies with the males, it can be ascertained that there is going to be high demand for hybrid cars in the Indian market as compared to other car categories. The Government of India recognizes the urgency to look at sustainable mobility solutions to reduce dependency on imported energy sources, reduced green- house gas emissions and mitigate adverse impacts of transportation including global warming (Goel Sonali et al, 2021). The Government is giving subsidies on purchase of an electric car like lower GST rates and income tax deductions on interest paid on electric car loans. Other countries are also heavily banking on the usage of electric car by its consumers for environmental sustainability. Norway has been named the “capital” of electric vehicles (EVs) because the purchase and use of EVs in Norway has increased tremendously (Aasness & Odeck, 2015).
Furthermore, not enough is done by marketers to target female consumers for their hybrid/electric versions. Television, newspaper, internet and magazine were the main source of information about new technologies for majority of respondents (Prakash Nirupama et al, 2014). They can be their biggest segment for features like eco-friendly, economy and ease of drive. Manufacturers of electric vehicles should prioritize not only energy conservation but also environmental concerns as there is an association between environmental concern and electric vehicle adoption (Ali & Deshmukh, 2022). People are willing to purchase an electric vehicle which is powerful, reliable, fuel efficient and safe (Prakash Nirupama et al, 2014). Also, advancements in battery technology, including higher energy density, faster charging capabilities, and improved durability, are necessary to address consumer concerns and increase the appeal of EVs (Raghvendra S et al, 2023). Overcoming range anxiety requires a combination of infrastructure development, public awareness campaigns and technological innovations to enhance battery performance and charging capabilities (Yadav, Tripathi& Kushawah, 2024). Home charging may be an important consideration for consumers who are considering purchasing a plug-in electric car (Chawla et al., 2023).
With the ongoing Israel- US- Iran war, it will give more opportunities to researchers to see whether there has been a significant shift in preferences of both men and women in the purchase of electric cars? And whether Government will take note of this situation and emphasize on the purchase of electric cars apart from it being environment friendly?
References
Aasness, M. A., & Odeck, J. (2015). The increase of electric vehicle usage in Norway—incentives and adverse effects. EuropeanTransportResearchReview, 7(4),34.
Indexed at, Google Scholar, Cross Ref
Adhikary, S., Jalan, N., & Anute, N. (2022). Customers’ perception about electric vehicles. Journal of Management ResearchandAnalysis, 9(3),144-149.
Indexed at, Google Scholar, Cross Ref
Ali, I., & Naushad, M. (2022). A study to investigate what tempts consumers to adopt electric vehicles. World Electric Vehicle Journal, 13(2), 26.
Indexed at, Google Scholar, Cross Ref
Alia, M. M. M., & Deshmukh, A. A. (2022). E-vehicle: Literature review. International Management Review, 18(2), 87-92.
Chawla, U., Mohnot, R., Mishra, V., Singh, H. V., & Singh, A. K. (2023). Factors influencing customer preference and adoption of electric vehicles in India: a journey towards more sustainable transportation. Sustainability, 15(8), 7020.
Indexed at, Google Scholar, Cross Ref
Dura, C., & Drigă, I. (2017). Application of Chi Square Test in Marketing Research. Annals of the University of Petroşani. Economics, 17(2), 79-90
Goel, S., Sharma, R. and Rathore, A.K., 2021. A review on barrier and challenges of electric vehicle in India and vehicle to grid optimisation. Transportation engineering, 4, p.100057.
Gupta S P & Gupta M P (2005), “Business Statistics”, 14th Edition, Sultan Chand & Sons, 2005, Chapter 17, Pg. 542.
Jaiswal, D., Kant, R., & Mehta, B. (2024). Consumer adoption of battery electric cars: analyzing techno-psychological perception-attitude-intention linkage perspective and gender effects. International Journal of Energy Sector Management, 19(4), 820-840.
Indexed at, Google Scholar, Cross Ref
Khazaei, H., & Tareq, M. A. (2021). Moderating effects of personal innovativeness and driving experience on factors influencing adoption of BEVs in Malaysia: An integrated SEM–BSEM approach. Heliyon, 7(9).
Indexed at, Google Scholar, Cross Ref
Khurana, A., Kumar, V. R., & Sidhpuria, M. (2019). A study on the adoption of electric vehicles in India: The mediating role of attitude. Vision, 24(1), 23-34.
Indexed at, Google Scholar, Cross Ref
Liao, F., Molin, E., & Van Wee, B. (2017). Consumer preferences for electric vehicles: a literature review. Transport Reviews, 37(3), 252-275.
Indexed at, Google Scholar, Cross Ref
Manandhar, R. B. (2021). Impact of Gender on Pre-Purchasing Behaviour of Consumers of Electric Vehicle. Nepal journal of multidisciplinary research.
Indexed at, Google Scholar, Cross Ref
Mathur Archi (2025), “Is Electric Car’s Purchase Restricted to Metro Cities Only?”, International Journal of Research and Scientific Innovation, Volume XII, Issue VIII, July.
Mathur Archi & Panwar Deepak (2024), “Comparison of Small, Medium and Large Cars Across Traditional and Alternative Energy sources”, International Journal of Business and Management Invention, Volume 13, Issue 7, July.
Mortimore, A., Ratnasiri, S., & Iftekhar, M. S. (2024). Who is buying electric vehicles in Australia? A study of early adopters. Australasian Journal of Environmental Management, 31(2), 136-160.
Indexed at, Google Scholar, Cross Ref
Pamidimukkala, A., Kermanshachi, S., Rosenberger, J. M., & Hladik, G. (2023). Evaluation of barriers to electric vehicle adoption: A study of technological, environmental, financial, and infrastructure factors. Transportation Research Interdisciplinary Perspectives, 22, 100962.
Indexed at, Google Scholar, Cross Ref
Patodia, T., & Roy, S. (2023). Understanding Consumer Perceptions and Purchase Intentions of Electric Vehicles: An In-Depth Analysis. International Journal of Marketing & Business Communication, 12(2), 37.
Prakash, N., Kapoor, R., Kapoor, A., & Malik, Y. (2014). Gender Preferences for alternative energy transport with focus on electric vehicle.
Indexed at, Google Scholar, Cross Ref
Ragavendran, S., & Kumar, P. (2023). Exploring Barriers and Challenges of Electric Vehicles in India and Vehicle-to-Grid Optimization: A Comprehensive Review. Int. J. Nov. Res. Eng. Sci.(IJNRES), 1, 16-19.
Sanguesa, J. A., Torres-Sanz, V., Garrido, P., Martinez, F. J., & Marquez-Barja, J. M. (2021). A review on electric vehicles: Technologies and challenges. smart cities, 4(1), 372-404.
Indexed at,Google Scholar,Cross Ref
Kumar, R., & Sharma, S. (2016). Chi-square test in business research. International Journal of Commerce and Management Research, 2(5), 24-26.
Shrivas Rahul & Vikram (2025), “Investigating the Gender-Driven Moderating Factors in Electric Vehicle Acceptance Evidence from Chattisgarh”, International Journal for Multidisciplinary Research, Volume 7, Issue 3, May-June.
Indexed at, Google Scholar, Cross Ref
Sovacool, B. K., Kester, J., Noel, L., & de Rubens, G. Z. (2018). The demographics of decarbonizing transport: The influence of gender, education, occupation, age, and household size on electric mobility preferences in the Nordic region. Global Environmental Change, 52, 86-100.
Indexed at, Google Scholar, Cross Ref
Sovacool, B. K., Kester, J., Noel, L., & de Rubens, G. Z. (2019). Are electric vehicles masculinized? Gender, identity, and environmental values in Nordic transport practices and vehicle-to-grid (V2G) preferences. Transportation Research Part D: Transport and Environment, 72, 187-202.
Yadav, N., Tripathi, R., & Kushawah, V. (2024). Charging ahead-addressing key barriers to electric vehicle market penetration in India. Int. J. Innov. Res. Computer Sci. & Tech, 12, 45-50.
Wicki, M., Brückmann, G., Quoss, F., & Bernauer, T. (2023). What do we really know about the acceptance of battery electric vehicles?–Turns out, not much. Transport reviews, 43(1), 62-87.
Received: 18-April-2026, Manuscript No. AMSJ-26-17211; Editor assigned: 20-April-2026, PreQC No. AMSJ-26-17211(PQ); Reviewed: 04-May-2026, QC No. AMSJ-26-17211; Revised: 11-May-2026, Manuscript No. AMSJ-26-17211; Published: 19-May-2026